Getest

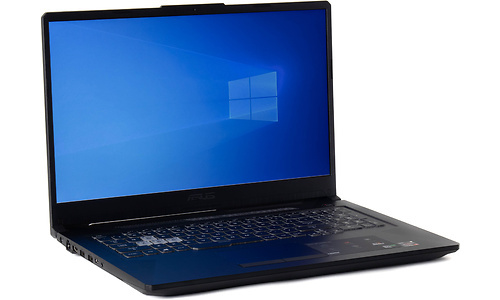
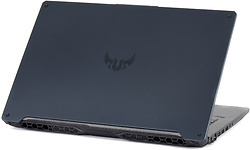
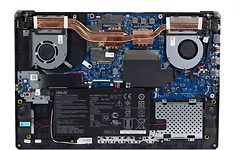
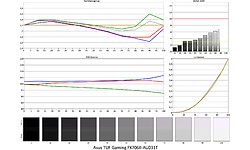
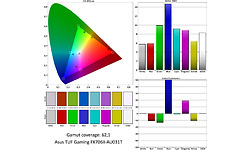
Asus TUF Gaming FX706II-AU031T

Prijsverloop

Dit product is niet (meer) verkrijgbaar bij de bij Hardware Info aangesloten shops.

Specificaties

Belangrijkste specificaties

Processor type AMD Ryzen 5 4600H
Geheugen capaciteit 16 GB
Scherm diagonaal 17,3 inch
Resolutie 1920x1080
Touchscreen
GPU type Nvidia GeForce GTX 1650 Ti
Totale opslagcapaciteit 512 GB
Toetsenbordindeling Qwerty
Gewicht totaal 2,50 kg
Besturingssysteem (serie) Windows

Processor / Chipset / Geheugen

Processor serie AMD Ryzen 5
Processor type AMD Ryzen 5 4600H
Processor klokfrequentie 2,3 GHz
Processor klokfrequentie (max. turbo) 4 GHz
Aantal processorcores 6
Geheugen capaciteit 16 GB
Type geheugen DDR4
Geheugen klokfrequentie 3.200 MHz
Geheugen form factor Sodimm
SODIMM sloten 2
Vrije SODIMM sloten 0
Werkgeheugen uitbreidbaar tot 32 GB

Scherm

Scherm diagonaal 17,3 inch
Resolutie 1920x1080
Verhouding 16:9
Pixeldichtheid 127 ppi
Scherm type (mat/glans) Mat
Paneeltype IPS
LED-achtergrondverlichting
Touchscreen
Geschikt voor peninvoer
Maximale verversingsfrequentie 60 Hz

Graphics

GPU type Nvidia GeForce GTX 1650 Ti
Geïntegreerde / losse GPU Losse chip
Videogeheugen 4 GB

Opslag

Totale opslagcapaciteit 512 GB
SSD opslagcapaciteit 512 GB
Beschikbaar opslaggeheugen 411,5 GB
Aantal harddisks / SSD's 1
Harddisk/SSD 1 capaciteit 512 GB
Harddisk/SSD 1 soort SSD/Flash
Harddisk/SSD 1 form factor M.2
Harddisk/SSD 1 merk/product Kingston OM8PCP3512F-AB
DVD branden
Blu-ray lezen
Blu-ray branden

Connectiviteit / Netwerk

Netwerkaansluiting (bedraad)
Netwerksnelheid (bedraad) 1000 Mbit/s
WiFi standaard 802.11ac (Wi-Fi 5)
WiFi adapter Realtek 8822CE Wireless LAN 802.11ac PCI-E NIC
Bluetooth
Bluetooth-versie Bluetooth 5.1
4G (LTE)

Aansluitingen

Smartcard
USB 3.2 - 5 Gb/s (Type-A) 3
USB 3.2 - 10 Gb/s (Type-C) 1
Cardreader - SD
Cardreader - MicroSD
DVI-uitgang
VGA-uitgang
HDMI-uitgang
Aantal HDMI-uitgangen 1
Micro HDMI-uitgang
HDMI-versie 2.0
DisplayPort-uitgang
Mini DisplayPort-uitgang
Analoge audio aansluitingen 1
Aansluiting dockingstation
Kensingtonslot

Toetsenbord en touchpad

Toetsenbordindeling Qwerty
Numeriek toetsenbord
Toetsenbordverlichting helderheidsniveaus 3
Toetsenbordverlichting kleur RGB
Touchpad MS Precision compatible
Touchpad afzonderlijke muistoetsen

Camera

Webcam
Webcam resolutie 0,9 MPixel
Tweede camera
Flitser
Camera Windows Hello compatible

Sensors

Accelerometer
Vingerafdruklezer
GPS
Kompas
NFC

Overige hardware

Trusted Platform Module (TPM)
Geïntegreerde microfoon

Maten en gewichten

Accu capaciteit (Wh) 48 Wh
Verwisselbare accu
Gewicht totaal 2,50 kg
Afmeting - Breedte 39,9 cm
Afmeting - Diepte 26,9 cm
Afmeting - Hoogte/Dikte 2,93 cm

Software

Besturingssysteem Microsoft Windows 10 Home
Besturingssysteem (serie) Windows
Windows versie 1909
Windows OS Build 18.363,959
Aantal bits OS 64 bit

Fabrikantsopgave eigenschappen

Garantie 2 jaar

Productcodes

SKU 90NR03P1-M02060, FX706II-AU031T
EAN 4718017649971
Toegevoegd aan Hardware Info woensdag 10 juni 2020

Testresultaten

Dit product is door Hardware Info getest op maandag 3 augustus 2020.

Platform onafhankelijke tests

Opstarttijd 12,51 sec.
Testconfiguratie
  • Platform onafhankelijke tests
WiFi speedtest 2.4GHz receive 198 Mbit/s
Testconfiguratie
  • Platform onafhankelijke tests
WiFi speedtest 2.4GHz send 175 Mbit/s
Testconfiguratie
  • Platform onafhankelijke tests
WiFi speedtest 5.0GHz receive 566 Mbit/s
Testconfiguratie
  • Platform onafhankelijke tests
WiFi speedtest 5.0GHz send 601 Mbit/s
Testconfiguratie
  • Platform onafhankelijke tests

Windows benchmarks

3DMark - Ice Storm 86.815
Testconfiguratie
  • Windows benchmarks
3DMark - Cloud Gate 30.759
Testconfiguratie
  • Windows benchmarks
3DMark - Cloud Gate Graphics 56.018
Testconfiguratie
  • Windows benchmarks
3DMark - Cloud Gate Physics 11.931
Testconfiguratie
  • Windows benchmarks
3DMark - Fire Strike 9.468
Testconfiguratie
  • Windows benchmarks
3DMark - Fire Strike Graphics 10.348
Testconfiguratie
  • Windows benchmarks
3DMark - Fire Strike Physics 18.267
Testconfiguratie
  • Windows benchmarks
3DMark - Fire Strike Combined 4.012
Testconfiguratie
  • Windows benchmarks
3DMark - Fire Strike Extreme 4.660
Testconfiguratie
  • Windows benchmarks
3DMark - Time Spy 4.006
Testconfiguratie
  • Windows benchmarks
3DMark - Time Spy Graphics 3.746
Testconfiguratie
  • Windows benchmarks
3DMark - Time Spy CPU 6.616
Testconfiguratie
  • Windows benchmarks
3DMark - Night Raid 27.788
Testconfiguratie
  • Windows benchmarks
3DMark - Night Raid Graphics 40.478
Testconfiguratie
  • Windows benchmarks
3DMark - Night Raid CPU 10.009
Testconfiguratie
  • Windows benchmarks
Cinebench R15 - Single 175
Testconfiguratie
  • Windows benchmarks
Cinebench R15 - Multi 1.399
Testconfiguratie
  • Windows benchmarks
Cinebench R20 - Single 436
Testconfiguratie
  • Windows benchmarks
Cinebench R20 - Multi 3.148
Testconfiguratie
  • Windows benchmarks
PCMark 8 v2 - Home 4.481
Testconfiguratie
  • Windows benchmarks
PCMark 8 v2 - Creative 5.285
Testconfiguratie
  • Windows benchmarks
PCMark 8 v2 - Work 3.814
Testconfiguratie
  • Windows benchmarks
PCMark 8 - Storage 2.0 - Storage Score 4.909
Testconfiguratie
  • Windows benchmarks
PCMark 8 - Storage 2.0 - Storage Bandwidth 258,1 MB/s
Testconfiguratie
  • Windows benchmarks
Geekbench4 - Multi 21.940
Testconfiguratie
  • Windows benchmarks
Geekbench4 - Multi crypto 13.614
Testconfiguratie
  • Windows benchmarks
Geekbench4 - Multi integer 27.150
Testconfiguratie
  • Windows benchmarks
Geekbench4 - Multi float 26.382
Testconfiguratie
  • Windows benchmarks
Geekbench4 - Multi memory 5.636
Testconfiguratie
  • Windows benchmarks
Geekbench4 - Single 4.667
Testconfiguratie
  • Windows benchmarks
Geekbench4 - Single crypto 5.088
Testconfiguratie
  • Windows benchmarks
Geekbench4 - Single integer 4.439
Testconfiguratie
  • Windows benchmarks
Geekbench4 - Single float 4.897
Testconfiguratie
  • Windows benchmarks
Geekbench4 - Single memory 4.730
Testconfiguratie
  • Windows benchmarks

Energieverbruik / Accu

Energieverbruik uit 0,4 W
Testconfiguratie
  • Windows benchmarks
Energieverbruik adapter (zonder laptop) 0,1 W
Testconfiguratie
  • Windows benchmarks
Energieverbruik idle 11,5 W
Testconfiguratie
  • Windows benchmarks
Browser accutest - 180 cd/m2 362 min.
Testconfiguratie
  • Windows benchmarks
PCMark Creative accutest - 180 cd/m2 189 min.
Testconfiguratie
  • Windows benchmarks
PCMark Creative (Accu) 3.915
Testconfiguratie
  • Windows benchmarks

Testresultaten beeldscherm

Gemeten kleurruimte sRGB
Testconfiguratie
  • Beeldscherm test SpectraCal CALman 5.13
Kleurtemperatuur 6.774 K
Testconfiguratie
  • Beeldscherm test SpectraCal CALman 5.13
Helderheid wit 256 cd/m²
Testconfiguratie
  • Beeldscherm test SpectraCal CALman 5.13
Helderheid zwart 0,20 cd/m²
Testconfiguratie
  • Beeldscherm test SpectraCal CALman 5.13
Contrast 1.280,9 : 1
Testconfiguratie
  • Beeldscherm test SpectraCal CALman 5.13
Checkerboard wit 256,262 cd/m²
Testconfiguratie
  • Beeldscherm test SpectraCal CALman 5.13
Checkerboard zwart 0,196 cd/m²
Testconfiguratie
  • Beeldscherm test SpectraCal CALman 5.13
Checkerboard contrast 1.307 : 1
Testconfiguratie
  • Beeldscherm test SpectraCal CALman 5.13
Gamma 2,22
Testconfiguratie
  • Beeldscherm test SpectraCal CALman 5.13
Gamma (afwijking van 2,2) 0,02
Testconfiguratie
  • Beeldscherm test SpectraCal CALman 5.13
Kleurafwijking rood (Delta E 1994) 5,23
Testconfiguratie
  • Beeldscherm test SpectraCal CALman 5 i.c.m. X
  • Rite i1 Display Pro colorimeter
Kleurafwijking groen (Delta E 1994) 10,24
Testconfiguratie
  • Beeldscherm test SpectraCal CALman 5 i.c.m. X
  • Rite i1 Display Pro colorimeter
Kleurafwijking blauw (Delta E 1994) 14,06
Testconfiguratie
  • Beeldscherm test SpectraCal CALman 5 i.c.m. X
  • Rite i1 Display Pro colorimeter
Kleurafwijking cyaan (Delta E 1994) 8,24
Testconfiguratie
  • Beeldscherm test SpectraCal CALman 5 i.c.m. X
  • Rite i1 Display Pro colorimeter
Kleurafwijking magenta (Delta E 1994) 8,44
Testconfiguratie
  • Beeldscherm test SpectraCal CALman 5 i.c.m. X
  • Rite i1 Display Pro colorimeter
Kleurafwijking geel (Delta E 1994) 6,01
Testconfiguratie
  • Beeldscherm test SpectraCal CALman 5 i.c.m. X
  • Rite i1 Display Pro colorimeter
Gemiddelde kleurafwijking (Delta E 1994) 8,7
Testconfiguratie
  • Beeldscherm test SpectraCal CALman 5 i.c.m. X
  • Rite i1 Display Pro colorimeter
Gemiddelde grijsafwijking (Delta E 1994) 4,5
Testconfiguratie
  • Beeldscherm test SpectraCal CALman 5 i.c.m. X
  • Rite i1 Display Pro colorimeter
Kleurafwijking 75% wit (Delta E 2000) 5,75 mΔuv
Testconfiguratie
  • Beeldscherm test SpectraCal CALman 5 i.c.m. X
  • Rite i1 Display Pro colorimeter
Kleurafwijking 75% rood (Delta E 2000) 5,94 mΔuv
Testconfiguratie
  • Beeldscherm test SpectraCal CALman 5 i.c.m. X
  • Rite i1 Display Pro colorimeter
Kleurafwijking 75% groen (Delta E 2000) 9,91 mΔuv
Testconfiguratie
  • Beeldscherm test SpectraCal CALman 5 i.c.m. X
  • Rite i1 Display Pro colorimeter
Kleurafwijking 75% blauw (Delta E 2000) 14,73 mΔuv
Testconfiguratie
  • Beeldscherm test SpectraCal CALman 5 i.c.m. X
  • Rite i1 Display Pro colorimeter
Kleurafwijking 75% cyaan (Delta E 2000) 9,16 mΔuv
Testconfiguratie
  • Beeldscherm test SpectraCal CALman 5 i.c.m. X
  • Rite i1 Display Pro colorimeter
Kleurafwijking 75% magenta (Delta E 2000) 8,87 mΔuv
Testconfiguratie
  • Beeldscherm test SpectraCal CALman 5 i.c.m. X
  • Rite i1 Display Pro colorimeter
Kleurafwijking 75% geel (Delta E 2000) 6,39 mΔuv
Testconfiguratie
  • Beeldscherm test SpectraCal CALman 5 i.c.m. X
  • Rite i1 Display Pro colorimeter
Gemiddelde kleurafwijking (Delta E 2000) 8,6 mΔuv
Testconfiguratie
  • Beeldscherm test SpectraCal CALman 5.13
Kleurafwijking 100% wit (Delta E 2000) 8,29 mΔuv
Testconfiguratie
  • Beeldscherm test SpectraCal CALman 5 i.c.m. X
  • Rite i1 Display Pro colorimeter
Gemiddelde kleurafwijking excl. wit (Delta E 2000) 9,2
Testconfiguratie
  • Beeldscherm test SpectraCal CALman 5 i.c.m. X
  • Rite i1 Display Pro colorimeter
Gemiddelde grijsafwijking (Delta E 2000) 4,8 mΔuv
Testconfiguratie
  • Beeldscherm test SpectraCal CALman 5.13
sRGB dekking 62,1 %
Testconfiguratie
  • Beeldscherm test SpectraCal CALman 5.13
DCI-P3 dekking 45,9 %
Testconfiguratie
  • Beeldscherm test SpectraCal CALman 5.13
Rec 2020 dekking 33 %
Testconfiguratie
  • Beeldscherm test SpectraCal CALman 5.13

Windows Game Benchmarks 2018

Far Cry 5 - 1920x1080 - Medium 75 fps
Testconfiguratie
  • Windows Game Benchmarks 2018
Far Cry 5 - 1920x1080 - Ultra 60 fps
Testconfiguratie
  • Windows Game Benchmarks 2018
Far Cry 5 - 3840x2160 - Medium 25 fps
Testconfiguratie
  • Windows Game Benchmarks 2018
Far Cry 5 - 3840x2160 - Ultra 21 fps
Testconfiguratie
  • Windows Game Benchmarks 2018
GTA V - 1920x1080 - Medium 104,7 fps
Testconfiguratie
  • Windows Game Benchmarks 2018
GTA V - 1920x1080 - Ultra 60 fps
Testconfiguratie
  • Windows Game Benchmarks 2018
GTA V - 3840x2160 - Medium 40,1 fps
Testconfiguratie
  • Windows Game Benchmarks 2018
GTA V - 3840x2160 - Ultra 21,8 fps
Testconfiguratie
  • Windows Game Benchmarks 2018
Rise of the Tomb Raider - 1920x1080 - Medium 89,9 fps
Testconfiguratie
  • Windows Game Benchmarks 2018
Rise of the Tomb Raider - 1920x1080 - Ultra 57,87 fps
Testconfiguratie
  • Windows Game Benchmarks 2018
Rise of the Tomb Raider - 3840x2160 - Medium 30,03 fps
Testconfiguratie
  • Windows Game Benchmarks 2018
Rise of the Tomb Raider - 3840x2160 - Ultra 19,38 fps
Testconfiguratie
  • Windows Game Benchmarks 2018
0