
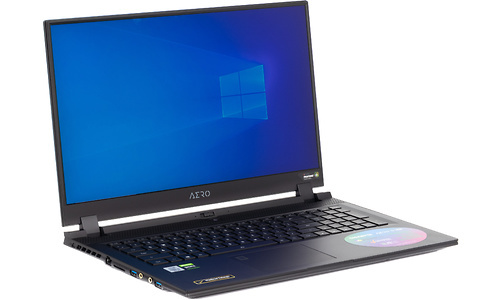
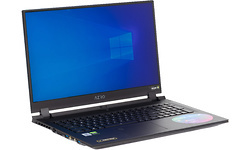
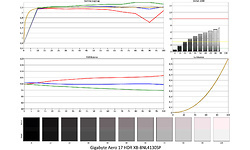
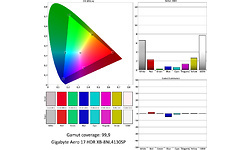
Gigabyte Aero 17 HDR XB-8NL4130SP

Dit product is niet (meer) verkrijgbaar bij de bij Hardware Info aangesloten shops.
| Processor type | Intel Core i7 10875H |
| Geheugen capaciteit | 16 GB |
| Scherm diagonaal | 17,3 inch |
| Resolutie | 3840x2160 |
| Touchscreen | |
| GPU type | Nvidia GeForce RTX 2070 Super Max-Q Design |
| Totale opslagcapaciteit | 512 GB |
| Toetsenbordindeling | Qwerty |
| Gewicht totaal | 2,64 kg |
| Besturingssysteem (serie) | Windows Pro |
| Processor serie | Intel Core i7 |
| Processor type | Intel Core i7 10875H |
| Processor klokfrequentie | 2,3 GHz |
| Processor klokfrequentie (max. turbo) | 5,1 GHz |
| Aantal processorcores | 8 |
| Geheugen capaciteit | 16 GB |
| Type geheugen | DDR4 |
| Geheugen klokfrequentie | 2.933 MHz |
| SODIMM sloten | 2 |
| Vrije SODIMM sloten | 0 |
| Werkgeheugen uitbreidbaar tot | 16 GB |
| Scherm diagonaal | 17,3 inch |
| Resolutie | 3840x2160 |
| Verhouding | 16:9 |
| Pixeldichtheid | 255 ppi |
| Scherm type (mat/glans) | Mat |
| Paneeltype | IPS |
| Touchscreen | |
| Maximale verversingsfrequentie | 60 Hz |
| GPU type | Nvidia GeForce RTX 2070 Super Max-Q Design |
| Geïntegreerde / losse GPU | Losse chip |
| Videogeheugen | 8 GB |
| Totale opslagcapaciteit | 512 GB |
| SSD opslagcapaciteit | 512 GB |
| Beschikbaar opslaggeheugen | 421,1 GB |
| Aantal harddisks / SSD's | 1 |
| Harddisk/SSD 1 capaciteit | 512 GB |
| Harddisk/SSD 1 soort | SSD/Flash |
| Harddisk/SSD 1 form factor | M.2 |
| Harddisk/SSD 1 merk/product | Intel Optane+477GBSSD |
| DVD branden | |
| Blu-ray lezen | |
| Blu-ray branden |
| Netwerkaansluiting (bedraad) | |
| Netwerkadapter (bedraad) | Killer E2600 |
| Netwerksnelheid (bedraad) | 1000 Mbit/s |
| WiFi standaard | 802.11ax (Wi-Fi 6) |
| WiFi adapter | Killer Wi-Fi 6 AX1650x 160Mhz |
| Bluetooth | |
| Bluetooth-versie | Bluetooth 5.0 |
| 4G (LTE) |
| Smartcard | |
| USB 3.2 - 5 Gb/s (Type-A) | 3 |
| Thunderbolt 3 (Type-C) | 1 |
| Cardreader - SD | |
| Cardreader - MicroSD | |
| DVI-uitgang | |
| VGA-uitgang | |
| HDMI-uitgang | |
| Aantal HDMI-uitgangen | 1 |
| Micro HDMI-uitgang | |
| HDMI-versie | 2.0 |
| DisplayPort-uitgang | |
| Mini DisplayPort-uitgang | |
| Aantal mini DisplayPort-uitgangen | 1 |
| DisplayPort-versie | 1.4 |
| Analoge audio aansluitingen | 2 |
| Aansluiting dockingstation | |
| Kensingtonslot |
| Toetsenbordindeling | Qwerty |
| Numeriek toetsenbord | |
| Toetsenbordverlichting helderheidsniveaus | 2 |
| Toetsenbordverlichting kleur | RGB |
| Touchpad MS Precision compatible | |
| Touchpad afzonderlijke muistoetsen |
| Webcam | |
| Webcam resolutie | 0,9 MPixel |
| Tweede camera | |
| Flitser | |
| Camera Windows Hello compatible |
| Accelerometer | |
| Vingerafdruklezer | |
| GPS | |
| Kompas | |
| NFC |
| Geïntegreerde microfoon |
| Accu capaciteit (Wh) | 94,2 Wh |
| Verwisselbare accu | |
| Gewicht totaal | 2,64 kg |
| Afmeting - Breedte | 39,6 cm |
| Afmeting - Diepte | 27 cm |
| Afmeting - Hoogte/Dikte | 2,5 cm |
| Besturingssysteem | Microsoft Windows 10 Pro |
| Besturingssysteem (serie) | Windows Pro |
| Windows versie | 1909 |
| Windows OS Build | 18.363,815 |
| Aantal bits OS | 64 bit |
| Garantie | 1 jaar |
| SKU | AERO 17 HDR XB-8NL4130SP | |
| EAN | 4719331972776 | |
| Toegevoegd aan Hardware Info | donderdag 7 mei 2020 |

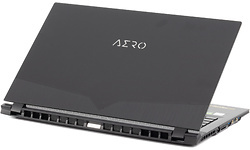
Gigabyte voorzag recent zijn Aero 17-gaminglaptop met een nieuwe '10th Gen' Intel Core-processor en Nvidia 'Super'-videochip. Bovendien is de dunne en lichte 'creator-laptop' nu in Nederland te koop.
22 juni 2020 07:50
