Getest

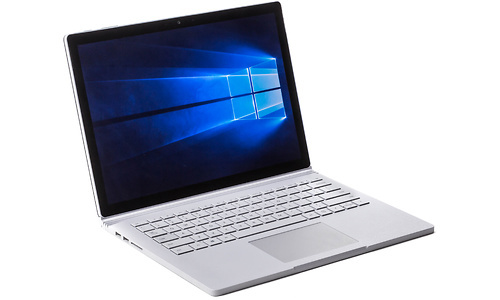
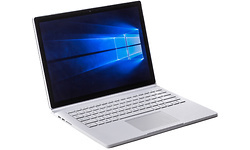
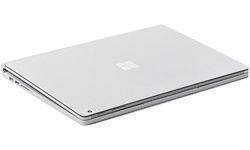
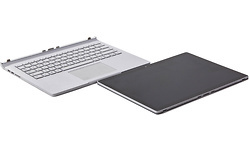
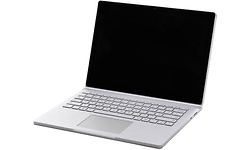
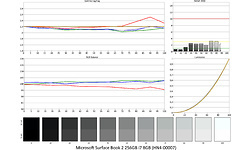
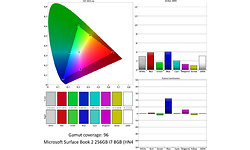
Microsoft Surface Book 2 256GB i7 8GB (HN4-00007)

Prijsverloop

Dit product is niet (meer) verkrijgbaar bij de bij Hardware Info aangesloten shops.

Specificaties

Belangrijkste specificaties

Processor type Intel Core i7 8650U
Geheugen capaciteit 8 GB
Scherm diagonaal 13,5 inch
Resolutie 3000x2000
Touchscreen
GPU type Nvidia GeForce GTX 1050
Totale opslagcapaciteit 256 GB
Toetsenbordindeling Qwerty
Gewicht totaal 1,62 kg
Besturingssysteem (serie) Windows Pro

Processor / Chipset / Geheugen

Processor serie Intel Core i7
Processor type Intel Core i7 8650U
Processor klokfrequentie 1,9 GHz
Processor klokfrequentie (max. turbo) 4,2 GHz
Configureerbare TDP-down 10 W
Configureerbare TDP-up 25 W
Configureerbare TDP-downfrequentie 1 GHz
Configureerbare TDP-upfrequentie 2 GHz
Aantal processorcores 4
Geheugen capaciteit 8 GB
Type geheugen DDR3
Geheugen klokfrequentie 1.867 MHz
SODIMM sloten 0
Vrije SODIMM sloten 0
Werkgeheugen uitbreidbaar tot 8 GB

Scherm

Scherm diagonaal 13,5 inch
Resolutie 3000x2000
Verhouding 3:2
Pixeldichtheid 267 ppi
Scherm type (mat/glans) Glanzend
Paneeltype IPS
LED-achtergrondverlichting
Touchscreen
Aanraakpunten touchscreen 10 aanraakpunten
Touchscreen type Capacitief
Geschikt voor peninvoer
3D-scherm

Graphics

GPU type Nvidia GeForce GTX 1050
Geïntegreerde / losse GPU Losse chip
Videogeheugen 2 GB

Opslag

Totale opslagcapaciteit 256 GB
SSD opslagcapaciteit 256 GB
Beschikbaar opslaggeheugen 207,9 GB
Aantal harddisks / SSD's 1
Harddisk/SSD 1 capaciteit 256 GB
Harddisk/SSD 1 soort SSD/Flash
Harddisk/SSD 1 form factor M.2
Harddisk/SSD 1 merk/product Samsung MZFLW256HEHP-000MV
Optische drive merk/product -
DVD branden
Blu-ray lezen
Blu-ray branden

Connectiviteit / Netwerk

Netwerkaansluiting (bedraad)
WiFi standaard 802.11ac (Wi-Fi 5)
WiFi adapter Marvell Avastar Wireless AC
Bluetooth
Bluetooth-versie Bluetooth 4.2
Infrarood
3G (HSPA/UMTS)
4G (LTE)

Aansluitingen

ExpressCard (type) -
Smartcard
USB 2.0 (Type-A) 0
USB 3.2 - 5 Gb/s (Type-A) 2
USB 3.2 - 5 Gb/s (Type-C) 1
USB 3.0 (USB 3.1 Gen 1) 3
USB 3.1 (USB 3.1 Gen 2) 2
USB Type-C
Cardreader - SD
Cardreader - MicroSD
DVI-uitgang
VGA-uitgang
HDMI-uitgang
Micro HDMI-uitgang
DisplayPort-uitgang
Mini DisplayPort-uitgang
Analoge audio aansluitingen 1
Aansluiting dockingstation
Kensingtonslot

Toetsenbord en touchpad

Toetsenbordindeling Qwerty
Numeriek toetsenbord

Camera

Webcam
Webcam resolutie 4,9 MPixel
Tweede camera
Tweede cameraresolutie 8 MPixel
Flitser
Camera Windows Hello compatible

Sensors

Accelerometer
Vingerafdruklezer
GPS
Kompas
NFC

Overige hardware

Trusted Platform Module (TPM)
Geïntegreerde microfoon

Maten en gewichten

Accu capaciteit (Wh) 58 Wh
Accu 2 capaciteit (Wh) 18 Wh
Verwisselbare accu
Gewicht totaal 1,62 kg
Gewicht tablet (bij 2-in-1 apparaten) 0,71 kg
Afmeting - Breedte 31,2 cm
Afmeting - Diepte 23,2 cm
Afmeting - Hoogte/Dikte 2,2 cm

Software

Besturingssysteem Microsoft Windows 10 Pro
Besturingssysteem (serie) Windows Pro
Aantal bits OS 64 bit

Fabrikantsopgave eigenschappen

Garantie 2 jaar

Productcodes

SKU HN4-00007
EAN 0889842248913
Toegevoegd aan Hardware Info maandag 13 november 2017

Testresultaten

Dit product is door Hardware Info getest op zondag 20 mei 2018.

Platform onafhankelijke tests

Opstarttijd 13,3 sec.
Testconfiguratie
  • Platform onafhankelijke tests
WiFi speedtest 2.4GHz receive 99 Mbit/s
Testconfiguratie
  • Platform onafhankelijke tests
WiFi speedtest 2.4GHz send 86 Mbit/s
Testconfiguratie
  • Platform onafhankelijke tests
WiFi speedtest 5.0GHz receive 428 Mbit/s
Testconfiguratie
  • Platform onafhankelijke tests
WiFi speedtest 5.0GHz send 552 Mbit/s
Testconfiguratie
  • Platform onafhankelijke tests

Windows benchmarks

3DMark - Ice Storm 32.725
Testconfiguratie
  • Windows benchmarks
3DMark - Cloud Gate 18.389
Testconfiguratie
  • Windows benchmarks
3DMark - Cloud Gate Graphics 30.197
Testconfiguratie
  • Windows benchmarks
3DMark - Cloud Gate Physics 7.764
Testconfiguratie
  • Windows benchmarks
3DMark - Fire Strike 5.214
Testconfiguratie
  • Windows benchmarks
3DMark - Fire Strike Graphics 5.765
Testconfiguratie
  • Windows benchmarks
3DMark - Fire Strike Physics 10.770
Testconfiguratie
  • Windows benchmarks
3DMark - Fire Strike Combined 2.095
Testconfiguratie
  • Windows benchmarks
3DMark - Fire Strike Extreme 2.531
Testconfiguratie
  • Windows benchmarks
3DMark - Time Spy 1.467
Testconfiguratie
  • Windows benchmarks
3DMark - Time Spy Graphics 1.604
Testconfiguratie
  • Windows benchmarks
3DMark - Time Spy CPU 3.436
Testconfiguratie
  • Windows benchmarks
Cinebench R15 - Single 147
Testconfiguratie
  • Windows benchmarks
Cinebench R15 - Multi 658
Testconfiguratie
  • Windows benchmarks
PCMark 8 v2 - Home 2.840
Testconfiguratie
  • Windows benchmarks
PCMark 8 v2 - Creative 4.033
Testconfiguratie
  • Windows benchmarks
PCMark 8 v2 - Work 3.135
Testconfiguratie
  • Windows benchmarks
PCMark 8 - Storage 2.0 - Storage Score 5.024
Testconfiguratie
  • Windows benchmarks
PCMark 8 - Storage 2.0 - Storage Bandwidth 345,33 MB/s
Testconfiguratie
  • Windows benchmarks
Geekbench4 - Multi 14.305
Testconfiguratie
  • Windows benchmarks
Geekbench4 - Multi crypto 13.830
Testconfiguratie
  • Windows benchmarks
Geekbench4 - Multi integer 17.522
Testconfiguratie
  • Windows benchmarks
Geekbench4 - Multi float 16.473
Testconfiguratie
  • Windows benchmarks
Geekbench4 - Multi memory 3.932
Testconfiguratie
  • Windows benchmarks
Geekbench4 - Single 4.679
Testconfiguratie
  • Windows benchmarks
Geekbench4 - Single crypto 4.759
Testconfiguratie
  • Windows benchmarks
Geekbench4 - Single integer 5.075
Testconfiguratie
  • Windows benchmarks
Geekbench4 - Single float 4.856
Testconfiguratie
  • Windows benchmarks
Geekbench4 - Single memory 3.505
Testconfiguratie
  • Windows benchmarks

Energieverbruik / Accu

Energieverbruik uit 0,4 W
Testconfiguratie
  • Windows benchmarks
Energieverbruik adapter (zonder laptop) 0,2 W
Testconfiguratie
  • Windows benchmarks
Energieverbruik idle 11,2 W
Testconfiguratie
  • Windows benchmarks
Browser accutest - 180 cd/m2 746 min.
Testconfiguratie
  • Windows benchmarks
Browser accutest - 180 cd/m2 (Tablet) 181 min.
Testconfiguratie
  • Windows benchmarks
PCMark Creative accutest - 180 cd/m2 232 min.
Testconfiguratie
  • Windows benchmarks
PCMark Creative accutest - 180 cd/m2 (Tablet) 99 min.
Testconfiguratie
  • Windows benchmarks
PCMark Creative (Accu) 4.147
Testconfiguratie
  • Windows benchmarks

Testresultaten beeldscherm

Kleurtemperatuur 6.734 K
Testconfiguratie
  • Beeldscherm test SpectraCal CALman 5.13
Helderheid wit 408 cd/m²
Testconfiguratie
  • Beeldscherm test SpectraCal CALman 5.13
Helderheid zwart 0,24 cd/m²
Testconfiguratie
  • Beeldscherm test SpectraCal CALman 5.13
Contrast 1.701,1 : 1
Testconfiguratie
  • Beeldscherm test SpectraCal CALman 5.13
Gamma 2,13
Testconfiguratie
  • Beeldscherm test SpectraCal CALman 5.13
Gamma (afwijking van 2,2) 0,07
Testconfiguratie
  • Beeldscherm test SpectraCal CALman 5.13
Kleurafwijking rood (Delta E 1994) 3,27
Testconfiguratie
  • Beeldscherm test SpectraCal CALman 5 i.c.m. X
  • Rite i1 Display Pro colorimeter
Kleurafwijking groen (Delta E 1994) 2,03
Testconfiguratie
  • Beeldscherm test SpectraCal CALman 5 i.c.m. X
  • Rite i1 Display Pro colorimeter
Kleurafwijking blauw (Delta E 1994) 3,87
Testconfiguratie
  • Beeldscherm test SpectraCal CALman 5 i.c.m. X
  • Rite i1 Display Pro colorimeter
Kleurafwijking cyaan (Delta E 1994) 2,10
Testconfiguratie
  • Beeldscherm test SpectraCal CALman 5 i.c.m. X
  • Rite i1 Display Pro colorimeter
Kleurafwijking magenta (Delta E 1994) 1,31
Testconfiguratie
  • Beeldscherm test SpectraCal CALman 5 i.c.m. X
  • Rite i1 Display Pro colorimeter
Kleurafwijking geel (Delta E 1994) 0,97
Testconfiguratie
  • Beeldscherm test SpectraCal CALman 5 i.c.m. X
  • Rite i1 Display Pro colorimeter
Gemiddelde kleurafwijking (Delta E 1994) 2,3
Testconfiguratie
  • Beeldscherm test SpectraCal CALman 5 i.c.m. X
  • Rite i1 Display Pro colorimeter
Gemiddelde grijsafwijking (Delta E 1994) 1,9
Testconfiguratie
  • Beeldscherm test SpectraCal CALman 5 i.c.m. X
  • Rite i1 Display Pro colorimeter
Kleurafwijking 75% rood (Delta E 2000) 3,87 mΔuv
Testconfiguratie
  • Beeldscherm test SpectraCal CALman 5 i.c.m. X
  • Rite i1 Display Pro colorimeter
Kleurafwijking 75% groen (Delta E 2000) 1,68 mΔuv
Testconfiguratie
  • Beeldscherm test SpectraCal CALman 5 i.c.m. X
  • Rite i1 Display Pro colorimeter
Kleurafwijking 75% blauw (Delta E 2000) 4,05 mΔuv
Testconfiguratie
  • Beeldscherm test SpectraCal CALman 5 i.c.m. X
  • Rite i1 Display Pro colorimeter
Kleurafwijking 75% cyaan (Delta E 2000) 2,03 mΔuv
Testconfiguratie
  • Beeldscherm test SpectraCal CALman 5 i.c.m. X
  • Rite i1 Display Pro colorimeter
Kleurafwijking 75% magenta (Delta E 2000) 1,29 mΔuv
Testconfiguratie
  • Beeldscherm test SpectraCal CALman 5 i.c.m. X
  • Rite i1 Display Pro colorimeter
Kleurafwijking 75% geel (Delta E 2000) 0,97 mΔuv
Testconfiguratie
  • Beeldscherm test SpectraCal CALman 5 i.c.m. X
  • Rite i1 Display Pro colorimeter
Gemiddelde kleurafwijking excl. wit (Delta E 2000) 2,3
Testconfiguratie
  • Beeldscherm test SpectraCal CALman 5 i.c.m. X
  • Rite i1 Display Pro colorimeter
Gemiddelde grijsafwijking (Delta E 2000) 2,3 mΔuv
Testconfiguratie
  • Beeldscherm test SpectraCal CALman 5.13

Windows Game Benchmarks (2016-2017)

Metro Last Light -1920x1080 - Medium 57 fps
Testconfiguratie
  • Windows Game Benchmarks (2016
  • 2017)
Metro Last Light - 1920x1080 - Very High 34,8 fps
Testconfiguratie
  • Windows Game Benchmarks (2016
  • 2017)
Metro Last Light - 3840x2160 - Medium 46,5 fps
Testconfiguratie
  • Windows Game Benchmarks (2016
  • 2017)
Metro Last Light - 3840x2160 - Very High 26,9 fps
Testconfiguratie
  • Windows Game Benchmarks (2016
  • 2017)
Far Cry Primal - 1920x1080 - Low (HD Textures off) 48 fps
Testconfiguratie
  • Windows Game Benchmarks (2016
  • 2017)
Far Cry Primal - 1920x1080 - High 34 fps
Testconfiguratie
  • Windows Game Benchmarks (2016
  • 2017)
Far Cry Primal - 3840x2160 - Low (HD Textures off) 14 fps
Testconfiguratie
  • Windows Game Benchmarks (2016
  • 2017)
Far Cry Primal - 3840x2160 - High 9 fps
Testconfiguratie
  • Windows Game Benchmarks (2016
  • 2017)
GTA V - 1920x1080 - Normal 81 fps
Testconfiguratie
  • Windows Game Benchmarks (2016
  • 2017)
GTA V - 1920x1080 - High 55,9 fps
Testconfiguratie
  • Windows Game Benchmarks (2016
  • 2017)
GTA V - 3840x2160 - Normal 46,9 fps
Testconfiguratie
  • Windows Game Benchmarks (2016
  • 2017)
GTA V - 3840x2160 - High 24,6 fps
Testconfiguratie
  • Windows Game Benchmarks (2016
  • 2017)

Windows Game Benchmarks 2018

Far Cry 5 - 1920x1080 - Medium 29 fps
Testconfiguratie
  • Windows Game Benchmarks 2018
Far Cry 5 - 1920x1080 - Ultra 21 fps
Testconfiguratie
  • Windows Game Benchmarks 2018
Far Cry 5 - 3840x2160 - Medium 7 fps
Testconfiguratie
  • Windows Game Benchmarks 2018
Far Cry 5 - 3840x2160 - Ultra 5 fps
Testconfiguratie
  • Windows Game Benchmarks 2018
GTA V - 1920x1080 - Medium 62,5 fps
Testconfiguratie
  • Windows Game Benchmarks 2018
GTA V - 1920x1080 - Ultra 33,2 fps
Testconfiguratie
  • Windows Game Benchmarks 2018
GTA V - 3840x2160 - Medium 18,4 fps
Testconfiguratie
  • Windows Game Benchmarks 2018
GTA V - 3840x2160 - Ultra 2,8 fps
Testconfiguratie
  • Windows Game Benchmarks 2018
Rise of the Tomb Raider - 1920x1080 - Medium 39,1 fps
Testconfiguratie
  • Windows Game Benchmarks 2018
Rise of the Tomb Raider - 1920x1080 - Ultra 10,4 fps
Testconfiguratie
  • Windows Game Benchmarks 2018
Rise of the Tomb Raider - 3840x2160 - Medium 10,9 fps
Testconfiguratie
  • Windows Game Benchmarks 2018
Rise of the Tomb Raider - 3840x2160 - Ultra 3,9 fps
Testconfiguratie
  • Windows Game Benchmarks 2018
0