Prijsverloop

Specificaties

Belangrijkste specificaties

CPU-socket Socket AM4
Klokfrequentie 3,8 GHz
Aantal cores totaal 6 cores
Thermal design power 95 W
Geïntegreerde GPU

Processor

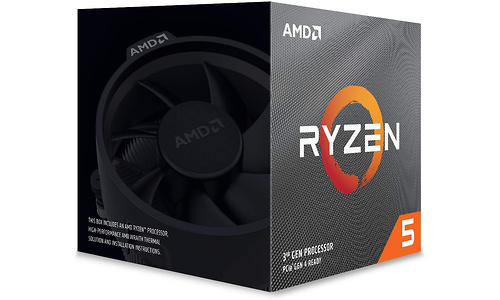
Processorserie Ryzen 5
CPU-core Matisse
CPU-socket Socket AM4
Klokfrequentie 3,8 GHz
Max. turbo klokfrequentie 4,4 GHz
Aantal cores totaal 6 cores
Aantal threads 12
HyperThreading / SMT
Multiplier 38 x
Multiplier unlocked
Bussnelheid / bClk 100 MHz
Geïntegreerde geheugencontroller DDR4-3200 (Dual Channel)
Thermal design power 95 W
Productie-procedé 7 nm
Aantal PCIe lanes 24
Uitvoering Boxed
Koeler meegeleverd

Geheugencontroller

Geïntegreerde geheugencontroller
Geheugentype DDR4
Geheugensnelheid 3.200 MHz
Geheugenkanalen 2

Video

Geïntegreerde GPU

Cache

L2-cache 3.072 kB
L3-cache 32 MB

Instructieset

IA-64
MMX
SSE
SSE2
SSE3
SSE4A
SSE4.1
SSE4.2
x86-64
XD-bit
AVX
AVX2
AVX-512
AES-NI

Productcodes

SKU 100-100000022BOX, RYZEN 5 3600X
EAN 0730143309912
Toegevoegd aan Hardware Info maandag 27 mei 2019

Testresultaten

Dit product is door Hardware Info getest op dinsdag 10 november 2020.

Stroomverbruik processors met TinkerForge

Stroomverbruik idle - ATX 12V 11,874 W
Testconfiguratie
  • Stroomverbruik processors TinkerForge (2021)
Stroomverbruik idle - EPS 12V2 2,665 W
Testconfiguratie
  • Stroomverbruik processors TinkerForge (2021)
Stroomverbruik idle - EPS 12V1 3,17 W
Testconfiguratie
  • Stroomverbruik processors TinkerForge (2021)
Stroomverbruik idle - CPU - Mediaan 5 min. 5,835 W
Testconfiguratie
  • Stroomverbruik processors TinkerForge (2021)
Stroomverbruik idle - CPU + moederbord - Mediaan 5 min. 17,709 W
Testconfiguratie
  • Stroomverbruik processors TinkerForge (2021)
Stroomverbruik Cinebench R20 - ATX 12V 15,794 W
Testconfiguratie
  • Stroomverbruik processors TinkerForge (2020)
Stroomverbruik Cinebench R20 - ATX 12V - Max 26,967 W
Testconfiguratie
  • Stroomverbruik processors TinkerForge (2020)
Stroomverbruik Cinebench R20 - EPS 12V1 49,025 W
Testconfiguratie
  • Stroomverbruik processors TinkerForge (2020)
Stroomverbruik Cinebench R20 - EPS 12V1 - Max 56,535 W
Testconfiguratie
  • Stroomverbruik processors TinkerForge (2020)
Stroomverbruik Cinebench R20 - EPS 12V2 42,122 W
Testconfiguratie
  • Stroomverbruik processors TinkerForge (2020)
Stroomverbruik Cinebench R20 - EPS 12V2 - Max 48,742 W
Testconfiguratie
  • Stroomverbruik processors TinkerForge (2020)
Stroomverbruik Cinebench R20 - CPU - Mediaan 91,147 W
Testconfiguratie
  • Stroomverbruik processors TinkerForge (2020)
Stroomverbruik Cinebench R20 - CPU + moederbord - Mediaan 106,941 W
Testconfiguratie
  • Stroomverbruik processors TinkerForge (2020)
Stroomverbruik Cinebench R20 - CPU + moederbord - Totaal 2,48 Wh
Testconfiguratie
  • Stroomverbruik processors TinkerForge (2020)
Stroomverbruik Premiere Pro - ATX 12V 30,838 W
Testconfiguratie
  • Stroomverbruik processors TinkerForge (2021)
Stroomverbruik Premiere Pro - ATX 12V - Max 47,234 W
Testconfiguratie
  • Stroomverbruik processors TinkerForge (2021)
Stroomverbruik Premiere Pro - EPS 12V1 44,438 W
Testconfiguratie
  • Stroomverbruik processors TinkerForge (2021)
Stroomverbruik Premiere Pro - EPS 12V1 - Max 55,834 W
Testconfiguratie
  • Stroomverbruik processors TinkerForge (2021)
Stroomverbruik Premiere Pro - EPS 12V2 38,077 W
Testconfiguratie
  • Stroomverbruik processors TinkerForge (2021)
Stroomverbruik Premiere Pro - EPS 12V2 - Max 47,948 W
Testconfiguratie
  • Stroomverbruik processors TinkerForge (2021)
Stroomverbruik Premiere Pro - CPU - Mediaan 82,515 W
Testconfiguratie
  • Stroomverbruik processors TinkerForge (2021)
Stroomverbruik Premiere Pro - CPU + moederbord - Mediaan 113,353 W
Testconfiguratie
  • Stroomverbruik processors TinkerForge (2021)

Testresultaten 2020-2 (Win 10 2004) RTX 3080

Red Dead 2 - 1920x1080 - Medium - Vulkan 131,9 fps
Testconfiguratie
  • CPU Test 2020
  • 2
Red Dead 2 - 1920x1080 - Medium - Vulkan (99p) 10,36 ms
Testconfiguratie
  • CPU Test 2020
  • 2
Red Dead 2 - 1920x1080 - Medium - Vulkan (99.9p) 11,32 ms
Testconfiguratie
  • CPU Test 2020
  • 2
Red Dead 2 - 1920x1080 - Ultra - Vulkan 126,8 fps
Testconfiguratie
  • CPU Test 2020
  • 2
Red Dead 2 - 1920x1080 - Ultra - Vulkan (99p) 10,46 ms
Testconfiguratie
  • CPU Test 2020
  • 2
Red Dead 2 - 1920x1080 - Ultra - Vulkan (99.9p) 11,67 ms
Testconfiguratie
  • CPU Test 2020
  • 2
Red Dead 2 - 3840x2160 - Medium - Vulkan 85,9 fps
Testconfiguratie
  • CPU Test 2020
  • 2
Red Dead 2 - 3840x2160 - Medium - Vulkan (99p) 14,99 ms
Testconfiguratie
  • CPU Test 2020
  • 2
Red Dead 2 - 3840x2160 - Medium - Vulkan (99.9p) 19,24 ms
Testconfiguratie
  • CPU Test 2020
  • 2
Red Dead 2 - 3840x2160 - Ultra - Vulkan 71,9 fps
Testconfiguratie
  • CPU Test 2020
  • 2
Red Dead 2 - 3840x2160 - Ultra - Vulkan (99p) 17,27 ms
Testconfiguratie
  • CPU Test 2020
  • 2
Red Dead 2 - 3840x2160 - Ultra - Vulkan (99.9p) 21 ms
Testconfiguratie
  • CPU Test 2020
  • 2
Metro Exodus - 1920x1080 - Medium 135 fps
Testconfiguratie
  • CPU Test 2020
  • 2
Metro Exodus - 1920x1080 - Medium (99p) 13,76 ms
Testconfiguratie
  • CPU Test 2020
  • 2
Metro Exodus - 1920x1080 - Medium (99.9p) 15,03 ms
Testconfiguratie
  • CPU Test 2020
  • 2
Metro Exodus - 1920x1080 - Ultra 106,3 fps
Testconfiguratie
  • CPU Test 2020
  • 2
Metro Exodus - 1920x1080 - Ultra (99p) 16,23 ms
Testconfiguratie
  • CPU Test 2020
  • 2
Metro Exodus - 1920x1080 - Ultra (99.9p) 17,51 ms
Testconfiguratie
  • CPU Test 2020
  • 2
Metro Exodus - 3840x2160 - Medium 93,5 fps
Testconfiguratie
  • CPU Test 2020
  • 2
Metro Exodus - 3840x2160 - Medium (99p) 17,61 ms
Testconfiguratie
  • CPU Test 2020
  • 2
Metro Exodus - 3840x2160 - Medium (99.9p) 21,6 ms
Testconfiguratie
  • CPU Test 2020
  • 2
Metro Exodus - 3840x2160 - Ultra 66,1 fps
Testconfiguratie
  • CPU Test 2020
  • 2
Metro Exodus - 3840x2160 - Ultra (99p) 25,71 ms
Testconfiguratie
  • CPU Test 2020
  • 2
Metro Exodus - 3840x2160 - Ultra (99.9p) 28,57 ms
Testconfiguratie
  • CPU Test 2020
  • 2
Total War: Troy - 1920x1080 - Medium 255,2 fps
Testconfiguratie
  • CPU Test 2020
  • 2
Total War: Troy - 1920x1080 - Medium (99p) 5,63 ms
Testconfiguratie
  • CPU Test 2020
  • 2
Total War: Troy - 1920x1080 - Medium (99.9p) 7,07 ms
Testconfiguratie
  • CPU Test 2020
  • 2
Total War: Troy - 1920x1080 - Ultra 116 fps
Testconfiguratie
  • CPU Test 2020
  • 2
Total War: Troy - 1920x1080 - Ultra (99p) 12,36 ms
Testconfiguratie
  • CPU Test 2020
  • 2
Total War: Troy - 1920x1080 - Ultra (99.9p) 13,93 ms
Testconfiguratie
  • CPU Test 2020
  • 2
F1 2020 - 1920x1080 - Medium 207,6 fps
Testconfiguratie
  • CPU Test 2020
  • 2
F1 2020 - 1920x1080 - Medium (99p) 6,9 ms
Testconfiguratie
  • CPU Test 2020
  • 2
F1 2020 - 1920x1080 - Medium (99.9p) 8 ms
Testconfiguratie
  • CPU Test 2020
  • 2
F1 2020 - 1920x1080 - Ultra 163,3 fps
Testconfiguratie
  • CPU Test 2020
  • 2
F1 2020 - 1920x1080 - Ultra (99p) 8,9 ms
Testconfiguratie
  • CPU Test 2020
  • 2
F1 2020 - 1920x1080 - Ultra (99.9p) 10,8 ms
Testconfiguratie
  • CPU Test 2020
  • 2
Far Cry: New Dawn - 1920x1080 - Medium 112,9 fps
Testconfiguratie
  • CPU Test 2020
  • 2
Far Cry: New Dawn - 1920x1080 - Medium (99p) 12,02 ms
Testconfiguratie
  • CPU Test 2020
  • 2
Far Cry: New Dawn - 1920x1080 - Medium (99.9p) 15,79 ms
Testconfiguratie
  • CPU Test 2020
  • 2
Far Cry: New Dawn - 1920x1080 - Ultra 100,5 fps
Testconfiguratie
  • CPU Test 2020
  • 2
Far Cry: New Dawn - 1920x1080 - Ultra (99p) 14,71 ms
Testconfiguratie
  • CPU Test 2020
  • 2
Far Cry: New Dawn - 1920x1080 - Ultra (99.9p) 16,62 ms
Testconfiguratie
  • CPU Test 2020
  • 2
Streaming (x264 6Mbit + F1 2020 1080p ultra 60fps) - gemid. 141,64 fps
Testconfiguratie
  • CPU Test 2020
  • 2

Testresultaten 2020-2 (Win 10 2004) Geïnt. GPU of GTX 1650

Cinebench R20 - Single 485,31
Testconfiguratie
  • CPU Test 2020
  • 2
Cinebench R20 - Multi 3.584,8
Testconfiguratie
  • CPU Test 2020
  • 2
Blender 2.90.1 Pavillion CPU Render 677 sec.
Testconfiguratie
  • CPU Test 2020
  • 2
Corona Render 1.3 145 sec.
Testconfiguratie
  • CPU Test 2020
  • 2
Fusion 360 - Raspberry Pi 4 B Render 4K 343 sec.
Testconfiguratie
  • CPU Test 2020
  • 2
Adobe Photoshop bewerking 158 sec.
Testconfiguratie
  • CPU Test 2020
  • 2
Adobe Premiere Pro HWI TV 4K 716 sec.
Testconfiguratie
  • CPU Test 2020
  • 2
Da Vinci Resolve - 4K Video 501 sec.
Testconfiguratie
  • CPU Test 2020
  • 2
StaxRip x264 r3018 195,34 fps
Testconfiguratie
  • CPU Test 2020
  • 2
StaxRip x265 3.4.0.26 69,38 fps
Testconfiguratie
  • CPU Test 2020
  • 2
Flac 1.3.3 - 1 uur WAV naar Flac 179 sec.
Testconfiguratie
  • CPU Test 2020
  • 2
7-Zip 20.02 - 4GB inpakken 118 sec.
Testconfiguratie
  • CPU Test 2020
  • 2
Chrome 86: Jetstream 2 150,309
Testconfiguratie
  • CPU Test 2020
  • 2
AIDA64 (6.25.5490) - Zlib 603 MB/s
Testconfiguratie
  • CPU Test 2020
  • 2
AIDA64 (6.25.5490) - AES 53.813 MB/s
Testconfiguratie
  • CPU Test 2020
  • 2
AIDA64 (6.25.5490) - Hash 18.365 MB/s
Testconfiguratie
  • CPU Test 2020
  • 2
AIDA64 (6.25.5490) - SHA3 1.829 MB/s
Testconfiguratie
  • CPU Test 2020
  • 2
AIDA64 (6.25.5490) - Julia 57.778
Testconfiguratie
  • CPU Test 2020
  • 2
AIDA64 (6.25.5490) - Mandel 30.621
Testconfiguratie
  • CPU Test 2020
  • 2
AIDA64 (6.25.5490) - FP32 Raytrace 11.133 KRay/s
Testconfiguratie
  • CPU Test 2020
  • 2
AIDA64 (6.25.5490) - FP64 Raytrace 6.021 KRay/s
Testconfiguratie
  • CPU Test 2020
  • 2
Systeemverbruik Cinebench 20 162 W
Testconfiguratie
  • CPU Test 2020
  • 2

Testresultaten 2020 (Win 10 1909) Geïnt. GPU of GTX 1650

Cinebench 10 (32 bit) - MultiThread 35.225
Testconfiguratie
  • CPU Test 2020
  • Geïnt. gpu (GTX 1650 bij CPU's zonder iGPU)
  • Windows 10 1909
  • High performance energie profiel (tenzij anders aangegeven)
Cinebench 20 - SingleThread 509
Testconfiguratie
  • CPU Test 2020
  • Geïnt. gpu (GTX 1650 bij CPU's zonder iGPU)
  • Windows 10 1909
  • High performance energie profiel (tenzij anders aangegeven)
Cinebench 20 - MultiThread 3.779
Testconfiguratie
  • CPU Test 2020
  • Geïnt. gpu (GTX 1650 bij CPU's zonder iGPU)
  • Windows 10 1909
  • High performance energie profiel (tenzij anders aangegeven)
Blender 2.81a - Pavillion CPU render 672 sec.
Testconfiguratie
  • CPU Test 2020
  • Geïnt. gpu (GTX 1650 bij CPU's zonder iGPU)
  • Windows 10 1909
  • High performance energie profiel (tenzij anders aangegeven)
Corona Renderer 1.3 135,6 sec.
Testconfiguratie
  • CPU Test 2020
  • Geïnt. gpu (GTX 1650 bij CPU's zonder iGPU)
  • Windows 10 1909
  • High performance energie profiel (tenzij anders aangegeven)
POV-Ray 3.7 77,97 sec.
Testconfiguratie
  • CPU Test 2020
  • Geïnt. gpu (GTX 1650 bij CPU's zonder iGPU)
  • Windows 10 1909
  • High performance energie profiel (tenzij anders aangegeven)
Adobe Lightroom 9.0 - Export 100 foto's 162 sec.
Testconfiguratie
  • CPU Test 2020
  • Geïnt. gpu (GTX 1650 bij CPU's zonder iGPU)
  • Windows 10 1909
  • High performance energie profiel (tenzij anders aangegeven)
Adobe Photoshop 21 - Panorama 133 sec.
Testconfiguratie
  • CPU Test 2020
  • Geïnt. gpu (GTX 1650 bij CPU's zonder iGPU)
  • Windows 10 1909
  • High performance energie profiel (tenzij anders aangegeven)
Adobe Photoshop 21 - Bewerkingen 161 sec.
Testconfiguratie
  • CPU Test 2020
  • Geïnt. gpu (GTX 1650 bij CPU's zonder iGPU)
  • Windows 10 1909
  • High performance energie profiel (tenzij anders aangegeven)
Adobe Premiere Pro 14 - HWI TV 4K 886 sec.
Testconfiguratie
  • CPU Test 2020
  • Geïnt. gpu (GTX 1650 bij CPU's zonder iGPU)
  • Windows 10 1909
  • High performance energie profiel (tenzij anders aangegeven)
Da Vinci Resolve - 4K Video 452 sec.
Testconfiguratie
  • CPU Test 2020
  • Geïnt. gpu (GTX 1650 bij CPU's zonder iGPU)
  • Windows 10 1909
  • High performance energie profiel (tenzij anders aangegeven)
Staxrip - x264 (r2969) 173,25 fps
Testconfiguratie
  • CPU Test 2020
  • Geïnt. gpu (GTX 1650 bij CPU's zonder iGPU)
  • Windows 10 1909
  • High performance energie profiel (tenzij anders aangegeven)
Staxrip - x265 (3.2.0.5) 52,05 fps
Testconfiguratie
  • CPU Test 2020
  • Geïnt. gpu (GTX 1650 bij CPU's zonder iGPU)
  • Windows 10 1909
  • High performance energie profiel (tenzij anders aangegeven)
Flac - 1 uur WAV naar Flac 171 sec.
Testconfiguratie
  • CPU Test 2020
  • Geïnt. gpu (GTX 1650 bij CPU's zonder iGPU)
  • Windows 10 1909
  • High performance energie profiel (tenzij anders aangegeven)
Microsoft Word 2019 - 1000 Pagina's naar PDF 61 sec.
Testconfiguratie
  • CPU Test 2020
  • Geïnt. gpu (GTX 1650 bij CPU's zonder iGPU)
  • Windows 10 1909
  • High performance energie profiel (tenzij anders aangegeven)
Microsoft Excel 2019 - Monte Carlo 2,791 sec.
Testconfiguratie
  • CPU Test 2020
  • Geïnt. gpu (GTX 1650 bij CPU's zonder iGPU)
  • Windows 10 1909
  • High performance energie profiel (tenzij anders aangegeven)
7-Zip v19.00 - 4GB inpakken 127 sec.
Testconfiguratie
  • CPU Test 2020
  • Geïnt. gpu (GTX 1650 bij CPU's zonder iGPU)
  • Windows 10 1909
  • High performance energie profiel (tenzij anders aangegeven)
Chrome 79 - Jetstream 2 142,821
Testconfiguratie
  • CPU Test 2020
  • Geïnt. gpu (GTX 1650 bij CPU's zonder iGPU)
  • Windows 10 1909
  • High performance energie profiel (tenzij anders aangegeven)
AIDA64 (6.20.5300) - Zlib 634 MB/s
Testconfiguratie
  • CPU Test 2020
  • Geïnt. gpu (GTX 1650 bij CPU's zonder iGPU)
  • Windows 10 1909
  • High performance energie profiel (tenzij anders aangegeven)
AIDA64 (6.20.5300) - AES 56.206 MB/s
Testconfiguratie
  • CPU Test 2020
  • Geïnt. gpu (GTX 1650 bij CPU's zonder iGPU)
  • Windows 10 1909
  • High performance energie profiel (tenzij anders aangegeven)
AIDA64 (6.20.5300) - SHA3 1.906 MB/s
Testconfiguratie
  • CPU Test 2020
  • Geïnt. gpu (GTX 1650 bij CPU's zonder iGPU)
  • Windows 10 1909
  • High performance energie profiel (tenzij anders aangegeven)
AIDA64 (6.20.5300) - Hash 19.290 MB/s
Testconfiguratie
  • CPU Test 2020
  • Geïnt. gpu (GTX 1650 bij CPU's zonder iGPU)
  • Windows 10 1909
  • High performance energie profiel (tenzij anders aangegeven)
AIDA64 (6.20.5300) - Julia 60.349
Testconfiguratie
  • CPU Test 2020
  • Geïnt. gpu (GTX 1650 bij CPU's zonder iGPU)
  • Windows 10 1909
  • High performance energie profiel (tenzij anders aangegeven)
AIDA64 (6.20.5300) - Mandel 32.024
Testconfiguratie
  • CPU Test 2020
  • Geïnt. gpu (GTX 1650 bij CPU's zonder iGPU)
  • Windows 10 1909
  • High performance energie profiel (tenzij anders aangegeven)
AIDA64 (6.20.5300) - FP32 Raytrace 11.889 KRay/s
Testconfiguratie
  • CPU Test 2020
  • Geïnt. gpu (GTX 1650 bij CPU's zonder iGPU)
  • Windows 10 1909
  • High performance energie profiel (tenzij anders aangegeven)
AIDA64 (6.20.5300) - FP64 Raytrace 6.663 KRay/s
Testconfiguratie
  • CPU Test 2020
  • Geïnt. gpu (GTX 1650 bij CPU's zonder iGPU)
  • Windows 10 1909
  • High performance energie profiel (tenzij anders aangegeven)
Systeemverbruik Cinebench 20 142 W
Testconfiguratie
  • CPU Test 2020
  • Geïnt. gpu (GTX 1650 bij CPU's zonder iGPU)
  • Windows 10 1909
  • High performance energie profiel (tenzij anders aangegeven)

Testresultaten 2020 (Win 10 1909) - RTX 2080 Ti

Battlefield V (DX12) - 1920x1080 - Medium 158,8 fps
Testconfiguratie
  • CPU Test 2020
  • Icm. RTX 2080 Ti
  • Windows 10 1909
  • High performance energie profiel
Battlefield V (DX12) - 1920x1080 - Ultra 142,9 fps
Testconfiguratie
  • CPU Test 2020
  • Icm. RTX 2080 Ti
  • Windows 10 1909
  • High performance energie profiel
Dirt Rally 2.0 - 1920x1080 - Medium 291,5 fps
Testconfiguratie
  • CPU Test 2020
  • Icm. RTX 2080 Ti
  • Windows 10 1909
  • High performance energie profiel
Dirt Rally 2.0 - 1920x1080 - Ultra 147,9 fps
Testconfiguratie
  • CPU Test 2020
  • Icm. RTX 2080 Ti
  • Windows 10 1909
  • High performance energie profiel
GTA V - 1920x1080 - Medium 137,5 fps
Testconfiguratie
  • CPU Test 2020
  • Icm. RTX 2080 Ti
  • Windows 10 1909
  • High performance energie profiel
GTA V - 1920x1080 - Ultra 102,8 fps
Testconfiguratie
  • CPU Test 2020
  • Icm. RTX 2080 Ti
  • Windows 10 1909
  • High performance energie profiel
The Division 2 (DX12) - 1920x1080 - Medium 183,4 fps
Testconfiguratie
  • CPU Test 2020
  • Icm. RTX 2080 Ti
  • Windows 10 1909
  • High performance energie profiel
The Division 2 (DX12) - 1920x1080 - Ultra 140,3 fps
Testconfiguratie
  • CPU Test 2020
  • Icm. RTX 2080 Ti
  • Windows 10 1909
  • High performance energie profiel
Total War: Three Kingdoms - 1920x1080 - Medium 154 fps
Testconfiguratie
  • CPU Test 2020
  • Icm. RTX 2080 Ti
  • Windows 10 1909
  • High performance energie profiel
Total War: Three Kingdoms - 1920x1080 - Ultra 101,6 fps
Testconfiguratie
  • CPU Test 2020
  • Icm. RTX 2080 Ti
  • Windows 10 1909
  • High performance energie profiel
Factorio (0.17.79) 10K SPM Base (Headless) - 10.000 ticks 106,45 UPS
Testconfiguratie
  • CPU Test 2020
  • Icm. RTX 2080 Ti
  • Windows 10 1909
  • High performance energie profiel
Streaming (x264 6Mbit + F1 2019) - gem. over 3 runs 116,8 fps
Testconfiguratie
  • CPU Test 2020
  • Icm. RTX 2080 Ti
  • Windows 10 1909
  • High performance energie profiel
Hardware Info CPU Gaming Prestatiescore 2020 151,6
Testconfiguratie
  • CPU Test 2020
  • Icm. RTX 2080 Ti
  • Windows 10 1909
  • High performance energie profiel
Shadow of the Tomb Raider - 1080p medium 134 fps
Testconfiguratie
  • CPU Test 2020
  • Icm. RTX 2080 Ti
  • Windows 10 1909
  • High performance energie profiel
Assassin's Creed Odyssey - 1080p medium 110 fps
Testconfiguratie
  • CPU Test 2020
  • Icm. RTX 2080 Ti
  • Windows 10 1909
  • High performance energie profiel

Testresultaten 2020 (Win 10 1909) - RTX 2080 Ti - Frametimes

Battlefield V (DX12) - 1920x1080 - Medium (99p) 10,99 ms
Testconfiguratie
  • CPU Test 2020
  • Icm. RTX 2080 Ti
  • Windows 10 1909
  • High performance energie profiel
Battlefield V (DX12) - 1920x1080 - Ultra (99p) 11,43 ms
Testconfiguratie
  • CPU Test 2020
  • Icm. RTX 2080 Ti
  • Windows 10 1909
  • High performance energie profiel
GTA V - 1920x1080 - Medium (99p) 12 ms
Testconfiguratie
  • CPU Test 2020
  • Icm. RTX 2080 Ti
  • Windows 10 1909
  • High performance energie profiel
GTA V - 1920x1080 - Ultra (99p) 14 ms
Testconfiguratie
  • CPU Test 2020
  • Icm. RTX 2080 Ti
  • Windows 10 1909
  • High performance energie profiel
The Division 2 (DX12) - 1920x1080 - Medium (99p) 8,31 ms
Testconfiguratie
  • CPU Test 2020
  • Icm. RTX 2080 Ti
  • Windows 10 1909
  • High performance energie profiel
The Division 2 (DX12) - 1920x1080 - Ultra (99p) 10,36 ms
Testconfiguratie
  • CPU Test 2020
  • Icm. RTX 2080 Ti
  • Windows 10 1909
  • High performance energie profiel
Total War: Three Kingdoms - 1920x1080 - Medium (99p) 9,3 ms
Testconfiguratie
  • CPU Test 2020
  • Icm. RTX 2080 Ti
  • Windows 10 1909
  • High performance energie profiel
Total War: Three Kingdoms - 1920x1080 - Ultra (99p) 15,2 ms
Testconfiguratie
  • CPU Test 2020
  • Icm. RTX 2080 Ti
  • Windows 10 1909
  • High performance energie profiel

Stroomverbruik 2020 (Enkel CPU)

Stroomverbruik idle - Minimaal 5,25 W
Testconfiguratie
  • Stroomverbruik processors (enkel CPU) (2020)
Stroomverbruik idle - Gemiddelde 5 min. 5,64 W
Testconfiguratie
  • Stroomverbruik processors (enkel CPU) (2020)
Stroomverbruik - Cinebench 20 - Gemiddeld 80,7 W
Testconfiguratie
  • Stroomverbruik processors (enkel CPU) (2020)
Stroomverbruik - Cinebench 20 - Totaal (Wh) 1,86 Wh
Testconfiguratie
  • Stroomverbruik processors (enkel CPU) (2020)
Stroomverbruik - Cinebench 20 - Maximaal 83,23 W
Testconfiguratie
  • Stroomverbruik processors (enkel CPU) (2020)
Adobe Premiere Pro 14 - Verbruik - Gemiddeld 68,7 W
Testconfiguratie
  • Stroomverbruik processors (enkel CPU) (2020)
Adobe Premiere Pro 14 - Verbruik - Totaal (Wh) 17,72 Wh
Testconfiguratie
  • Stroomverbruik processors (enkel CPU) (2020)

Temperatuur resultaten (Dark Rock Pro 4 @ 12V)

Max. temperatuur (15 min. Cinebench 20) 68,7 °C
Testconfiguratie
  • Temperatuur test 2020
Gem. kloksnelheid (15 min. Cinebench 20) 4.056 MHz
Testconfiguratie
  • Temperatuur test 2020
Max. package power (HWinfo) 94 W
Testconfiguratie
  • Temperatuur test 2020

Testresultaten 2018 (Windows 10) - Geïnt. GPU of GTX 1050 Ti

Cinebench 10 (Multi-CPU, 32-bit) 35.162
Testconfiguratie
  • CPU Test 2018
  • Geïnt. videokaart (GTX 1050 Ti bij CPU's zonder iGPU)
  • Windows 10
  • High performance energie profiel (tenzij anders aangegeven)
Cinebench 15 Single Threaded 203
Testconfiguratie
  • CPU Test 2018
  • Geïnt. videokaart (GTX 1050 Ti bij CPU's zonder iGPU)
  • Windows 10
  • High performance energie profiel (tenzij anders aangegeven)
Cinebench 15 Multi Threaded 1.641
Testconfiguratie
  • CPU Test 2018
  • Geïnt. videokaart (GTX 1050 Ti bij CPU's zonder iGPU)
  • Windows 10
  • High performance energie profiel (tenzij anders aangegeven)
Cinebench 20 Single Threaded 504
Testconfiguratie
  • CPU Test 2018
  • Geïnt. videokaart (GTX 1050 Ti bij CPU's zonder iGPU)
  • Windows 10
  • High performance energie profiel (tenzij anders aangegeven)
Cinebench 20 Multi Threaded 3.772
Testconfiguratie
  • CPU Test 2018
  • Geïnt. videokaart (GTX 1050 Ti bij CPU's zonder iGPU)
  • Windows 10
  • High performance energie profiel (tenzij anders aangegeven)
Blender 2.79b 75 sec.
Testconfiguratie
  • CPU Test 2018
  • Geïnt. videokaart (GTX 1050 Ti bij CPU's zonder iGPU)
  • Windows 10
  • High performance energie profiel (tenzij anders aangegeven)
Geekbench 4.2.3 - CPU Single-Core 5.688
Testconfiguratie
  • CPU Test 2018
  • Geïnt. videokaart (GTX 1050 Ti bij CPU's zonder iGPU)
  • Windows 10
  • High performance energie profiel (tenzij anders aangegeven)
Geekbench 4.2.3 - CPU Multi-Core 28.847
Testconfiguratie
  • CPU Test 2018
  • Geïnt. videokaart (GTX 1050 Ti bij CPU's zonder iGPU)
  • Windows 10
  • High performance energie profiel (tenzij anders aangegeven)
Geekbench 4.2.3 - CPU Single-Core - Crypto 7.057
Testconfiguratie
  • CPU Test 2018
  • Geïnt. videokaart (GTX 1050 Ti bij CPU's zonder iGPU)
  • Windows 10
  • High performance energie profiel (tenzij anders aangegeven)
Geekbench 4.2.3 - CPU Single-Core - Integer 5.276
Testconfiguratie
  • CPU Test 2018
  • Geïnt. videokaart (GTX 1050 Ti bij CPU's zonder iGPU)
  • Windows 10
  • High performance energie profiel (tenzij anders aangegeven)
Geekbench 4.2.3 - CPU Single-Core - Floating Point 5.529
Testconfiguratie
  • CPU Test 2018
  • Geïnt. videokaart (GTX 1050 Ti bij CPU's zonder iGPU)
  • Windows 10
  • High performance energie profiel (tenzij anders aangegeven)
Adobe Lightroom CC - Export 40 sec.
Testconfiguratie
  • CPU Test 2018
  • Geïnt. videokaart (GTX 1050 Ti bij CPU's zonder iGPU)
  • Windows 10
  • High performance energie profiel (tenzij anders aangegeven)
Adobe Photoshop CC - Panorama 34 sec.
Testconfiguratie
  • CPU Test 2018
  • Geïnt. videokaart (GTX 1050 Ti bij CPU's zonder iGPU)
  • Windows 10
  • High performance energie profiel (tenzij anders aangegeven)
Adobe Photoshop CC - Fotobewerking 73 sec.
Testconfiguratie
  • CPU Test 2018
  • Geïnt. videokaart (GTX 1050 Ti bij CPU's zonder iGPU)
  • Windows 10
  • High performance energie profiel (tenzij anders aangegeven)
Adobe Premiere Pro CC - 4K HWI TV 817 sec.
Testconfiguratie
  • CPU Test 2018
  • Geïnt. videokaart (GTX 1050 Ti bij CPU's zonder iGPU)
  • Windows 10
  • High performance energie profiel (tenzij anders aangegeven)
Staxrip - x264 (r2901) 126,67 fps
Testconfiguratie
  • CPU Test 2018
  • Geïnt. videokaart (GTX 1050 Ti bij CPU's zonder iGPU)
  • Windows 10
  • High performance energie profiel (tenzij anders aangegeven)
Staxrip - x265 (2.8.24) 48,51 fps
Testconfiguratie
  • CPU Test 2018
  • Geïnt. videokaart (GTX 1050 Ti bij CPU's zonder iGPU)
  • Windows 10
  • High performance energie profiel (tenzij anders aangegeven)
Flac - 1 uur WAV naar Flac 173 sec.
Testconfiguratie
  • CPU Test 2018
  • Geïnt. videokaart (GTX 1050 Ti bij CPU's zonder iGPU)
  • Windows 10
  • High performance energie profiel (tenzij anders aangegeven)
Microsoft Word 2016 - 1000 pagina's naar PDF 61 sec.
Testconfiguratie
  • CPU Test 2018
  • Geïnt. videokaart (GTX 1050 Ti bij CPU's zonder iGPU)
  • Windows 10
  • High performance energie profiel (tenzij anders aangegeven)
Microsoft Excel 2016 - Monte Carlo 7,437 sec.
Testconfiguratie
  • CPU Test 2018
  • Geïnt. videokaart (GTX 1050 Ti bij CPU's zonder iGPU)
  • Windows 10
  • High performance energie profiel (tenzij anders aangegeven)
Winrar 5.60 - 4GB inpakken 223 sec.
Testconfiguratie
  • CPU Test 2018
  • Geïnt. videokaart (GTX 1050 Ti bij CPU's zonder iGPU)
  • Windows 10
  • High performance energie profiel (tenzij anders aangegeven)
7-Zip v18.05 - 4GB inpakken 130 sec.
Testconfiguratie
  • CPU Test 2018
  • Geïnt. videokaart (GTX 1050 Ti bij CPU's zonder iGPU)
  • Windows 10
  • High performance energie profiel (tenzij anders aangegeven)
Chrome 75 - Jetstream 2 145,537
Testconfiguratie
  • CPU Test 2018
  • Geïnt. videokaart (GTX 1050 Ti bij CPU's zonder iGPU)
  • Windows 10
  • High performance energie profiel (tenzij anders aangegeven)
AIDA64 (6.00) - Zlib 634,3 MB/s
Testconfiguratie
  • CPU Test 2018
  • Geïnt. videokaart (GTX 1050 Ti bij CPU's zonder iGPU)
  • Windows 10
  • High performance energie profiel (tenzij anders aangegeven)
AIDA64 (6.00) - AES 56.017 MB/s
Testconfiguratie
  • CPU Test 2018
  • Geïnt. videokaart (GTX 1050 Ti bij CPU's zonder iGPU)
  • Windows 10
  • High performance energie profiel (tenzij anders aangegeven)
AIDA64 (6.00) - SHA3 1.852 MB/s
Testconfiguratie
  • CPU Test 2018
  • Geïnt. videokaart (GTX 1050 Ti bij CPU's zonder iGPU)
  • Windows 10
  • High performance energie profiel (tenzij anders aangegeven)
AIDA64 (6.00) - Julia 60.149
Testconfiguratie
  • CPU Test 2018
  • Geïnt. videokaart (GTX 1050 Ti bij CPU's zonder iGPU)
  • Windows 10
  • High performance energie profiel (tenzij anders aangegeven)
AIDA64 (6.00) - Mandel 31.866
Testconfiguratie
  • CPU Test 2018
  • Geïnt. videokaart (GTX 1050 Ti bij CPU's zonder iGPU)
  • Windows 10
  • High performance energie profiel (tenzij anders aangegeven)
Systeemverbruik - Cinebench 15 - Max 132 W
Testconfiguratie
  • CPU Test 2018
  • Geïnt. videokaart (GTX 1050 Ti bij CPU's zonder iGPU)
  • Windows 10
  • High performance energie profiel (tenzij anders aangegeven)

Testresultaten 2018 (Windows 10) - GTX 1080 Ti

Far Cry 5 – 1920x1080 – Medium 131 fps
Testconfiguratie
  • CPU Test 2018
  • Icm. GeForce GTX 1080 Ti
  • Windows 10
  • High performance energie profiel
Far Cry 5 – 1920x1080 – Ultra 119 fps
Testconfiguratie
  • CPU Test 2018
  • Icm. GeForce GTX 1080 Ti
  • Windows 10
  • High performance energie profiel
Assassin’s Creed: Origins – 1920x1080 – Medium 112 fps
Testconfiguratie
  • CPU Test 2018
  • Icm. GeForce GTX 1080 Ti
  • Windows 10
  • High performance energie profiel
Assassin’s Creed: Origins – 1920x1080 – Ultra 91 fps
Testconfiguratie
  • CPU Test 2018
  • Icm. GeForce GTX 1080 Ti
  • Windows 10
  • High performance energie profiel
The Witcher 3: Blood & Wine - 1920x1080 - Medium 217,7 fps
Testconfiguratie
  • CPU Test 2018
  • Icm. GeForce GTX 1080 Ti
  • Windows 10
  • High performance energie profiel
The Witcher 3: Blood & Wine - 1920x1080 - Ultra 115,7 fps
Testconfiguratie
  • CPU Test 2018
  • Icm. GeForce GTX 1080 Ti
  • Windows 10
  • High performance energie profiel
GTA V - 1920x1080 – Medium 134,6 fps
Testconfiguratie
  • CPU Test 2018
  • Icm. GeForce GTX 1080 Ti
  • Windows 10
  • High performance energie profiel
GTA V - 1920x1080 - Ultra (2x MSAA, 2x Refl. MSAA) 101,9 fps
Testconfiguratie
  • CPU Test 2018
  • Icm. GeForce GTX 1080 Ti
  • Windows 10
  • High performance energie profiel
Battlefield 1 (DX11) - 1920x1080 – Medium 192,3 fps
Testconfiguratie
  • CPU Test 2018
  • Icm. GeForce GTX 1080 Ti
  • Windows 10
  • High performance energie profiel
Battlefield 1 (DX11) - 1920x1080 – Ultra 166,9 fps
Testconfiguratie
  • CPU Test 2018
  • Icm. GeForce GTX 1080 Ti
  • Windows 10
  • High performance energie profiel
Rise of the Tombraider (DX12) - 1920x1080 - Medium 191,3 fps
Testconfiguratie
  • CPU Test 2018
  • Icm. GeForce GTX 1080 Ti
  • Windows 10
  • High performance energie profiel
Rise of the Tombraider (DX12) - 1920x1080 - Ultra 121,7 fps
Testconfiguratie
  • CPU Test 2018
  • Icm. GeForce GTX 1080 Ti
  • Windows 10
  • High performance energie profiel
The Division (DX12) - 1920x1080 - Medium 203,4 fps
Testconfiguratie
  • CPU Test 2018
  • Icm. GeForce GTX 1080 Ti
  • Windows 10
  • High performance energie profiel
The Division (DX12) - 1920x1080 - Ultra 131,3 fps
Testconfiguratie
  • CPU Test 2018
  • Icm. GeForce GTX 1080 Ti
  • Windows 10
  • High performance energie profiel

Testresultaten 2018 (Windows 10) - GTX 1080 Ti - Frametimes

The Witcher 3: Blood & Wine - 1920x1080 - Medium (99p) 8,1 ms
Testconfiguratie
  • CPU Test 2018
  • Icm. GeForce GTX 1080 Ti
  • Windows 10
  • High performance energie profiel
The Witcher 3: Blood & Wine - 1920x1080 - Ultra (99p) 12,8 ms
Testconfiguratie
  • CPU Test 2018
  • Icm. GeForce GTX 1080 Ti
  • Windows 10
  • High performance energie profiel
GTA V - 1920x1080 - Medium (99p) 13 ms
Testconfiguratie
  • CPU Test 2018
  • Icm. GeForce GTX 1080 Ti
  • Windows 10
  • High performance energie profiel
GTA V - 1920x1080 - Ultra (2x MSAA, 2xRefl. MSAA) (99p) 14 ms
Testconfiguratie
  • CPU Test 2018
  • Icm. GeForce GTX 1080 Ti
  • Windows 10
  • High performance energie profiel
Battlefield 1 (DX11) - 1920x1080 - Medium (99p) 8,5 ms
Testconfiguratie
  • CPU Test 2018
  • Icm. GeForce GTX 1080 Ti
  • Windows 10
  • High performance energie profiel
Battlefield 1 (DX11) - 1920x1080 - Ultra (99p) 9,9 ms
Testconfiguratie
  • CPU Test 2018
  • Icm. GeForce GTX 1080 Ti
  • Windows 10
  • High performance energie profiel
Rise of the Tombraider (DX12) - 1920x1080 - Medium (99p) 8,5 ms
Testconfiguratie
  • CPU Test 2018
  • Icm. GeForce GTX 1080 Ti
  • Windows 10
  • High performance energie profiel
Rise of the Tombraider (DX12) - 1920x1080 - Ultra (99p) 11,5 ms
Testconfiguratie
  • CPU Test 2018
  • Icm. GeForce GTX 1080 Ti
  • Windows 10
  • High performance energie profiel

Stroomverbruik 2019 (Enkel CPU)

Stroomverbruik idle - Minimaal 6,23 W
Testconfiguratie
  • Stroomverbruik processors (enkel CPU) (2019)
Stroomverbruik idle - Gemiddelde 5 min. 8,04 W
Testconfiguratie
  • Stroomverbruik processors (enkel CPU) (2019)
Stroomverbruik - Cinebench 15 - Gemiddeld 74,8 W
Testconfiguratie
  • Stroomverbruik processors (enkel CPU) (2019)
Stroomverbruik - Cinebench 15 - Maximaal 80,09 W
Testconfiguratie
  • Stroomverbruik processors (enkel CPU) (2019)
Adobe Premiere Pro - Verbruik - Gemiddeld 62,4 W
Testconfiguratie
  • Stroomverbruik processors (enkel CPU) (2019)
Adobe Premiere Pro - Verbruik - Totaal (Wh) 14,24 Wh
Testconfiguratie
  • Stroomverbruik processors (enkel CPU) (2019)

Reviews

Processors

AMD Ryzen 5 3600 en 3600X: De beste processors voor gamers!

Nadat we een paar weken geleden aandacht besteden aan de nieuwe Ryzen 7 en Ryzen 9 processors is het nu tijd voor de betaalbare Ryzen 5 3600 en 3600X. Deze chips maken gebruik van dezelfde nieuwe technologie als hun duurdere boertjes uit de zeven en negen series, maar moeten het stellen met wat minder cores en zijn daarom prettiger geprijsd. Wij zochten uit wat deze concurrenten voor de Intel Core i5 processors in hun mars hebben. Lees ook onze uitgebreide geschreven review.

29 juli 2019 06:00
Processors

AMD Ryzen 5 3600 & 3600X review: bom onder de Core i5's!

Inmiddels hebben we ook de AMD Ryzen 5 3600 en Ryzen 5 3600X kunnen testen; in deze review vind je alle benchmarks en lees je of de Ryzen 5 3600 net zo'n aantrekkelijke processor is als de specificaties doen vermoeden.

17 juli 2019 05:59
Processors

AMD Ryzen 3rd gen, Zen 2 en Radeon RX5700 Navi preview

AMD greep de E3 gamebeurs deze week aan om meer te vertellen over de derde generatie Ryzen processors die gebaseerd zijn op de Zen 2 architectuur én om het doek te lichten van de nieuwe Radeon RX 5700 (XT) 'Navi' GPU's. In deze video vertellen we je alles wat je over deze nieuwe chips van AMD moet weten. Lees ook onze Ryzen Zen 2 preview. Lees ook onze Radeon RX 5700 Navi preview.

14 juni 2019 07:01
0