
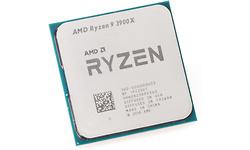
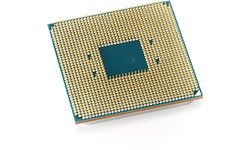
AMD Ryzen 9 3900X Boxed
- Bekijk 6 reviews
- Alle processors
-
Uitvoeringen


Dit product is niet (meer) verkrijgbaar bij de bij Hardware Info aangesloten shops.
| CPU-socket | Socket AM4 |
| Klokfrequentie | 3,8 GHz |
| Aantal cores totaal | 12 cores |
| Thermal design power | 105 W |
| Geïntegreerde GPU |
| Processorserie | Ryzen 9 |
| CPU-core | Matisse |
| CPU-socket | Socket AM4 |
| Klokfrequentie | 3,8 GHz |
| Max. turbo klokfrequentie | 4,6 GHz |
| Aantal cores totaal | 12 cores |
| Aantal threads | 24 |
| HyperThreading / SMT | |
| Multiplier | 38 x |
| Multiplier unlocked | |
| Bussnelheid / bClk | 100 MHz |
| Geïntegreerde geheugencontroller | DDR4-3200 (Dual Channel) |
| Thermal design power | 105 W |
| Productie-procedé | 7 nm |
| Aantal PCIe lanes | 24 |
| Uitvoering | Boxed |
| Koeler meegeleverd |
| Geïntegreerde geheugencontroller | |
| Geheugentype | DDR4 |
| Geheugensnelheid | 3.200 MHz |
| Geheugenkanalen | 2 |
| Geïntegreerde GPU |
| L2-cache | 6.144 kB |
| L3-cache | 64 MB |
| IA-64 | |
| MMX | |
| SSE | |
| SSE2 | |
| SSE3 | |
| SSE4A | |
| SSE4.1 | |
| SSE4.2 | |
| x86-64 | |
| XD-bit | |
| AVX | |
| AVX2 | |
| AVX-512 | |
| AES-NI |
| SKU | 100-100000023BOX, RYZEN 9 3900X | |
| EAN | 0730143309950 | |
| Toegevoegd aan Hardware Info | maandag 27 mei 2019 |
| Red Dead 2 - 1920x1080 - Medium - Vulkan | 140 |
Testconfiguratie
|
|
| Red Dead 2 - 1920x1080 - Medium - Vulkan (99p) | 9,29 |
Testconfiguratie
|
|
| Red Dead 2 - 1920x1080 - Medium - Vulkan (99.9p) | 10,25 |
Testconfiguratie
|
|
| Red Dead 2 - 1920x1080 - Ultra - Vulkan | 133,7 |
Testconfiguratie
|
|
| Red Dead 2 - 1920x1080 - Ultra - Vulkan (99p) | 9,32 |
Testconfiguratie
|
|
| Red Dead 2 - 1920x1080 - Ultra - Vulkan (99.9p) | 10,28 |
Testconfiguratie
|
|
| Red Dead 2 - 3840x2160 - Medium - Vulkan | 135,6 |
Testconfiguratie
|
|
| Red Dead 2 - 3840x2160 - Medium - Vulkan (99p) | 9,3 |
Testconfiguratie
|
|
| Red Dead 2 - 3840x2160 - Medium - Vulkan (99.9p) | 10,38 |
Testconfiguratie
|
|
| Red Dead 2 - 3840x2160 - Ultra - Vulkan | 112,4 |
Testconfiguratie
|
|
| Red Dead 2 - 3840x2160 - Ultra - Vulkan (99p) | 11,14 |
Testconfiguratie
|
|
| Red Dead 2 - 3840x2160 - Ultra - Vulkan (99.9p) | 11,42 |
Testconfiguratie
|
|
| Metro Exodus - 1920x1080 - Medium | 173,5 |
Testconfiguratie
|
|
| Metro Exodus - 1920x1080 - Medium (99p) | 11,26 |
Testconfiguratie
|
|
| Metro Exodus - 1920x1080 - Medium (99.9p) | 12,1 |
Testconfiguratie
|
|
| Metro Exodus - 1920x1080 - Ultra | 129,9 |
Testconfiguratie
|
|
| Metro Exodus - 1920x1080 - Ultra (99p) | 13,23 |
Testconfiguratie
|
|
| Metro Exodus - 1920x1080 - Ultra (99.9p) | 14,12 |
Testconfiguratie
|
|
| Metro Exodus - 3840x2160 - Medium | 164,1 |
Testconfiguratie
|
|
| Metro Exodus - 3840x2160 - Medium (99p) | 11,51 |
Testconfiguratie
|
|
| Metro Exodus - 3840x2160 - Medium (99.9p) | 12,29 |
Testconfiguratie
|
|
| Metro Exodus - 3840x2160 - Ultra | 111,6 |
Testconfiguratie
|
|
| Metro Exodus - 3840x2160 - Ultra (99p) | 14,77 |
Testconfiguratie
|
|
| Metro Exodus - 3840x2160 - Ultra (99.9p) | 15,38 |
Testconfiguratie
|
|
| F1 2021 - 1920x1080 - Medium | 263,1 |
Testconfiguratie
|
|
| F1 2021 - 1920x1080 - Medium (99p) | 5,4 |
Testconfiguratie
|
|
| F1 2021 - 1920x1080 - Medium (99.9p) | 6,6 |
Testconfiguratie
|
|
| F1 2021 - 1920x1080 - Ultra | 193,9 |
Testconfiguratie
|
|
| F1 2021 - 1920x1080 - Ultra (99p) | 6,7 |
Testconfiguratie
|
|
| F1 2021 - 1920x1080 - Ultra (99.9p) | 7,8 |
Testconfiguratie
|
|
| Streaming (x264 6Mbit + F1 2021 1080p ultra 60fps) - gemid. | 114,05 |
Testconfiguratie
|
|
| Far Cry 6 - 1920x1080 - Medium | 119,2 |
Testconfiguratie
|
|
| Far Cry 6 - 1920x1080 - Medium (99p) | 13,13 |
Testconfiguratie
|
|
| Far Cry 6 - 1920x1080 - Medium (99.9p) | 22,31 |
Testconfiguratie
|
|
| Far Cry 6 - 1920x1080 - Ultra | 101,4 |
Testconfiguratie
|
|
| Far Cry 6 - 1920x1080 - Ultra (99p) | 14,42 |
Testconfiguratie
|
|
| Far Cry 6 - 1920x1080 - Ultra (99.9p) | 22,67 |
Testconfiguratie
|
De keuze voor de beste processor is misschien wel de belangrijkste van je hele pc. In deze koopgids zet Hardware Info de beste CPU's op een rij, zodat je snel de juiste processor voor jouw gebruiksdoel vindt.
10 augustus 2020 05:59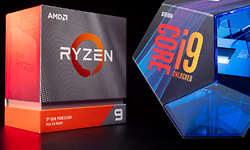
De keuze voor de beste processor is misschien wel de belangrijkste van je hele pc. In deze koopgids zet Hardware Info de beste CPU's op een rij, zodat je snel de juiste processor voor jouw gebruiksdoel vindt.
24 december 2019 05:59
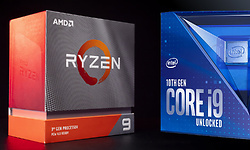
AMD introduceert de derde generatie Ryzen processors en heeft daarmee als doel om Intel op alle punten voorbij te steken. Wij gingen aan de slag met de Ryzen 7 3700X en de Ryzen 9 3900X en zochten uit of het AMD nu eindelijk lukt om Intel van de troon te stoten. Lees ook onze geschreven review.
8 juli 2019 15:00
De derde generatie Ryzen is scheepsrecht: eindelijk biedt AMD op alle vlakken een volwaardig alternatief voor Intel. Check alle informatie en natuurlijk de benchmarks in deze review!
7 juli 2019 15:00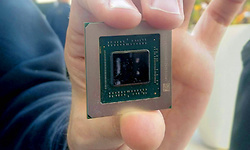
AMD greep de E3 gamebeurs deze week aan om meer te vertellen over de derde generatie Ryzen processors die gebaseerd zijn op de Zen 2 architectuur én om het doek te lichten van de nieuwe Radeon RX 5700 (XT) 'Navi' GPU's. In deze video vertellen we je alles wat je over deze nieuwe chips van AMD moet weten. Lees ook onze Ryzen Zen 2 preview. Lees ook onze Radeon RX 5700 Navi preview.
14 juni 2019 07:01
Pakt AMD, net als aan het begin van deze eeuw, met zijn nieuwe processors de winst in de desktopmarkt? In dit diepgravende artikel blikken we vooruit en lees je alles over de technologie van de komende AMD Ryzen 3000 cpu’s.
11 juni 2019 01:18
Als je in 2014 voorspelde dat AMD vijf jaar later de snelste desktopprocessor zou verkopen, dan werd je waarschijnlijk smakelijk uitgelachen. In dit artikel blikken we terug op de afgelopen vijf jaar in de ontwikkeling van processor.
13 oktober 2019 05:59
