Prijsverloop

Specificaties

Belangrijkste specificaties

CPU-socket Socket 1200
Klokfrequentie 3,6 GHz
Aantal cores totaal 4 cores
Thermal design power 65 W
Geïntegreerde GPU

Processor

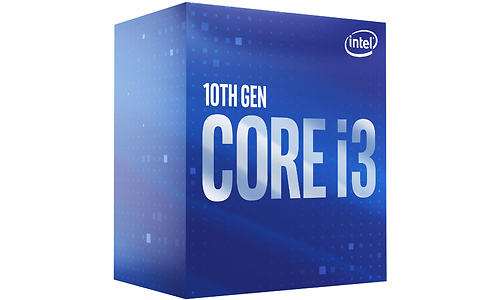
Processorserie Core i3
CPU-core Comet Lake
CPU-socket Socket 1200
Klokfrequentie 3,6 GHz
Alle cores turbo klokfrequentie 4,1 GHz
Max. turbo klokfrequentie 4,3 GHz
Aantal cores totaal 4 cores
Aantal threads 8
HyperThreading / SMT
Multiplier unlocked
Bussnelheid / bClk 100 MHz
Thermal design power 65 W
Productie-procedé 14 nm
Aantal PCIe lanes 16
Uitvoering Boxed
Koeler meegeleverd

Geheugencontroller

Geïntegreerde geheugencontroller
Geheugentype DDR4
Geheugensnelheid 2.666 MHz
Geheugenkanalen 2

Video

Geïntegreerde GPU
GPU type Intel UHD Graphics 630
GPU klokfrequentie 1.100 MHz
Aantal rekenkernen 192
DirectX versie DirectX 12
Intel Quick Sync

Cache

L2-cache 1.024 kB
L3-cache 6 MB

Instructieset

IA-64
MMX
SSE
SSE2
SSE3
SSE4A
SSE4.1
SSE4.2
x86-64
XD-bit
AVX
AVX2
AVX-512
AES-NI

Virtualisatie type

Intel VT-d
Intel VT-x

Productcodes

SKU BX8070110100
EAN 5032037186957, 0735858445825, 0735858445832
Toegevoegd aan Hardware Info donderdag 20 februari 2020

Testresultaten

Dit product is door Hardware Info getest op woensdag 12 augustus 2020.

Benchmarks 2020 (5950X @ 4.65GHz)

Total War: Warhammer III 1920x1080 Medium 136 fps
Testconfiguratie
  • Ryzen 9 5950X @ 4.65GHz, 32GB DDR4
  • 3600C16, MSI X570 Godlike, Samsung 970 Evo 1TB+Kioxia Exceria Plus 2TB, Windows 10 Pro x64
Total War: Warhammer III 1920x1080 Medium (99p) 13 ms
Testconfiguratie
  • Ryzen 9 5950X @ 4.65GHz, 32GB DDR4
  • 3600C16, MSI X570 Godlike, Samsung 970 Evo 1TB+Kioxia Exceria Plus 2TB, Windows 10 Pro x64
Total War: Warhammer III 1920x1080 Medium (99.9p) 14,75 ms
Testconfiguratie
  • Ryzen 9 5950X @ 4.65GHz, 32GB DDR4
  • 3600C16, MSI X570 Godlike, Samsung 970 Evo 1TB+Kioxia Exceria Plus 2TB, Windows 10 Pro x64
Total War: Warhammer III 1920x1080 Ultra 79,3 fps
Testconfiguratie
  • Ryzen 9 5950X @ 4.65GHz, 32GB DDR4
  • 3600C16, MSI X570 Godlike, Samsung 970 Evo 1TB+Kioxia Exceria Plus 2TB, Windows 10 Pro x64
Total War: Warhammer III 1920x1080 Ultra (99p) 22,12 ms
Testconfiguratie
  • Ryzen 9 5950X @ 4.65GHz, 32GB DDR4
  • 3600C16, MSI X570 Godlike, Samsung 970 Evo 1TB+Kioxia Exceria Plus 2TB, Windows 10 Pro x64
Total War: Warhammer III 1920x1080 Ultra (99.9p) 24,91 ms
Testconfiguratie
  • Ryzen 9 5950X @ 4.65GHz, 32GB DDR4
  • 3600C16, MSI X570 Godlike, Samsung 970 Evo 1TB+Kioxia Exceria Plus 2TB, Windows 10 Pro x64

Testresultaten RX 6900 XT

Red Dead 2 - 1920x1080 - Medium - Vulkan 87,7
Testconfiguratie
  • CPU Test 2021
  • 1
Red Dead 2 - 1920x1080 - Medium - Vulkan (99p) 17,22
Testconfiguratie
  • CPU Test 2021
  • 1
Red Dead 2 - 1920x1080 - Medium - Vulkan (99.9p) 21,24
Testconfiguratie
  • CPU Test 2021
  • 1
Red Dead 2 - 1920x1080 - Ultra - Vulkan 89,3
Testconfiguratie
  • CPU Test 2021
  • 1
Red Dead 2 - 1920x1080 - Ultra - Vulkan (99p) 16,68
Testconfiguratie
  • CPU Test 2021
  • 1
Red Dead 2 - 1920x1080 - Ultra - Vulkan (99.9p) 18,68
Testconfiguratie
  • CPU Test 2021
  • 1
Red Dead 2 - 3840x2160 - Medium - Vulkan 87,4
Testconfiguratie
  • CPU Test 2021
  • 1
Red Dead 2 - 3840x2160 - Medium - Vulkan (99p) 16,82
Testconfiguratie
  • CPU Test 2021
  • 1
Red Dead 2 - 3840x2160 - Medium - Vulkan (99.9p) 18,84
Testconfiguratie
  • CPU Test 2021
  • 1
Red Dead 2 - 3840x2160 - Ultra - Vulkan 80,8
Testconfiguratie
  • CPU Test 2021
  • 1
Red Dead 2 - 3840x2160 - Ultra - Vulkan (99p) 13,77
Testconfiguratie
  • CPU Test 2021
  • 1
Red Dead 2 - 3840x2160 - Ultra - Vulkan (99.9p) 13,77
Testconfiguratie
  • CPU Test 2021
  • 1
Metro Exodus - 1920x1080 - Medium 136,3
Testconfiguratie
  • CPU Test 2021
  • 1
Metro Exodus - 1920x1080 - Medium (99p) 13,98
Testconfiguratie
  • CPU Test 2021
  • 1
Metro Exodus - 1920x1080 - Medium (99.9p) 15,18
Testconfiguratie
  • CPU Test 2021
  • 1
Metro Exodus - 1920x1080 - Ultra 97,7
Testconfiguratie
  • CPU Test 2021
  • 1
Metro Exodus - 1920x1080 - Ultra (99p) 18,58
Testconfiguratie
  • CPU Test 2021
  • 1
Metro Exodus - 1920x1080 - Ultra (99.9p) 21,09
Testconfiguratie
  • CPU Test 2021
  • 1
Metro Exodus - 3840x2160 - Medium 132,4
Testconfiguratie
  • CPU Test 2021
  • 1
Metro Exodus - 3840x2160 - Medium (99p) 14,21
Testconfiguratie
  • CPU Test 2021
  • 1
Metro Exodus - 3840x2160 - Medium (99.9p) 15,39
Testconfiguratie
  • CPU Test 2021
  • 1
Metro Exodus - 3840x2160 - Ultra 94
Testconfiguratie
  • CPU Test 2021
  • 1
Metro Exodus - 3840x2160 - Ultra (99p) 18,9
Testconfiguratie
  • CPU Test 2021
  • 1
Metro Exodus - 3840x2160 - Ultra (99.9p) 20,86
Testconfiguratie
  • CPU Test 2021
  • 1
F1 2021 - 1920x1080 - Medium 193,9
Testconfiguratie
  • CPU Test 2021
  • 1
F1 2021 - 1920x1080 - Medium (99p) 7,3
Testconfiguratie
  • CPU Test 2021
  • 1
F1 2021 - 1920x1080 - Medium (99.9p) 8,5
Testconfiguratie
  • CPU Test 2021
  • 1
F1 2021 - 1920x1080 - Ultra 142,9
Testconfiguratie
  • CPU Test 2021
  • 1
F1 2021 - 1920x1080 - Ultra (99p) 9,4
Testconfiguratie
  • CPU Test 2021
  • 1
F1 2021 - 1920x1080 - Ultra (99.9p) 12,1
Testconfiguratie
  • CPU Test 2021
  • 1
Streaming (x264 6Mbit + F1 2021 1080p ultra 60fps) - gemid. 20,64
Testconfiguratie
  • CPU Test 2021
  • 1
Far Cry 6 - 1920x1080 - Medium 89,2
Testconfiguratie
  • CPU Test 2022
Far Cry 6 - 1920x1080 - Medium (99p) 18,32
Testconfiguratie
  • CPU Test 2022
Far Cry 6 - 1920x1080 - Medium (99.9p) 26,02
Testconfiguratie
  • CPU Test 2022
Far Cry 6 - 1920x1080 - Ultra 74,8
Testconfiguratie
  • CPU Test 2022
Far Cry 6 - 1920x1080 - Ultra (99p) 20,24
Testconfiguratie
  • CPU Test 2022
Far Cry 6 - 1920x1080 - Ultra (99.9p) 27,81
Testconfiguratie
  • CPU Test 2022

Testresultaten IGP-Games

3DMark NightRaid 5.905
Testconfiguratie
  • CPU Test 2021
  • 1
3DMark NightRaid - Graphics 5.630
Testconfiguratie
  • CPU Test 2021
  • 1
F1 2021 1280x720 - Low 18,9 fps
Testconfiguratie
  • CPU Test 2021
  • 1
F1 2021 1280x720 - Low (99p) 63 ms
Testconfiguratie
  • CPU Test 2021
  • 1
F1 2021 1280x720 - Low (99.9p) 65,1 ms
Testconfiguratie
  • CPU Test 2021
  • 1
F1 2021 1280x720 - Medium 14,5 fps
Testconfiguratie
  • CPU Test 2021
  • 1
F1 2021 1280x720 - Medium (99p) 78,4 ms
Testconfiguratie
  • CPU Test 2021
  • 1
F1 2021 1280x720 - Medium (99.9p) 80,2 ms
Testconfiguratie
  • CPU Test 2021
  • 1
Total War: Warhammer III 1280x720 - Low 18,8 fps
Testconfiguratie
  • CPU Test 2022
Total War: Warhammer III 1280x720 - Low (99p) 61,91 ms
Testconfiguratie
  • CPU Test 2022
Total War: Warhammer III 1280x720 - Low (99.9p) 64,94 ms
Testconfiguratie
  • CPU Test 2022
Total War: Warhammer III 1920x1080 - Low 9,9 fps
Testconfiguratie
  • CPU Test 2022
Total War: Warhammer III 1920x1080 - Low (99p) 117,5 ms
Testconfiguratie
  • CPU Test 2022
Total War: Warhammer III 1920x1080 - Low (99.9p) 120,03 ms
Testconfiguratie
  • CPU Test 2022

Testresultaten (Met geïnt. GPU of GTX 1650)

Cinebench R23 - Single 1.125,13
Testconfiguratie
  • CPU Test 2021
  • 1
Cinebench R23 - Multi 4.472,99
Testconfiguratie
  • CPU Test 2021
  • 1
Corona Render 266 sec.
Testconfiguratie
  • CPU Test 2021
  • 1
Adobe Photoshop bewerking 253 sec.
Testconfiguratie
  • CPU Test 2021
  • 1
Adobe Premiere Pro HWI TV 4K 1.165 sec.
Testconfiguratie
  • CPU Test 2021
  • 1
Da Vinci Resolve - 4K Video 1.013 sec.
Testconfiguratie
  • CPU Test 2021
  • 1
StaxRip x264 21,16 fps
Testconfiguratie
  • CPU Test 2021
  • 1
StaxRip x265 9,11 fps
Testconfiguratie
  • CPU Test 2021
  • 1
Flac - 1 uur WAV naar Flac 196 sec.
Testconfiguratie
  • CPU Test 2021
  • 1
Chrome : Jetstream 2 158.968
Testconfiguratie
  • CPU Test 2021
  • 1
MozillaBuild - Firefox compile 3.446
Testconfiguratie
  • CPU Test 2021
  • 1
AIDA64 - Zlib 361
Testconfiguratie
  • CPU Test 2021
  • 1
AIDA64 - AES 18.660
Testconfiguratie
  • CPU Test 2021
  • 1
AIDA64 - Hash 4.673
Testconfiguratie
  • CPU Test 2021
  • 1
AIDA64 - SHA3 1.690
Testconfiguratie
  • CPU Test 2021
  • 1
AIDA64 - Julia 34.661
Testconfiguratie
  • CPU Test 2021
  • 1
AIDA64 - Mandel 18.218
Testconfiguratie
  • CPU Test 2021
  • 1
AIDA64 - FP32 Raytrace 7.171
Testconfiguratie
  • CPU Test 2021
  • 1
AIDA64 - FP64 Raytrace 3.924
Testconfiguratie
  • CPU Test 2021
  • 1
Systeemverbruik Cinebench 23 86 W
Testconfiguratie
  • CPU Test 2021
  • 1
Blender - Italian Flat Render 1.975 sec.
Testconfiguratie
  • CPU Test 2022
7-Zip - 15GB inpakken 769 sec.
Testconfiguratie
  • CPU Test 2022

Testresultaten 2020 (Win 10 1909) Geïnt. GPU of GTX 1650

3DMark Nightraid 5.739
Testconfiguratie
  • CPU Test 2020
  • Geïnt. gpu (GTX 1650 bij CPU's zonder iGPU)
  • Windows 10 1909
  • High performance energie profiel (tenzij anders aangegeven)
3DMark Nightraid - Graphics 5.450
Testconfiguratie
  • CPU Test 2020
  • Geïnt. gpu (GTX 1650 bij CPU's zonder iGPU)
  • Windows 10 1909
  • High performance energie profiel (tenzij anders aangegeven)
3DMark Nightraid - CPU 70 ms
Testconfiguratie
  • CPU Test 2020
  • Geïnt. gpu (GTX 1650 bij CPU's zonder iGPU)
  • Windows 10 1909
  • High performance energie profiel (tenzij anders aangegeven)
Dota 2 (Vulkan) - 1920x1080 - Low 136,9 fps
Testconfiguratie
  • CPU Test 2020
  • Geïnt. gpu (GTX 1650 bij CPU's zonder iGPU)
  • Windows 10 1909
  • High performance energie profiel (tenzij anders aangegeven)
Dota 2 (Vulkan) - 1920x1080 - Medium 23,5 fps
Testconfiguratie
  • CPU Test 2020
  • Geïnt. gpu (GTX 1650 bij CPU's zonder iGPU)
  • Windows 10 1909
  • High performance energie profiel (tenzij anders aangegeven)
F1 2019 - 1280x720 - Low 24,6 fps
Testconfiguratie
  • CPU Test 2020
  • Geïnt. gpu (GTX 1650 bij CPU's zonder iGPU)
  • Windows 10 1909
  • High performance energie profiel (tenzij anders aangegeven)
F1 2019 - 1280x720 - Medium 22,4 fps
Testconfiguratie
  • CPU Test 2020
  • Geïnt. gpu (GTX 1650 bij CPU's zonder iGPU)
  • Windows 10 1909
  • High performance energie profiel (tenzij anders aangegeven)
Cinebench 10 (32 bit) - MultiThread 26.817
Testconfiguratie
  • CPU Test 2020
  • Geïnt. gpu (GTX 1650 bij CPU's zonder iGPU)
  • Windows 10 1909
  • High performance energie profiel (tenzij anders aangegeven)
Cinebench 20 - SingleThread 434
Testconfiguratie
  • CPU Test 2020
  • Geïnt. gpu (GTX 1650 bij CPU's zonder iGPU)
  • Windows 10 1909
  • High performance energie profiel (tenzij anders aangegeven)
Cinebench 20 - MultiThread 2.168
Testconfiguratie
  • CPU Test 2020
  • Geïnt. gpu (GTX 1650 bij CPU's zonder iGPU)
  • Windows 10 1909
  • High performance energie profiel (tenzij anders aangegeven)
Blender 2.81a - Pavillion CPU render 1.195 sec.
Testconfiguratie
  • CPU Test 2020
  • Geïnt. gpu (GTX 1650 bij CPU's zonder iGPU)
  • Windows 10 1909
  • High performance energie profiel (tenzij anders aangegeven)
Adobe Lightroom 9.0 - Export 100 foto's 386 sec.
Testconfiguratie
  • CPU Test 2020
  • Geïnt. gpu (GTX 1650 bij CPU's zonder iGPU)
  • Windows 10 1909
  • High performance energie profiel (tenzij anders aangegeven)
Adobe Photoshop 21 - Panorama 111 sec.
Testconfiguratie
  • CPU Test 2020
  • Geïnt. gpu (GTX 1650 bij CPU's zonder iGPU)
  • Windows 10 1909
  • High performance energie profiel (tenzij anders aangegeven)
Adobe Photoshop 21 - Bewerkingen 243 sec.
Testconfiguratie
  • CPU Test 2020
  • Geïnt. gpu (GTX 1650 bij CPU's zonder iGPU)
  • Windows 10 1909
  • High performance energie profiel (tenzij anders aangegeven)
Adobe Premiere Pro 14 - HWI TV 4K 1.204 sec.
Testconfiguratie
  • CPU Test 2020
  • Geïnt. gpu (GTX 1650 bij CPU's zonder iGPU)
  • Windows 10 1909
  • High performance energie profiel (tenzij anders aangegeven)
Da Vinci Resolve - 4K Video 944 sec.
Testconfiguratie
  • CPU Test 2020
  • Geïnt. gpu (GTX 1650 bij CPU's zonder iGPU)
  • Windows 10 1909
  • High performance energie profiel (tenzij anders aangegeven)
Staxrip - x264 (r2969) 111 fps
Testconfiguratie
  • CPU Test 2020
  • Geïnt. gpu (GTX 1650 bij CPU's zonder iGPU)
  • Windows 10 1909
  • High performance energie profiel (tenzij anders aangegeven)
Staxrip - x265 (3.2.0.5) 32,28 fps
Testconfiguratie
  • CPU Test 2020
  • Geïnt. gpu (GTX 1650 bij CPU's zonder iGPU)
  • Windows 10 1909
  • High performance energie profiel (tenzij anders aangegeven)
Flac - 1 uur WAV naar Flac 194 sec.
Testconfiguratie
  • CPU Test 2020
  • Geïnt. gpu (GTX 1650 bij CPU's zonder iGPU)
  • Windows 10 1909
  • High performance energie profiel (tenzij anders aangegeven)
Microsoft Word 2019 - 1000 Pagina's naar PDF 56 sec.
Testconfiguratie
  • CPU Test 2020
  • Geïnt. gpu (GTX 1650 bij CPU's zonder iGPU)
  • Windows 10 1909
  • High performance energie profiel (tenzij anders aangegeven)
Microsoft Excel 2019 - Monte Carlo 2,52 sec.
Testconfiguratie
  • CPU Test 2020
  • Geïnt. gpu (GTX 1650 bij CPU's zonder iGPU)
  • Windows 10 1909
  • High performance energie profiel (tenzij anders aangegeven)
7-Zip v19.00 - 4GB inpakken 229 sec.
Testconfiguratie
  • CPU Test 2020
  • Geïnt. gpu (GTX 1650 bij CPU's zonder iGPU)
  • Windows 10 1909
  • High performance energie profiel (tenzij anders aangegeven)
Chrome 79 - Jetstream 2 125,83
Testconfiguratie
  • CPU Test 2020
  • Geïnt. gpu (GTX 1650 bij CPU's zonder iGPU)
  • Windows 10 1909
  • High performance energie profiel (tenzij anders aangegeven)
AIDA64 (6.20.5300) - Zlib 364 MB/s
Testconfiguratie
  • CPU Test 2020
  • Geïnt. gpu (GTX 1650 bij CPU's zonder iGPU)
  • Windows 10 1909
  • High performance energie profiel (tenzij anders aangegeven)
AIDA64 (6.20.5300) - AES 18.695 MB/s
Testconfiguratie
  • CPU Test 2020
  • Geïnt. gpu (GTX 1650 bij CPU's zonder iGPU)
  • Windows 10 1909
  • High performance energie profiel (tenzij anders aangegeven)
AIDA64 (6.20.5300) - SHA3 1.586 MB/s
Testconfiguratie
  • CPU Test 2020
  • Geïnt. gpu (GTX 1650 bij CPU's zonder iGPU)
  • Windows 10 1909
  • High performance energie profiel (tenzij anders aangegeven)
AIDA64 (6.20.5300) - Hash 4.702 MB/s
Testconfiguratie
  • CPU Test 2020
  • Geïnt. gpu (GTX 1650 bij CPU's zonder iGPU)
  • Windows 10 1909
  • High performance energie profiel (tenzij anders aangegeven)
AIDA64 (6.20.5300) - Julia 34.820
Testconfiguratie
  • CPU Test 2020
  • Geïnt. gpu (GTX 1650 bij CPU's zonder iGPU)
  • Windows 10 1909
  • High performance energie profiel (tenzij anders aangegeven)
AIDA64 (6.20.5300) - Mandel 18.288
Testconfiguratie
  • CPU Test 2020
  • Geïnt. gpu (GTX 1650 bij CPU's zonder iGPU)
  • Windows 10 1909
  • High performance energie profiel (tenzij anders aangegeven)
AIDA64 (6.20.5300) - FP32 Raytrace 7.227 KRay/s
Testconfiguratie
  • CPU Test 2020
  • Geïnt. gpu (GTX 1650 bij CPU's zonder iGPU)
  • Windows 10 1909
  • High performance energie profiel (tenzij anders aangegeven)
AIDA64 (6.20.5300) - FP64 Raytrace 3.980 KRay/s
Testconfiguratie
  • CPU Test 2020
  • Geïnt. gpu (GTX 1650 bij CPU's zonder iGPU)
  • Windows 10 1909
  • High performance energie profiel (tenzij anders aangegeven)
Systeemverbruik Cinebench 20 75 W
Testconfiguratie
  • CPU Test 2020
  • Geïnt. gpu (GTX 1650 bij CPU's zonder iGPU)
  • Windows 10 1909
  • High performance energie profiel (tenzij anders aangegeven)

Testresultaten 2020 (Win 10 1909) - RTX 2080 Ti

Battlefield V (DX12) - 1920x1080 - Medium 130,2 fps
Testconfiguratie
  • CPU Test 2020
  • Icm. RTX 2080 Ti
  • Windows 10 1909
  • High performance energie profiel
Battlefield V (DX12) - 1920x1080 - Ultra 118,7 fps
Testconfiguratie
  • CPU Test 2020
  • Icm. RTX 2080 Ti
  • Windows 10 1909
  • High performance energie profiel
Dirt Rally 2.0 - 1920x1080 - Medium 229,2 fps
Testconfiguratie
  • CPU Test 2020
  • Icm. RTX 2080 Ti
  • Windows 10 1909
  • High performance energie profiel
Dirt Rally 2.0 - 1920x1080 - Ultra 139,4 fps
Testconfiguratie
  • CPU Test 2020
  • Icm. RTX 2080 Ti
  • Windows 10 1909
  • High performance energie profiel
GTA V - 1920x1080 - Medium 121,3 fps
Testconfiguratie
  • CPU Test 2020
  • Icm. RTX 2080 Ti
  • Windows 10 1909
  • High performance energie profiel
GTA V - 1920x1080 - Ultra 90,3 fps
Testconfiguratie
  • CPU Test 2020
  • Icm. RTX 2080 Ti
  • Windows 10 1909
  • High performance energie profiel
The Division 2 (DX12) - 1920x1080 - Medium 153,9 fps
Testconfiguratie
  • CPU Test 2020
  • Icm. RTX 2080 Ti
  • Windows 10 1909
  • High performance energie profiel
The Division 2 (DX12) - 1920x1080 - Ultra 124,9 fps
Testconfiguratie
  • CPU Test 2020
  • Icm. RTX 2080 Ti
  • Windows 10 1909
  • High performance energie profiel
Total War: Three Kingdoms - 1920x1080 - Medium 130,8 fps
Testconfiguratie
  • CPU Test 2020
  • Icm. RTX 2080 Ti
  • Windows 10 1909
  • High performance energie profiel
Total War: Three Kingdoms - 1920x1080 - Ultra 92,8 fps
Testconfiguratie
  • CPU Test 2020
  • Icm. RTX 2080 Ti
  • Windows 10 1909
  • High performance energie profiel
Factorio (0.17.79) 10K SPM Base (Headless) - 10.000 ticks 112,46 UPS
Testconfiguratie
  • CPU Test 2020
  • Icm. RTX 2080 Ti
  • Windows 10 1909
  • High performance energie profiel
Streaming (x264 6Mbit + F1 2019) - gem. over 3 runs 65,6 fps
Testconfiguratie
  • CPU Test 2020
  • Icm. RTX 2080 Ti
  • Windows 10 1909
  • High performance energie profiel
Hardware Info CPU Gaming Prestatiescore 2020 131,3
Testconfiguratie
  • CPU Test 2020
  • Icm. RTX 2080 Ti
  • Windows 10 1909
  • High performance energie profiel

Testresultaten 2020 (Win 10 1909) - RTX 2080 Ti - Frametimes

Battlefield V (DX12) - 1920x1080 - Medium (99p) 14,75 ms
Testconfiguratie
  • CPU Test 2020
  • Icm. RTX 2080 Ti
  • Windows 10 1909
  • High performance energie profiel
Battlefield V (DX12) - 1920x1080 - Ultra (99p) 15,46 ms
Testconfiguratie
  • CPU Test 2020
  • Icm. RTX 2080 Ti
  • Windows 10 1909
  • High performance energie profiel
GTA V - 1920x1080 - Medium (99p) 14 ms
Testconfiguratie
  • CPU Test 2020
  • Icm. RTX 2080 Ti
  • Windows 10 1909
  • High performance energie profiel
GTA V - 1920x1080 - Ultra (99p) 16 ms
Testconfiguratie
  • CPU Test 2020
  • Icm. RTX 2080 Ti
  • Windows 10 1909
  • High performance energie profiel
The Division 2 (DX12) - 1920x1080 - Medium (99p) 10,18 ms
Testconfiguratie
  • CPU Test 2020
  • Icm. RTX 2080 Ti
  • Windows 10 1909
  • High performance energie profiel
The Division 2 (DX12) - 1920x1080 - Ultra (99p) 12,99 ms
Testconfiguratie
  • CPU Test 2020
  • Icm. RTX 2080 Ti
  • Windows 10 1909
  • High performance energie profiel
Total War: Three Kingdoms - 1920x1080 - Medium (99p) 12,1 ms
Testconfiguratie
  • CPU Test 2020
  • Icm. RTX 2080 Ti
  • Windows 10 1909
  • High performance energie profiel
Total War: Three Kingdoms - 1920x1080 - Ultra (99p) 17,8 ms
Testconfiguratie
  • CPU Test 2020
  • Icm. RTX 2080 Ti
  • Windows 10 1909
  • High performance energie profiel

Stroomverbruik 2020 (Enkel CPU)

Stroomverbruik idle - Minimaal 3,66 W
Testconfiguratie
  • Stroomverbruik processors (enkel CPU) (2020)
Stroomverbruik idle - Gemiddelde 5 min. 4,92 W
Testconfiguratie
  • Stroomverbruik processors (enkel CPU) (2020)
Stroomverbruik - Cinebench 20 - Gemiddeld 44,2 W
Testconfiguratie
  • Stroomverbruik processors (enkel CPU) (2020)
Stroomverbruik - Cinebench 20 - Totaal (Wh) 1,72 Wh
Testconfiguratie
  • Stroomverbruik processors (enkel CPU) (2020)
Stroomverbruik - Cinebench 20 - Maximaal 45,78 W
Testconfiguratie
  • Stroomverbruik processors (enkel CPU) (2020)
Adobe Premiere Pro 14 - Verbruik - Gemiddeld 41,2 W
Testconfiguratie
  • Stroomverbruik processors (enkel CPU) (2020)
Adobe Premiere Pro 14 - Verbruik - Totaal (Wh) 13,85 Wh
Testconfiguratie
  • Stroomverbruik processors (enkel CPU) (2020)

Temperatuur resultaten (Dark Rock Pro 4 @ 12V)

Max. temperatuur (15 min. Cinebench 20) 45 °C
Testconfiguratie
  • Temperatuur test 2020
Gem. kloksnelheid (15 min. Cinebench 20) 4.100 MHz
Testconfiguratie
  • Temperatuur test 2020
Max. package power (HWinfo) 44 W
Testconfiguratie
  • Temperatuur test 2020

Windows benchmarks

3DMark - Night Raid CPU 8.168
Testconfiguratie
  • Windows benchmarks

Reviews

0