Prijsverloop

Dit product is niet (meer) verkrijgbaar bij de bij Hardware Info aangesloten shops.

Specificaties

Belangrijkste specificaties

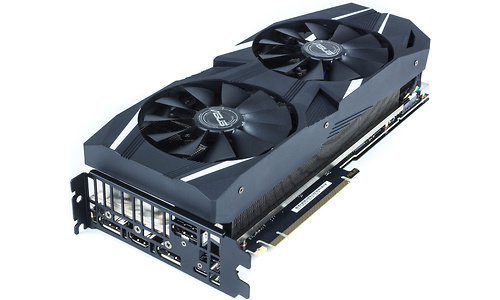
GPU Nvidia GeForce RTX 2080
Klokfrequentie turbo 1.710 MHz
Geheugengrootte 8.192 MB

Chip

GPU Nvidia GeForce RTX 2080
GPU serie Nvidia GeForce RTX-20
GPU fabrikant Nvidia
Klokfrequentie GPU 1.515 MHz
Klokfrequentie turbo 1.710 MHz
Aantal rekenkernen 2.944

Geheugen

Geheugengrootte 8.192 MB
Geheugensnelheid 1.750 MHz
Geheugentype GDDR6
Geheugenkoeling
Geheugenchips (merk) Micron

Functionaliteit

DirectX versie DirectX 12
OpenGL versie 4
Nvidia SLI/NVLink-compatible
AMD Crossfire-compatible

Kaartontwerp

Interface PCI-Express 3.0 x16
GPU koeling Actief (2x)
PEG stroomaansluiting
Type power connector(s) PEG6+PEG8
Aantal slots 3
Lengte 26,7 cm
Breedte 11 cm
Hoogte 6 cm
Low profile

Aansluitingen

D-Sub uitgang
DVI uitgang
Aantal DVI uitgangen 0
HDMI uitgang
HDMI-versie 2.0b
Aantal HDMI uitgangen 1
DisplayPort uitgang
DisplayPort-versie 1.4
Aantal DisplayPort uitgangen 3
Interne HDMI aansluitingen 0
USB-C uitgang
VirtualLink USB-C

Meegeleverd

DVI -> D-Sub plug
DVI -> HDMI plug
HDMI -> DVI plug
Afstandsbediening
DVD software ASUS GPU Tweak II & Driver
Software bundle(s) WTFast 6-Month Premium License

Productcodes

SKU 90YV0C30-M0NA00, 90YV0C30-M0NM00, DUAL-RTX2080-O8G
EAN 4718017135818
Toegevoegd aan Hardware Info dinsdag 21 augustus 2018

Testresultaten

Dit product is door Hardware Info getest op donderdag 11 oktober 2018.

Benchmarks 2018 (Win 10 Pro x64, Intel Core i9 7900X @ 4.5GHz)

Gebruikte driver versie 411.70
Testconfiguratie
  • Intel Core i9 7900X @ 4.5GHz, 32GB DDR4
  • 3200C14, Asus Strix X299
  • E Gaming, 2x Samsung 840 Evo 1TB, Windows 10 Pro x64
3DMark Firestrike 21.841
Testconfiguratie
  • Intel Core i9 7900X @ 4.5GHz, 32GB DDR4
  • 3200C14, Asus Strix X299
  • E Gaming, 2x Samsung 840 Evo 1TB, Windows 10 Pro x64
3DMark Firestrike Graphics score 26.914
Testconfiguratie
  • Intel Core i9 7900X @ 4.5GHz, 32GB DDR4
  • 3200C14, Asus Strix X299
  • E Gaming, 2x Samsung 840 Evo 1TB, Windows 10 Pro x64
3DMark Firestrike Extreme 12.471
Testconfiguratie
  • Intel Core i9 7900X @ 4.5GHz, 32GB DDR4
  • 3200C14, Asus Strix X299
  • E Gaming, 2x Samsung 840 Evo 1TB, Windows 10 Pro x64
3DMark Firestrike Ultra 6.516
Testconfiguratie
  • Intel Core i9 7900X @ 4.5GHz, 32GB DDR4
  • 3200C14, Asus Strix X299
  • E Gaming, 2x Samsung 840 Evo 1TB, Windows 10 Pro x64
3DMark Timespy 10.815
Testconfiguratie
  • Intel Core i9 7900X @ 4.5GHz, 32GB DDR4
  • 3200C14, Asus Strix X299
  • E Gaming, 2x Samsung 840 Evo 1TB, Windows 10 Pro x64
3DMark Timespy - Graphics score 10.633
Testconfiguratie
  • Intel Core i9 7900X @ 4.5GHz, 32GB DDR4
  • 3200C14, Asus Strix X299
  • E Gaming, 2x Samsung 840 Evo 1TB, Windows 10 Pro x64
Unigine Superposition - 1080p High - Totaalscore 15.165
Testconfiguratie
  • Intel Core i9 7900X @ 4.5GHz, 32GB DDR4
  • 3200C14, Asus Strix X299
  • E Gaming, 2x Samsung 840 Evo 1TB, Windows 10 Pro x64
Unigine Superposition - 1080p High 113,4 fps
Testconfiguratie
  • Intel Core i9 7900X @ 4.5GHz, 32GB DDR4
  • 3200C14, Asus Strix X299
  • E Gaming, 2x Samsung 840 Evo 1TB, Windows 10 Pro x64
Unigine Superposition - 4K Optimized - Totaalscore 8.734
Testconfiguratie
  • Intel Core i9 7900X @ 4.5GHz, 32GB DDR4
  • 3200C14, Asus Strix X299
  • E Gaming, 2x Samsung 840 Evo 1TB, Windows 10 Pro x64
Unigine Superposition - 4K Optimized 65,3 fps
Testconfiguratie
  • Intel Core i9 7900X @ 4.5GHz, 32GB DDR4
  • 3200C14, Asus Strix X299
  • E Gaming, 2x Samsung 840 Evo 1TB, Windows 10 Pro x64
Assassins Creed Origins - 1920x1080 - Medium 126 fps
Testconfiguratie
  • Intel Core i9 7900X @ 4.5GHz, 32GB DDR4
  • 3200C14, Asus Strix X299
  • E Gaming, 2x Samsung 840 Evo 1TB, Windows 10 Pro x64
Assassins Creed Origins - 1920x1080 - Ultra 100 fps
Testconfiguratie
  • Intel Core i9 7900X @ 4.5GHz, 32GB DDR4
  • 3200C14, Asus Strix X299
  • E Gaming, 2x Samsung 840 Evo 1TB, Windows 10 Pro x64
Assassins Creed Origins - 2560x1440 - Medium 103 fps
Testconfiguratie
  • Intel Core i9 7900X @ 4.5GHz, 32GB DDR4
  • 3200C14, Asus Strix X299
  • E Gaming, 2x Samsung 840 Evo 1TB, Windows 10 Pro x64
Assassins Creed Origins - 2560x1440 - Ultra 79 fps
Testconfiguratie
  • Intel Core i9 7900X @ 4.5GHz, 32GB DDR4
  • 3200C14, Asus Strix X299
  • E Gaming, 2x Samsung 840 Evo 1TB, Windows 10 Pro x64
Assassins Creed Origins - 3840x2160 - Medium 68 fps
Testconfiguratie
  • Intel Core i9 7900X @ 4.5GHz, 32GB DDR4
  • 3200C14, Asus Strix X299
  • E Gaming, 2x Samsung 840 Evo 1TB, Windows 10 Pro x64
Assassins Creed Origins - 3840x2160 - Ultra 51 fps
Testconfiguratie
  • Intel Core i9 7900X @ 4.5GHz, 32GB DDR4
  • 3200C14, Asus Strix X299
  • E Gaming, 2x Samsung 840 Evo 1TB, Windows 10 Pro x64
Battlefield 1 (DX12) - 1920x1080 - Medium 185,1 fps
Testconfiguratie
  • Intel Core i9 7900X @ 4.5GHz, 32GB DDR4
  • 3200C14, Asus Strix X299
  • E Gaming, 2x Samsung 840 Evo 1TB, Windows 10 Pro x64
Battlefield 1 (DX12) - 1920x1080 - Ultra 164,4 fps
Testconfiguratie
  • Intel Core i9 7900X @ 4.5GHz, 32GB DDR4
  • 3200C14, Asus Strix X299
  • E Gaming, 2x Samsung 840 Evo 1TB, Windows 10 Pro x64
Battlefield 1 (DX12) - 2560x1440 - Medium 163,3 fps
Testconfiguratie
  • Intel Core i9 7900X @ 4.5GHz, 32GB DDR4
  • 3200C14, Asus Strix X299
  • E Gaming, 2x Samsung 840 Evo 1TB, Windows 10 Pro x64
Battlefield 1 (DX12) - 2560x1440 - Ultra 135,5 fps
Testconfiguratie
  • Intel Core i9 7900X @ 4.5GHz, 32GB DDR4
  • 3200C14, Asus Strix X299
  • E Gaming, 2x Samsung 840 Evo 1TB, Windows 10 Pro x64
Battlefield 1 (DX12) - 3840x2160 - Medium 94,4 fps
Testconfiguratie
  • Intel Core i9 7900X @ 4.5GHz, 32GB DDR4
  • 3200C14, Asus Strix X299
  • E Gaming, 2x Samsung 840 Evo 1TB, Windows 10 Pro x64
Battlefield 1 (DX12) - 3840x2160 - Ultra 75,6 fps
Testconfiguratie
  • Intel Core i9 7900X @ 4.5GHz, 32GB DDR4
  • 3200C14, Asus Strix X299
  • E Gaming, 2x Samsung 840 Evo 1TB, Windows 10 Pro x64
F1 2018 - 1920x1080 - Medium 264,2 fps
Testconfiguratie
  • Intel Core i9 7900X @ 4.5GHz, 32GB DDR4
  • 3200C14, Asus Strix X299
  • E Gaming, 2x Samsung 840 Evo 1TB, Windows 10 Pro x64
F1 2018 - 1920x1080 - Ultra 160,1 fps
Testconfiguratie
  • Intel Core i9 7900X @ 4.5GHz, 32GB DDR4
  • 3200C14, Asus Strix X299
  • E Gaming, 2x Samsung 840 Evo 1TB, Windows 10 Pro x64
F1 2018 - 2560x1440 - Medium 211,8 fps
Testconfiguratie
  • Intel Core i9 7900X @ 4.5GHz, 32GB DDR4
  • 3200C14, Asus Strix X299
  • E Gaming, 2x Samsung 840 Evo 1TB, Windows 10 Pro x64
F1 2018 - 2560x1440 - Ultra 127 fps
Testconfiguratie
  • Intel Core i9 7900X @ 4.5GHz, 32GB DDR4
  • 3200C14, Asus Strix X299
  • E Gaming, 2x Samsung 840 Evo 1TB, Windows 10 Pro x64
F1 2018 - 3840x2160 - Medium 129,4 fps
Testconfiguratie
  • Intel Core i9 7900X @ 4.5GHz, 32GB DDR4
  • 3200C14, Asus Strix X299
  • E Gaming, 2x Samsung 840 Evo 1TB, Windows 10 Pro x64
F1 2018 - 3840x2160 - Ultra 77,2 fps
Testconfiguratie
  • Intel Core i9 7900X @ 4.5GHz, 32GB DDR4
  • 3200C14, Asus Strix X299
  • E Gaming, 2x Samsung 840 Evo 1TB, Windows 10 Pro x64
Far Cry 5 - 1920x1080 - Medium 134 fps
Testconfiguratie
  • Intel Core i9 7900X @ 4.5GHz, 32GB DDR4
  • 3200C14, Asus Strix X299
  • E Gaming, 2x Samsung 840 Evo 1TB, Windows 10 Pro x64
Far Cry 5 - 1920x1080 - Ultra 119 fps
Testconfiguratie
  • Intel Core i9 7900X @ 4.5GHz, 32GB DDR4
  • 3200C14, Asus Strix X299
  • E Gaming, 2x Samsung 840 Evo 1TB, Windows 10 Pro x64
Far Cry 5 - 2560x1440 - Medium 120 fps
Testconfiguratie
  • Intel Core i9 7900X @ 4.5GHz, 32GB DDR4
  • 3200C14, Asus Strix X299
  • E Gaming, 2x Samsung 840 Evo 1TB, Windows 10 Pro x64
Far Cry 5 - 2560x1440 - Ultra 104 fps
Testconfiguratie
  • Intel Core i9 7900X @ 4.5GHz, 32GB DDR4
  • 3200C14, Asus Strix X299
  • E Gaming, 2x Samsung 840 Evo 1TB, Windows 10 Pro x64
Far Cry 5 - 3840x2160 - Medium 66 fps
Testconfiguratie
  • Intel Core i9 7900X @ 4.5GHz, 32GB DDR4
  • 3200C14, Asus Strix X299
  • E Gaming, 2x Samsung 840 Evo 1TB, Windows 10 Pro x64
Far Cry 5 - 3840x2160 - Ultra 57 fps
Testconfiguratie
  • Intel Core i9 7900X @ 4.5GHz, 32GB DDR4
  • 3200C14, Asus Strix X299
  • E Gaming, 2x Samsung 840 Evo 1TB, Windows 10 Pro x64
GTA V - 1920x1080 - Medium 133,4 fps
Testconfiguratie
  • Intel Core i9 7900X @ 4.5GHz, 32GB DDR4
  • 3200C14, Asus Strix X299
  • E Gaming, 2x Samsung 840 Evo 1TB, Windows 10 Pro x64
GTA V - 1920x1080 - Ultra 110 fps
Testconfiguratie
  • Intel Core i9 7900X @ 4.5GHz, 32GB DDR4
  • 3200C14, Asus Strix X299
  • E Gaming, 2x Samsung 840 Evo 1TB, Windows 10 Pro x64
GTA V - 2560x1440 - Medium 131,7 fps
Testconfiguratie
  • Intel Core i9 7900X @ 4.5GHz, 32GB DDR4
  • 3200C14, Asus Strix X299
  • E Gaming, 2x Samsung 840 Evo 1TB, Windows 10 Pro x64
GTA V - 2560x1440 - Ultra 95,3 fps
Testconfiguratie
  • Intel Core i9 7900X @ 4.5GHz, 32GB DDR4
  • 3200C14, Asus Strix X299
  • E Gaming, 2x Samsung 840 Evo 1TB, Windows 10 Pro x64
GTA V - 3840x2160 - Medium 102,8 fps
Testconfiguratie
  • Intel Core i9 7900X @ 4.5GHz, 32GB DDR4
  • 3200C14, Asus Strix X299
  • E Gaming, 2x Samsung 840 Evo 1TB, Windows 10 Pro x64
GTA V - 3840x2160 - Ultra 57,8 fps
Testconfiguratie
  • Intel Core i9 7900X @ 4.5GHz, 32GB DDR4
  • 3200C14, Asus Strix X299
  • E Gaming, 2x Samsung 840 Evo 1TB, Windows 10 Pro x64
Rise of the Tomb Raider (DX12) - 1920x1080 - Medium 194,6 fps
Testconfiguratie
  • Intel Core i9 7900X @ 4.5GHz, 32GB DDR4
  • 3200C14, Asus Strix X299
  • E Gaming, 2x Samsung 840 Evo 1TB, Windows 10 Pro x64
Rise of the Tomb Raider (DX12) - 1920x1080 - Ultra 154,1 fps
Testconfiguratie
  • Intel Core i9 7900X @ 4.5GHz, 32GB DDR4
  • 3200C14, Asus Strix X299
  • E Gaming, 2x Samsung 840 Evo 1TB, Windows 10 Pro x64
Rise of the Tomb Raider (DX12) - 2560x1440 - Medium 159,4 fps
Testconfiguratie
  • Intel Core i9 7900X @ 4.5GHz, 32GB DDR4
  • 3200C14, Asus Strix X299
  • E Gaming, 2x Samsung 840 Evo 1TB, Windows 10 Pro x64
Rise of the Tomb Raider (DX12) - 2560x1440 - Ultra 106,5 fps
Testconfiguratie
  • Intel Core i9 7900X @ 4.5GHz, 32GB DDR4
  • 3200C14, Asus Strix X299
  • E Gaming, 2x Samsung 840 Evo 1TB, Windows 10 Pro x64
Rise of the Tomb Raider (DX12) - 3840x2160 - Medium 86 fps
Testconfiguratie
  • Intel Core i9 7900X @ 4.5GHz, 32GB DDR4
  • 3200C14, Asus Strix X299
  • E Gaming, 2x Samsung 840 Evo 1TB, Windows 10 Pro x64
Rise of the Tomb Raider (DX12) - 3840x2160 - Ultra 57,1 fps
Testconfiguratie
  • Intel Core i9 7900X @ 4.5GHz, 32GB DDR4
  • 3200C14, Asus Strix X299
  • E Gaming, 2x Samsung 840 Evo 1TB, Windows 10 Pro x64
Total War Warhammer II - 1920x1080 - Medium 120,6 fps
Testconfiguratie
  • Intel Core i9 7900X @ 4.5GHz, 32GB DDR4
  • 3200C14, Asus Strix X299
  • E Gaming, 2x Samsung 840 Evo 1TB, Windows 10 Pro x64
Total War Warhammer II - 1920x1080 - Ultra 75,4 fps
Testconfiguratie
  • Intel Core i9 7900X @ 4.5GHz, 32GB DDR4
  • 3200C14, Asus Strix X299
  • E Gaming, 2x Samsung 840 Evo 1TB, Windows 10 Pro x64
Total War Warhammer II - 2560x1440 - Medium 116,4 fps
Testconfiguratie
  • Intel Core i9 7900X @ 4.5GHz, 32GB DDR4
  • 3200C14, Asus Strix X299
  • E Gaming, 2x Samsung 840 Evo 1TB, Windows 10 Pro x64
Total War Warhammer II - 2560x1440 - Ultra 72,7 fps
Testconfiguratie
  • Intel Core i9 7900X @ 4.5GHz, 32GB DDR4
  • 3200C14, Asus Strix X299
  • E Gaming, 2x Samsung 840 Evo 1TB, Windows 10 Pro x64
Total War Warhammer II - 3840x2160 - Medium 68,3 fps
Testconfiguratie
  • Intel Core i9 7900X @ 4.5GHz, 32GB DDR4
  • 3200C14, Asus Strix X299
  • E Gaming, 2x Samsung 840 Evo 1TB, Windows 10 Pro x64
Total War Warhammer II - 3840x2160 - Ultra 47,5 fps
Testconfiguratie
  • Intel Core i9 7900X @ 4.5GHz, 32GB DDR4
  • 3200C14, Asus Strix X299
  • E Gaming, 2x Samsung 840 Evo 1TB, Windows 10 Pro x64

Hardware.Info Prestatiescore

HWI Videokaart Prestatiescore 2018-2 (Full HD) 141,6
Testconfiguratie
  • Intel Core i9 7900X @ 4.5GHz, 32GB DDR4
  • 3200C14, Asus Strix X299
  • E Gaming, 2x Samsung 840 Evo 1TB, Windows 10 Pro x64
HWI Videokaart Prestatiescore 2018-2 (WQHD) 119,8
Testconfiguratie
  • Intel Core i9 7900X @ 4.5GHz, 32GB DDR4
  • 3200C14, Asus Strix X299
  • E Gaming, 2x Samsung 840 Evo 1TB, Windows 10 Pro x64
HWI Videokaart Prestatiescore 2018-2 (4K) 73,1
Testconfiguratie
  • Intel Core i9 7900X @ 4.5GHz, 32GB DDR4
  • 3200C14, Asus Strix X299
  • E Gaming, 2x Samsung 840 Evo 1TB, Windows 10 Pro x64

Stroomverbruik

Stroomverbruik (Videokaart) - Idle - 12V PEG1 3,7 W
Testconfiguratie
  • Stroomverbruik videokaarten (enkel GPU). Load in Rise of the Tomb Raider 3840x2160 Ultra settings.
Stroomverbruik (Videokaart) - Idle - 12V PEG2 3,37 W
Testconfiguratie
  • Stroomverbruik videokaarten (enkel GPU). Load in Rise of the Tomb Raider 3840x2160 Ultra settings.
Stroomverbruik (Videokaart) - Idle - 12V PCIe 4,02 W
Testconfiguratie
  • Stroomverbruik videokaarten (enkel GPU). Load in Rise of the Tomb Raider 3840x2160 Ultra settings.
Stroomverbruik (Videokaart) - Idle - Totaal 11,09 W
Testconfiguratie
  • Stroomverbruik videokaarten (enkel GPU). Load in Rise of the Tomb Raider 3840x2160 Ultra settings.
Stroomverbruik (Videokaart) - Load - 12V PEG1 119,39 W
Testconfiguratie
  • Stroomverbruik videokaarten (enkel GPU). Load in Rise of the Tomb Raider 3840x2160 Ultra settings.
Stroomverbruik (Videokaart) - Load - 12V PEG2 54,06 W
Testconfiguratie
  • Stroomverbruik videokaarten (enkel GPU). Load in Rise of the Tomb Raider 3840x2160 Ultra settings.
Stroomverbruik (Videokaart) - Load - 12V PCIe 49,23 W
Testconfiguratie
  • Stroomverbruik videokaarten (enkel GPU). Load in Rise of the Tomb Raider 3840x2160 Ultra settings.
Stroomverbruik (Videokaart) - Load - Totaal 222,68 W
Testconfiguratie
  • Stroomverbruik videokaarten (enkel GPU). Load in Rise of the Tomb Raider 3840x2160 Ultra settings.

Geluidsproductie

Geluidsproductie - Idle (10 cm.) 17 dB(A)
Testconfiguratie
  • Geluidsproductie & warmte ontwikkeling 2018
  • 2019
Geluidsproductie - Load (10 cm.) 46,3 dB(A)
Testconfiguratie
  • Geluidsproductie & warmte ontwikkeling 2018
  • 2019
Geluidsproductie - 100% fanprofiel (10 cm.) 63,5 dB(A)
Testconfiguratie
  • Geluidsproductie & warmte ontwikkeling 2018
  • 2019
Fanprofiel 1 load 54 %
Testconfiguratie
  • Geluidsproductie & warmte ontwikkeling 2018
  • 2019
Fanprofiel 2 load 0 %
Testconfiguratie
  • Geluidsproductie & warmte ontwikkeling 2018
  • 2019
Fanprofiel voor 40 dB(A) (10 cm.) 39 %
Testconfiguratie
  • Geluidsproductie & warmte ontwikkeling 2018
  • 2019

Warmteontwikkeling

Max. temperatuur (30 min. duurtest) 75 °C
Testconfiguratie
  • Geluidsproductie & warmte ontwikkeling 2018
  • 2019
Max. temperatuur bij 40 dB(A) - duurtest (30 min.) 85 °C
Testconfiguratie
  • Geluidsproductie & warmte ontwikkeling 2018
  • 2019
Stabiele klokfrequentie na 30 min. duurtest 1.860 MHz
Testconfiguratie
  • Geluidsproductie & warmte ontwikkeling 2018
  • 2019
Stabiele klokfrequentie na 30 min. duurtest bij 40 dB(A) 1.815 MHz
Testconfiguratie
  • Geluidsproductie & warmte ontwikkeling 2018
  • 2019

Reviews

Videokaarten

Wie maakt de beste GeForce RTX 2080 (Ti) kaart, Asus, MSI of Gigabyte?

De afgelopen weken hebben we in negen Nvidia GeForce RTX 2080 en 2080 Ti videokaarten getest van Asus, MSI en Gigabyte. Grote vraag is natuurlijk aan welke kaart je jouw zuurverdiende euro's het beste kunt uitgeven, en daarop geven we jou in deze video het antwoord.

12 oktober 2018 15:01
Videokaarten

Kijkersvragen: Alles over de GeForce RTX videokaarten

Nividia introduceerde vorige week de GeForce RTX 2070, 2080 en 2080Ti, een nieuwe serie videokaarten gebouwd op een compleet vernieuwde architectuur met ondersteuning voor raytracing. Maar wat betekent dat in de praktijk? Is het slim om straks een RTX kaart te kopen, of kan je beter voor een GeForce 10 kaart kiezen? Deze en andere vragen die jullie instuurden beantwoorden we in deze video. Wil jij ook een HWI koffiemok? Neem nu een abonnement op ons magazine, en je krijgt hem er gratis bij.

27 augustus 2018 18:01

Alternatieven

Gigabyte GeForce RTX 2070 Gaming OC Black 8GB

  • Nvidia GeForce RTX 2070
  • 1725 MHz
  • 8192 MB
 

Asus RoG GeForce RTX 2080 Strix OC 8GB

  • Nvidia GeForce RTX 2080
  • 1860 MHz
  • 8192 MB
 

Asus RoG Strix GeForce RTX 2080 Ti OC 11GB

  • Nvidia GeForce RTX 2080 Ti
  • 1650 MHz
  • 11264 MB
 

MSI GeForce RTX 2080 Ventus OC 8GB

  • Nvidia GeForce RTX 2080
  • 1800 MHz
  • 8192 MB
 

Gigabyte Aorus GeForce RTX 2080 Xtreme 8GB

  • Nvidia GeForce RTX 2080
  • 1890 MHz
  • 8192 MB
 

MSI GeForce RTX 2070 Gaming Z 8GB

  • Nvidia GeForce RTX 2070
  • 1830 MHz
  • 8192 MB
 

MSI GeForce RTX 2070 Armor 8GB

  • Nvidia GeForce RTX 2070
  • 1620 MHz
  • 8192 MB
 

Gigabyte GeForce RTX 2070 WindForce 8GB

  • Nvidia GeForce RTX 2070
  • 1620 MHz
  • 8192 MB
 

Asus GeForce RTX 2070 Strix OC 8GB

  • Nvidia GeForce RTX 2070
  • 1815 MHz
  • 8192 MB
 

EVGA GeForce RTX 2080 Ti FTW3 Ultra Gaming 11GB

  • Nvidia GeForce RTX 2080 Ti
  • 1755 MHz
  • 11264 MB
 

MSI GeForce RTX 2080 Ti Duke OC 11GB

  • Nvidia GeForce RTX 2080 Ti
  • 1665 MHz
  • 11264 MB
 

MSI GeForce RTX 2080 Ti Gaming X Trio 11GB

  • Nvidia GeForce RTX 2080 Ti
  • 1755 MHz
  • 11264 MB
 
0