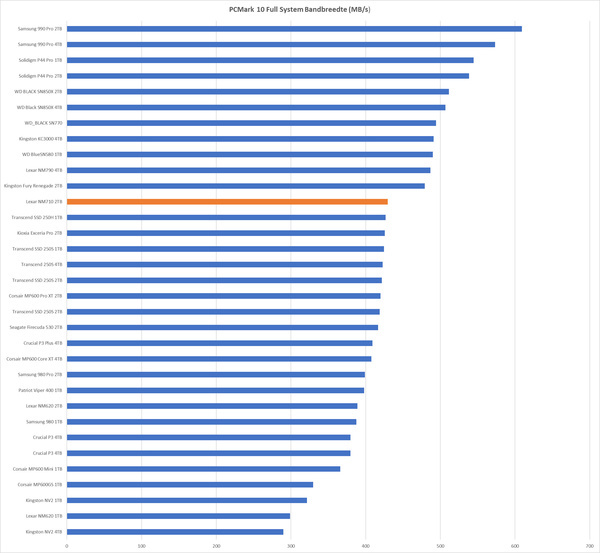
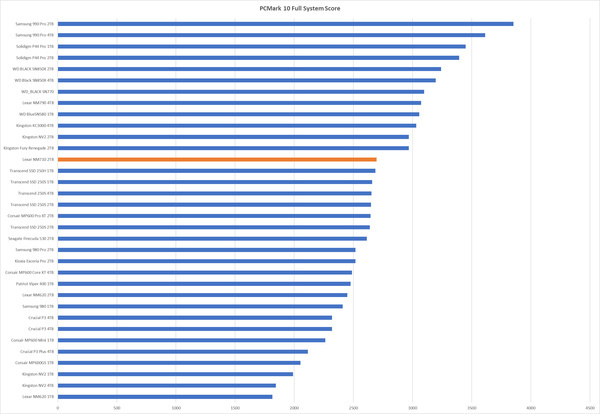
Benchmarks: PCMark 10 Full System Drive
De Full System Drive-test is een belangrijk testonderdeel. Hierbij weet de NM710 een prima resultaat neer te zetten, zeker als je bedenkt dat er geen dram-cache aanwezig is.
| Product | Doorvoersnelheid (MB/s) | Toegangstijd | Score |
|---|---|---|---|
| Lexar NM620 1TB | 298,81 | 95 | 1816 |
| Kingston NV2 4TB | 289,86 | 92 | 1845 |
| Kingston NV2 1TB | 321,33 | 85 | 1990 |
| Corsair MP600GS 1TB | 329,66 | 82 | 2053 |
| Crucial P3 Plus 4TB | 409,05 | 68 | 2115 |
| Corsair MP600 Mini 1TB | 365,97 | 75 | 2262 |
| Crucial P3 4TB | 379,72 | 74 | 2319 |
| Crucial P3 4TB | 379,72 | 74 | 2319 |
| Samsung 980 1TB | 387,77 | 70 | 2410 |
| Lexar NM620 2TB | 389,19 | 68 | 2449 |
| Patriot Viper 400 1TB | 398,08 | 68 | 2477 |
| Corsair MP600 Core XT 4TB | 407,6 | 69 | 2488 |
| Kioxia Exceria Pro 2TB | 425,85 | 66 | 2518 |
| Samsung 980 Pro 2TB | 399,26 | 66 | 2518 |
| Seagate Firecuda 530 2TB | 416,75 | 64 | 2613 |
| Transcend SSD 250S 2TB | 418,95 | 63 | 2640 |
| Corsair MP600 Pro XT 2TB | 420,05 | 64 | 2644 |
| Transcend SSD 250S 2TB | 421,61 | 63 | 2649 |
| Transcend 250S 4TB | 422,93 | 63 | 2653 |
| Transcend SSD 250S 1TB | 424,75 | 63 | 2658 |
| Transcend SSD 250H 1TB | 426,59 | 62 | 2686 |
| Lexar NM710 2TB | 429,5 | 62 | 2695 |
| Kingston NV2 2TB | 479,34 | 57 | 2969 |
| Kingston Fury Renegade 2TB | 482,77 | 67 | 2980 |
| Kingston KC3000 4TB | 491,14 | 56 | 3032 |
| WD BlueSN580 1TB | 490,15 | 55 | 3056 |
| Lexar NM790 4TB | 486,59 | 54 | 3073 |
| WD_BLACK SN770 | 494,24 | 54 | 3098 |
| WD BLACK SN850X 4TB | 506,.76 | 52 | 3196 |
| WD BLACK SN850X 2TB | 511,4 | 51 | 3242 |
| Solidigm P44 Pro 2TB | 538,35 | 49 | 3394 |
| Solidigm P44 Pro 1TB | 544,59 | 48 | 3449 |
| Samsung 990 Pro 4TB | 609,11 | 43 | 3865 |
| Samsung 990 Pro 2TB | 609,11 | 43 | 3854 |
Advertentie
3 besproken producten
| Vergelijk | Product | Prijs | |
|---|---|---|---|
|
Lexar NM710 1TB (M.2 2280)
|
€ 63,225 winkels |
|
|
Lexar NM710 2TB (M.2 2280)
|
€ 98,855 winkels |
|

|
Lexar NM710 500GB (M.2 2280)
|
€ 41,004 winkels |