Getest

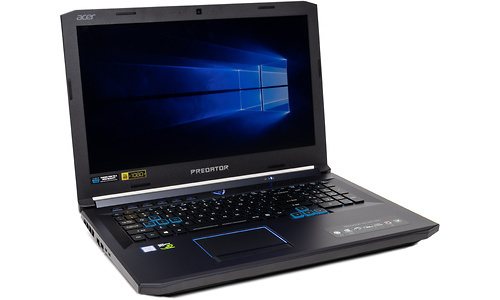
Acer Predator Helios 500 PH517-51-79T5
Prijsverloop

Dit product is niet (meer) verkrijgbaar bij de bij Hardware Info aangesloten shops.

Specificaties

Belangrijkste specificaties

Processor type Intel Core i7 8750H
Geheugen capaciteit 16 GB
Scherm diagonaal 17,3 inch
Resolutie 1920x1080
Touchscreen
GPU type Nvidia GeForce GTX 1070
Totale opslagcapaciteit 1.512 GB
Toetsenbordindeling Qwerty
Gewicht totaal 3,76 kg
Besturingssysteem (serie) Windows

Processor / Chipset / Geheugen

Processor serie Intel Core i7
Processor type Intel Core i7 8750H
Processor klokfrequentie 2,2 GHz
Processor klokfrequentie (max. turbo) 4,1 GHz
Configureerbare TDP-down 35 W
Configureerbare TDP-downfrequentie 2 GHz
Aantal processorcores 6
Geheugen capaciteit 16 GB
Type geheugen DDR4
Geheugen klokfrequentie 2.400 MHz
Geheugen form factor Sodimm
SODIMM sloten 4
Vrije SODIMM sloten 2
Werkgeheugen uitbreidbaar tot 32 GB

Scherm

Scherm diagonaal 17,3 inch
Resolutie 1920x1080
Verhouding 16:9
Pixeldichtheid 127 ppi
Scherm type (mat/glans) Mat
Paneeltype IPS
LED-achtergrondverlichting
Touchscreen
Geschikt voor peninvoer
3D-scherm
Maximale verversingsfrequentie 144 Hz

Graphics

GPU type Nvidia GeForce GTX 1070
Geïntegreerde / losse GPU Losse chip
Videogeheugen 8 GB

Opslag

Totale opslagcapaciteit 1.512 GB
SSD opslagcapaciteit 512 GB
Harddisk opslagcapaciteit 1.000 GB
Harddisk toerental 5.400 rpm
Beschikbaar opslaggeheugen 1.346,4 GB
Aantal harddisks / SSD's 2
Harddisk/SSD 1 capaciteit 256 GB
Harddisk/SSD 1 soort SSD/Flash
Harddisk/SSD 1 form factor M.2
Harddisk/SSD 1 merk/product HFS256GD9MNE-6200A
Harddisk/SSD 2 capaciteit 1.000 GB
Harddisk/SSD 2 soort Harddisk
Harddisk/SSD 2 merk/product Toshiba MQ04ABF100
DVD branden
Blu-ray lezen
Blu-ray branden

Connectiviteit / Netwerk

Netwerkaansluiting (bedraad)
Netwerkadapter (bedraad) Killer E2500
Netwerksnelheid (bedraad) 1000 Mbit/s
WiFi standaard 802.11ac (Wi-Fi 5)
WiFi adapter Killer Wireless-AC 1550
Bluetooth
Bluetooth-versie Bluetooth 5.0
3G (HSPA/UMTS)
4G (LTE)

Aansluitingen

Smartcard
USB 3.2 - 5 Gb/s (Type-A) 3
USB 3.0 (USB 3.1 Gen 1) 3
USB 3.1 (USB 3.1 Gen 2) 1
USB Type-C
Thunderbolt 2
Thunderbolt 3 (Type-C) 2
Cardreader - SD
Cardreader - MicroSD
DVI-uitgang
VGA-uitgang
HDMI-uitgang
Aantal HDMI-uitgangen 1
Micro HDMI-uitgang
HDMI-versie 2.0
DisplayPort-uitgang
Aantal DisplayPort-uitgangen 1
Mini DisplayPort-uitgang
DisplayPort-versie 1.2
Analoge audio aansluitingen 2
Aansluiting dockingstation
Kensingtonslot

Toetsenbord en touchpad

Toetsenbordindeling Qwerty
Numeriek toetsenbord

Camera

Webcam
Webcam resolutie 0,9 MPixel
Tweede camera
Flitser

Sensors

Accelerometer
Vingerafdruklezer
GPS
Kompas
NFC

Overige hardware

Trusted Platform Module (TPM)
Geïntegreerde microfoon

Maten en gewichten

Accu capaciteit (mAh) 4.810 mAh
Accu capaciteit (Wh) 74 Wh
Verwisselbare accu
Gewicht totaal 3,76 kg
Afmeting - Breedte 42,6 cm
Afmeting - Diepte 31,1 cm
Afmeting - Hoogte/Dikte 4,7 cm

Software

Besturingssysteem Microsoft Windows 10 Home
Besturingssysteem (serie) Windows
Aantal bits OS 64 bit

Fabrikantsopgave eigenschappen

Garantie 1 jaar

Productcodes

SKU NH.Q3NEH.003
EAN 4713883836418
Toegevoegd aan Hardware Info dinsdag 14 augustus 2018

Testresultaten

Dit product is door Hardware Info getest op maandag 22 oktober 2018.

Platform onafhankelijke tests

Opstarttijd 20,45 sec.
Testconfiguratie
  • Platform onafhankelijke tests
WiFi speedtest 2.4GHz receive 201 Mbit/s
Testconfiguratie
  • Platform onafhankelijke tests
WiFi speedtest 2.4GHz send 195 Mbit/s
Testconfiguratie
  • Platform onafhankelijke tests
WiFi speedtest 5.0GHz receive 560 Mbit/s
Testconfiguratie
  • Platform onafhankelijke tests
WiFi speedtest 5.0GHz send 557 Mbit/s
Testconfiguratie
  • Platform onafhankelijke tests

Windows benchmarks

3DMark - Ice Storm 160.880
Testconfiguratie
  • Windows benchmarks
3DMark - Cloud Gate 32.726
Testconfiguratie
  • Windows benchmarks
3DMark - Cloud Gate Graphics 117.664
Testconfiguratie
  • Windows benchmarks
3DMark - Cloud Gate Physics 9.280
Testconfiguratie
  • Windows benchmarks
3DMark - Fire Strike 13.912
Testconfiguratie
  • Windows benchmarks
3DMark - Fire Strike Graphics 15.732
Testconfiguratie
  • Windows benchmarks
3DMark - Fire Strike Physics 14.376
Testconfiguratie
  • Windows benchmarks
3DMark - Fire Strike Combined 7.261
Testconfiguratie
  • Windows benchmarks
3DMark - Fire Strike Extreme 7.835
Testconfiguratie
  • Windows benchmarks
3DMark - Time Spy 5.731
Testconfiguratie
  • Windows benchmarks
3DMark - Time Spy Graphics 5.747
Testconfiguratie
  • Windows benchmarks
3DMark - Time Spy CPU 5.845
Testconfiguratie
  • Windows benchmarks
Cinebench R15 - Single 174
Testconfiguratie
  • Windows benchmarks
Cinebench R15 - Multi 1.116
Testconfiguratie
  • Windows benchmarks
PCMark 8 v2 - Home 4.878
Testconfiguratie
  • Windows benchmarks
PCMark 8 v2 - Creative 5.760
Testconfiguratie
  • Windows benchmarks
PCMark 8 v2 - Work 4.104
Testconfiguratie
  • Windows benchmarks
PCMark 8 - Storage 2.0 - Storage Score 5.074
Testconfiguratie
  • Windows benchmarks
PCMark 8 - Storage 2.0 - Storage Bandwidth 512,08 MB/s
Testconfiguratie
  • Windows benchmarks
Geekbench4 - Multi 21.010
Testconfiguratie
  • Windows benchmarks
Geekbench4 - Multi crypto 14.638
Testconfiguratie
  • Windows benchmarks
Geekbench4 - Multi integer 25.733
Testconfiguratie
  • Windows benchmarks
Geekbench4 - Multi float 25.095
Testconfiguratie
  • Windows benchmarks
Geekbench4 - Multi memory 5.848
Testconfiguratie
  • Windows benchmarks
Geekbench4 - Single 5.029
Testconfiguratie
  • Windows benchmarks
Geekbench4 - Single crypto 4.507
Testconfiguratie
  • Windows benchmarks
Geekbench4 - Single integer 5.126
Testconfiguratie
  • Windows benchmarks
Geekbench4 - Single float 4.978
Testconfiguratie
  • Windows benchmarks
Geekbench4 - Single memory 5.016
Testconfiguratie
  • Windows benchmarks

Energieverbruik / Accu

Energieverbruik uit 0,8 W
Testconfiguratie
  • Windows benchmarks
Energieverbruik adapter (zonder laptop) 0,1 W
Testconfiguratie
  • Windows benchmarks
Energieverbruik idle 49,7 W
Testconfiguratie
  • Windows benchmarks
Browser accutest - 180 cd/m2 156 min.
Testconfiguratie
  • Windows benchmarks
PCMark Creative accutest - 180 cd/m2 129 min.
Testconfiguratie
  • Windows benchmarks
PCMark Creative (Accu) 4.350
Testconfiguratie
  • Windows benchmarks

Testresultaten beeldscherm

Gemeten kleurruimte sRGB
Testconfiguratie
  • Beeldscherm test SpectraCal CALman 5.13
Kleurtemperatuur 7.013 K
Testconfiguratie
  • Beeldscherm test SpectraCal CALman 5.13
Helderheid wit 319 cd/m²
Testconfiguratie
  • Beeldscherm test SpectraCal CALman 5.13
Helderheid zwart 0,25 cd/m²
Testconfiguratie
  • Beeldscherm test SpectraCal CALman 5.13
Contrast 1.274,3 : 1
Testconfiguratie
  • Beeldscherm test SpectraCal CALman 5.13
Gamma 2,24
Testconfiguratie
  • Beeldscherm test SpectraCal CALman 5.13
Gamma (afwijking van 2,2) 0,04
Testconfiguratie
  • Beeldscherm test SpectraCal CALman 5.13
Kleurafwijking rood (Delta E 1994) 2,94
Testconfiguratie
  • Beeldscherm test SpectraCal CALman 5 i.c.m. X
  • Rite i1 Display Pro colorimeter
Kleurafwijking groen (Delta E 1994) 5,15
Testconfiguratie
  • Beeldscherm test SpectraCal CALman 5 i.c.m. X
  • Rite i1 Display Pro colorimeter
Kleurafwijking blauw (Delta E 1994) 4,16
Testconfiguratie
  • Beeldscherm test SpectraCal CALman 5 i.c.m. X
  • Rite i1 Display Pro colorimeter
Kleurafwijking cyaan (Delta E 1994) 4,62
Testconfiguratie
  • Beeldscherm test SpectraCal CALman 5 i.c.m. X
  • Rite i1 Display Pro colorimeter
Kleurafwijking magenta (Delta E 1994) 4,20
Testconfiguratie
  • Beeldscherm test SpectraCal CALman 5 i.c.m. X
  • Rite i1 Display Pro colorimeter
Kleurafwijking geel (Delta E 1994) 1,83
Testconfiguratie
  • Beeldscherm test SpectraCal CALman 5 i.c.m. X
  • Rite i1 Display Pro colorimeter
Gemiddelde kleurafwijking (Delta E 1994) 3,8
Testconfiguratie
  • Beeldscherm test SpectraCal CALman 5 i.c.m. X
  • Rite i1 Display Pro colorimeter
Gemiddelde grijsafwijking (Delta E 1994) 3,9
Testconfiguratie
  • Beeldscherm test SpectraCal CALman 5 i.c.m. X
  • Rite i1 Display Pro colorimeter
Kleurafwijking 75% rood (Delta E 2000) 2,58 mΔuv
Testconfiguratie
  • Beeldscherm test SpectraCal CALman 5 i.c.m. X
  • Rite i1 Display Pro colorimeter
Kleurafwijking 75% groen (Delta E 2000) 4,33 mΔuv
Testconfiguratie
  • Beeldscherm test SpectraCal CALman 5 i.c.m. X
  • Rite i1 Display Pro colorimeter
Kleurafwijking 75% blauw (Delta E 2000) 4,37 mΔuv
Testconfiguratie
  • Beeldscherm test SpectraCal CALman 5 i.c.m. X
  • Rite i1 Display Pro colorimeter
Kleurafwijking 75% cyaan (Delta E 2000) 4,86 mΔuv
Testconfiguratie
  • Beeldscherm test SpectraCal CALman 5 i.c.m. X
  • Rite i1 Display Pro colorimeter
Kleurafwijking 75% magenta (Delta E 2000) 3,86 mΔuv
Testconfiguratie
  • Beeldscherm test SpectraCal CALman 5 i.c.m. X
  • Rite i1 Display Pro colorimeter
Kleurafwijking 75% geel (Delta E 2000) 1,76 mΔuv
Testconfiguratie
  • Beeldscherm test SpectraCal CALman 5 i.c.m. X
  • Rite i1 Display Pro colorimeter
Gemiddelde kleurafwijking excl. wit (Delta E 2000) 3,6
Testconfiguratie
  • Beeldscherm test SpectraCal CALman 5 i.c.m. X
  • Rite i1 Display Pro colorimeter
Gemiddelde grijsafwijking (Delta E 2000) 4,2 mΔuv
Testconfiguratie
  • Beeldscherm test SpectraCal CALman 5.13
Reactietijd 0%-100% 4,7 ms
Testconfiguratie
  • Beeldscherm test SpectraCal CALman 5.13
Reactietijd 100%-0% 4 ms
Testconfiguratie
  • Beeldscherm test SpectraCal CALman 5.13
Reactietijd 20%-80% 7,5 ms
Testconfiguratie
  • Beeldscherm test SpectraCal CALman 5.13
Reactietijd 80%-20% 5,5 ms
Testconfiguratie
  • Beeldscherm test SpectraCal CALman 5.13

Windows Game Benchmarks 2018

Far Cry 5 - 1920x1080 - Medium 106 fps
Testconfiguratie
  • Windows Game Benchmarks 2018
Far Cry 5 - 1920x1080 - Ultra 89 fps
Testconfiguratie
  • Windows Game Benchmarks 2018
Far Cry 5 - 3840x2160 - Medium 39 fps
Testconfiguratie
  • Windows Game Benchmarks 2018
Far Cry 5 - 3840x2160 - Ultra 33 fps
Testconfiguratie
  • Windows Game Benchmarks 2018
GTA V - 1920x1080 - Medium 112 fps
Testconfiguratie
  • Windows Game Benchmarks 2018
GTA V - 1920x1080 - Ultra 81,7 fps
Testconfiguratie
  • Windows Game Benchmarks 2018
GTA V - 3840x2160 - Medium 66,2 fps
Testconfiguratie
  • Windows Game Benchmarks 2018
GTA V - 3840x2160 - Ultra 35,5 fps
Testconfiguratie
  • Windows Game Benchmarks 2018
Rise of the Tomb Raider - 1920x1080 - Medium 142,9 fps
Testconfiguratie
  • Windows Game Benchmarks 2018
Rise of the Tomb Raider - 1920x1080 - Ultra 96,4 fps
Testconfiguratie
  • Windows Game Benchmarks 2018
Rise of the Tomb Raider - 3840x2160 - Medium 50,4 fps
Testconfiguratie
  • Windows Game Benchmarks 2018
Rise of the Tomb Raider - 3840x2160 - Ultra 32,2 fps
Testconfiguratie
  • Windows Game Benchmarks 2018
0