
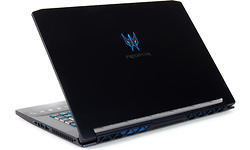
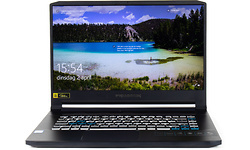
Acer Predator Triton 500 PT515-51-7618


Dit product is niet (meer) verkrijgbaar bij de bij Hardware Info aangesloten shops.
| Processor serie | Intel Core i7 |
| Processor type | Intel Core i7 8750H |
| Processor klokfrequentie | 2,2 GHz |
| Processor klokfrequentie (max. turbo) | 4,1 GHz |
| Configureerbare TDP-down | 35 W |
| Configureerbare TDP-downfrequentie | 2 GHz |
| Aantal processorcores | 6 |
| Geheugen capaciteit | 16 GB |
| Type geheugen | DDR4 |
| Geheugen klokfrequentie | 2.667 MHz |
| Geheugen form factor | Sodimm |
| SODIMM sloten | 2 |
| Werkgeheugen uitbreidbaar tot | 32 GB |
| Scherm diagonaal | 15,6 inch |
| Resolutie | 1920x1080 |
| Verhouding | 16:9 |
| Pixeldichtheid | 141 ppi |
| Scherm type (mat/glans) | Mat |
| Paneeltype | IPS |
| LED-achtergrondverlichting | |
| Touchscreen | |
| Geschikt voor peninvoer | |
| 3D-scherm | |
| Maximale verversingsfrequentie | 144 Hz |
| GPU type | Nvidia GeForce RTX 2060 |
| Geïntegreerde / losse GPU | Losse chip |
| Videogeheugen | 6 GB |
| Totale opslagcapaciteit | 1.024 GB |
| SSD opslagcapaciteit | 1.024 GB |
| Harddisk opslagcapaciteit | 0 GB |
| Harddisk toerental | 0 rpm |
| Beschikbaar opslaggeheugen | 908,7 GB |
| Aantal harddisks / SSD's | 2 |
| Harddisk/SSD 1 capaciteit | 1.024 GB |
| Harddisk/SSD 1 soort | SSD/Flash |
| Harddisk/SSD 1 merk/product | 2x WDC PC SN720 SDAPNTW-512G-1014 RAID 0 |
| DVD branden | |
| Blu-ray lezen | |
| Blu-ray branden |
| Netwerkaansluiting (bedraad) | |
| Netwerkadapter (bedraad) | Killer E3000 2.5 Gigabit Ethernet Controller |
| Netwerksnelheid (bedraad) | 2500 Mbit/s |
| WiFi standaard | 802.11ac (Wi-Fi 5) |
| WiFi adapter | Killer Wireless-AC 1550i Wireless Network Adapter (9560NGW) |
| Bluetooth | |
| Bluetooth-versie | Bluetooth 5.0 |
| 3G (HSPA/UMTS) | |
| 4G (LTE) |
| Smartcard | |
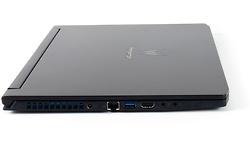
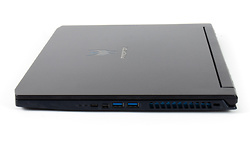
| USB 3.2 - 5 Gb/s (Type-A) | 3 |
| Thunderbolt 3 (Type-C) | 1 |
| Cardreader - SD | |
| Cardreader - MicroSD | |
| DVI-uitgang | |
| VGA-uitgang | |
| HDMI-uitgang | |
| Aantal HDMI-uitgangen | 1 |
| Micro HDMI-uitgang | |
| HDMI-versie | 2.0 |
| DisplayPort-uitgang | |
| Mini DisplayPort-uitgang | |
| Aantal mini DisplayPort-uitgangen | 1 |
| Analoge audio aansluitingen | 1 |
| Aansluiting dockingstation | |
| Kensingtonslot |
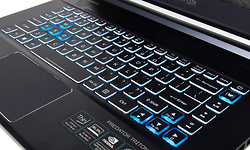
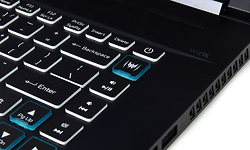
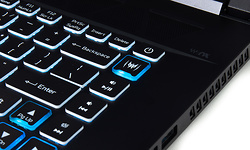
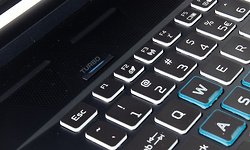
| Toetsenbordindeling | Qwerty |
| Numeriek toetsenbord |
| Webcam | |
| Webcam resolutie | 0,9 MPixel |
| Tweede camera | |
| Flitser |
| Accelerometer | |
| Vingerafdruklezer | |
| GPS | |
| Kompas | |
| NFC |
| Trusted Platform Module (TPM) | |
| Geïntegreerde microfoon |
| Accu capaciteit (mAh) | 5.500 mAh |
| Accu capaciteit (Wh) | 84,36 Wh |
| Verwisselbare accu | |
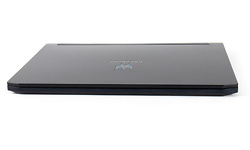
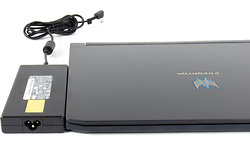
| Gewicht totaal | 2,16 kg |
| Afmeting - Breedte | 35,9 cm |
| Afmeting - Diepte | 25,7 cm |
| Afmeting - Hoogte/Dikte | 2,3 cm |
| Besturingssysteem | Microsoft Windows 10 Home |
| Besturingssysteem (serie) | Windows |
| Aantal bits OS | 64 bit |
| Garantie | 1 jaar |
| SKU | NH.Q50EH.003 | |
| EAN | 4710180129991 | |
| Toegevoegd aan Hardware Info | maandag 11 maart 2019 |
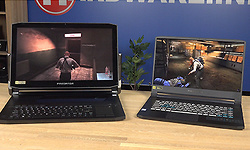
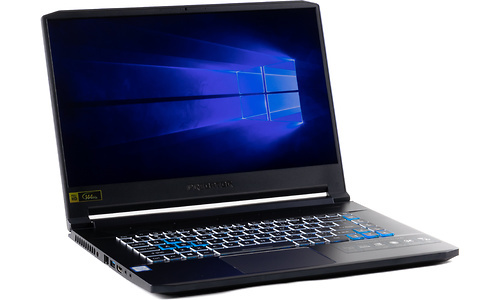
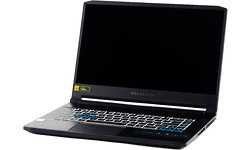
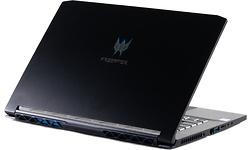
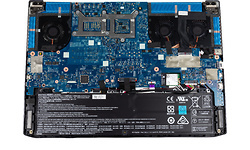
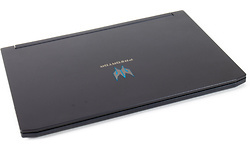
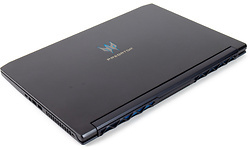
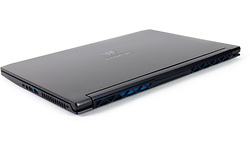
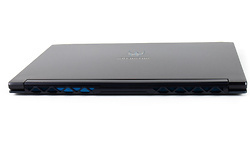
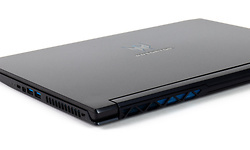
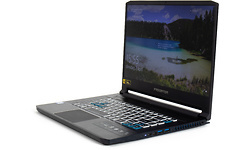
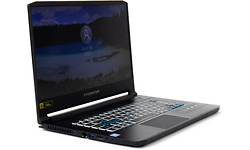
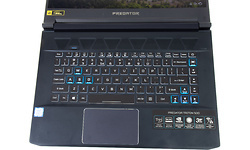
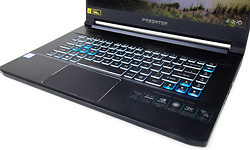
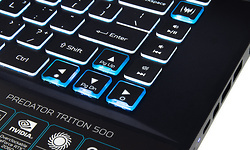
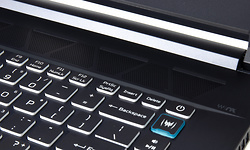
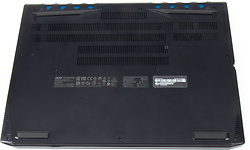
De Acer Predator Triton 500 is een fraaie, relatief dunne en lichte gaminglaptop die het moet opnemen tegen machines als de Asus Zephyrus S en de MSI Stealth GS65, of de Lenovo Legion Y740. Acer introduceert binnenkort bovendien ook de Triton 900, een veel grotere gaming laptop met een ultra hd beeldscherm en - in de uiteindelijke uitvoering - met een negende generatie Intel Core processor. Wij testen de Triton 500 en een pre-productiemodel van de Triton 900 en vertellen je over onze bevindingen.
10 april 2019 19:01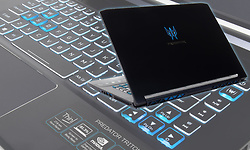
De Acer Triton 500 weegt 2,1 kilo schoon aan de haak en bevat toch razendsnelle componenten. Is dit de ideale lichtgewicht gaming notebook?
9 april 2019 08:22
