Getest

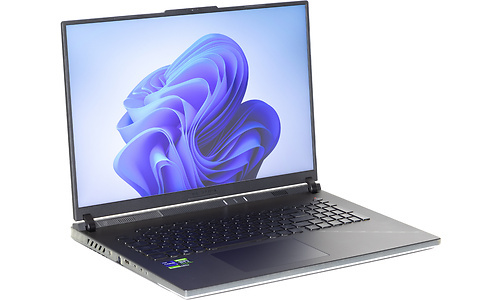
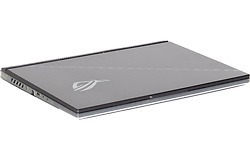
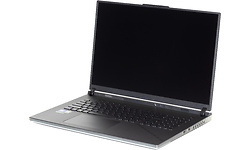
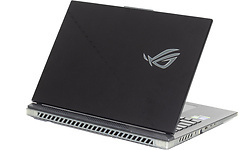
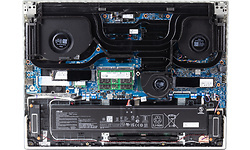
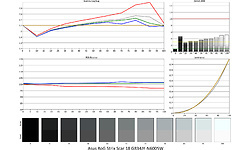
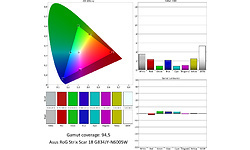
Asus RoG Strix Scar 18 G834JY-N6005W

Prijsverloop

Specificaties

Belangrijkste specificaties

Processor type Intel Core i9 13980HX
Geheugen capaciteit 32 GB
Scherm diagonaal 18 inch
Resolutie 2560x1600
Touchscreen
GPU type Nvidia GeForce RTX 4090 Laptop GPU
Totale opslagcapaciteit 2.048 GB
Toetsenbordindeling Qwerty
Gewicht totaal 3,10 kg
Besturingssysteem (serie) Windows

Processor / Chipset / Geheugen

Processor serie Intel Core i9
Processor type Intel Core i9 13980HX
Processor klokfrequentie 2,2 GHz
Processor klokfrequentie (max. turbo) 5,6 GHz
Configureerbare TDP-down 45 W
Configureerbare TDP-up 157 W
Configureerbare TDP-downfrequentie 2 GHz
Configureerbare TDP-upfrequentie 6 GHz
Aantal processorcores 24
Geheugen capaciteit 32 GB
Type geheugen DDR5
Geheugen klokfrequentie 4.800 MHz
Geheugen form factor Sodimm
SODIMM sloten 2
Vrije SODIMM sloten 0
Werkgeheugen uitbreidbaar tot 64 GB

Scherm

Scherm diagonaal 18 inch
Resolutie 2560x1600
Verhouding 16:10
Pixeldichtheid 168 ppi
Scherm type (mat/glans) Mat
Paneeltype IPS
Touchscreen
Maximale verversingsfrequentie 240 Hz

Graphics

GPU type Nvidia GeForce RTX 4090 Laptop GPU
Geïntegreerde / losse GPU Losse chip
Videogeheugen 16 GB

Opslag

Totale opslagcapaciteit 2.048 GB
SSD opslagcapaciteit 2.048 GB
Beschikbaar opslaggeheugen 1.815,3 GB
Aantal harddisks / SSD's 2
Harddisk/SSD 1 capaciteit 1.024 GB
Harddisk/SSD 1 soort SSD/Flash
Harddisk/SSD 1 form factor M.2
Harddisk/SSD 2 capaciteit 1.024 GB
Harddisk/SSD 2 soort SSD
Harddisk/SSD 2 merk/product NVMe SAMSUNG MZVL21T0HCLR-00B00
DVD branden
Blu-ray lezen
Blu-ray branden

Connectiviteit / Netwerk

Netwerkaansluiting (bedraad)
Netwerkadapter (bedraad) Realtek Gaming 2.5GbE Family Controller
Netwerksnelheid (bedraad) 2500 Mbit/s
WiFi standaard 802.11ax (Wi-Fi 6E)
WiFi adapter Intel(R) Wi-Fi 6E AX211 160Mhz
Bluetooth
Bluetooth-versie Bluetooth 5.2
4G (LTE)
5G

Aansluitingen

Smartcard
USB 3.2 - 10 Gb/s (Type-A) 2
USB 3.2 - 10 Gb/s (Type-C) 1
Thunderbolt 4 (Type-C) 1
Cardreader - SD
Cardreader - MicroSD
DVI-uitgang
VGA-uitgang
HDMI-uitgang
Aantal HDMI-uitgangen 1
Micro HDMI-uitgang
HDMI-versie 2.1
DisplayPort-uitgang
Mini DisplayPort-uitgang
Analoge audio aansluitingen 1
Aansluiting dockingstation
Kensingtonslot

Toetsenbord en touchpad

Toetsenbordindeling Qwerty
Numeriek toetsenbord
Toetsenbordverlichting helderheidsniveaus 3
Toetsenbordverlichting kleur RGB
Touchpad afzonderlijke muistoetsen

Camera

Webcam
Webcam resolutie 0,9 MPixel
Tweede camera
Flitser
Camera Windows Hello compatible
Webcamschuifje

Sensors

Accelerometer
Vingerafdruklezer
NFC

Overige hardware

Trusted Platform Module (TPM)
Geïntegreerde microfoon

Maten en gewichten

Accu capaciteit (Wh) 88,45 Wh
Verwisselbare accu
Gewicht totaal 3,10 kg
Afmeting - Breedte 41,1 cm
Afmeting - Diepte 29,4 cm
Afmeting - Hoogte/Dikte 3,6 cm
Passief gekoeld

Software

Besturingssysteem Microsoft Windows 11 Home
Besturingssysteem (serie) Windows
Windows versie 22H2
Windows OS Build 22.621,119
Aantal bits OS 64 bit

Fabrikantsopgave eigenschappen

Garantie 2 jaar

Productcodes

SKU 90NR0CG1-M002K0, G834JY-N6005W
EAN 4711387034095
Toegevoegd aan Hardware Info dinsdag 7 februari 2023

Testresultaten

Dit product is door Hardware Info getest op woensdag 15 maart 2023.

Metro Exodus

Metro Exodus - 1920x1080 - Medium 177,7 fps
Testconfiguratie
  • Game benchmarks 2022
Metro Exodus - 1920x1080 - Medium (99p) 10,8 ms
Testconfiguratie
  • Game benchmarks 2022
Metro Exodus - 1920x1080 - Medium (99.9p) 15,07 ms
Testconfiguratie
  • Game benchmarks 2022
Metro Exodus - 1920x1080 - Ultra 134,6 fps
Testconfiguratie
  • Game benchmarks 2022
Metro Exodus - 1920x1080 - Ultra (99p) 15,08 ms
Testconfiguratie
  • Game benchmarks 2022
Metro Exodus - 1920x1080 - Ultra (99.9p) 19,91 ms
Testconfiguratie
  • Game benchmarks 2022
Metro Exodus - 2560x1440 - Medium 163 fps
Testconfiguratie
  • Game benchmarks 2022
Metro Exodus - 2560x1440 - Medium (99p) 12,48 ms
Testconfiguratie
  • Game benchmarks 2022
Metro Exodus - 2560x1440 - Medium (99.9p) 16,41 ms
Testconfiguratie
  • Game benchmarks 2022
Metro Exodus - 2560x1440 - Ultra 113,8 fps
Testconfiguratie
  • Game benchmarks 2022
Metro Exodus - 2560x1440 - Ultra (99p) 17,02 ms
Testconfiguratie
  • Game benchmarks 2022
Metro Exodus - 2560x1440 - Ultra (99.9p) 21,63 ms
Testconfiguratie
  • Game benchmarks 2022
Metro Exodus - 3840x2160 - Medium 108,6 fps
Testconfiguratie
  • Game benchmarks 2022
Metro Exodus - 3840x2160 - Medium (99p) 15,32 ms
Testconfiguratie
  • Game benchmarks 2022
Metro Exodus - 3840x2160 - Medium (99.9p) 19,04 ms
Testconfiguratie
  • Game benchmarks 2022
Metro Exodus - 3840x2160 - Ultra 76,9 fps
Testconfiguratie
  • Game benchmarks 2022
Metro Exodus - 3840x2160 - Ultra (99p) 20,35 ms
Testconfiguratie
  • Game benchmarks 2022
Metro Exodus - 3840x2160 - Ultra (99.9p) 25,77 ms
Testconfiguratie
  • Game benchmarks 2022
Metro Exodus - 1920x1080 - Ultra (DXR - High) 109,7 fps
Testconfiguratie
  • Game benchmarks 2022
Metro Exodus - 1920x1080 - Ultra (DXR - High) (99p) 17,73 ms
Testconfiguratie
  • Game benchmarks 2022
Metro Exodus - 1920x1080 - Ultra (DXR - High) (99.9p) 27,2 ms
Testconfiguratie
  • Game benchmarks 2022
Metro Exodus - 2560x1440 - Ultra (DXR - High) 109,5 fps
Testconfiguratie
  • Game benchmarks 2022
Metro Exodus - 2560x1440 - Ultra (DXR - High) (99p) 17,82 ms
Testconfiguratie
  • Game benchmarks 2022
Metro Exodus - 2560x1440 - Ultra (DXR - High) (99.9p) 25,42 ms
Testconfiguratie
  • Game benchmarks 2022

Total War: Troy

Total War: Troy - 1920x1080 - Medium 355,3 fps
Testconfiguratie
  • Game benchmarks 2022
Total War: Troy - 1920x1080 - Medium (99p) 3,9 ms
Testconfiguratie
  • Game benchmarks 2022
Total War: Troy - 1920x1080 - Medium (99.9p) 4,98 ms
Testconfiguratie
  • Game benchmarks 2022
Total War: Troy - 1920x1080 - Ultra 171,6 fps
Testconfiguratie
  • Game benchmarks 2022
Total War: Troy - 1920x1080 - Ultra (99p) 7,87 ms
Testconfiguratie
  • Game benchmarks 2022
Total War: Troy - 1920x1080 - Ultra (99.9p) 10,2 ms
Testconfiguratie
  • Game benchmarks 2022
Total War: Troy - 2560x1440 - Medium 281,5 fps
Testconfiguratie
  • Game benchmarks 2022
Total War: Troy - 2560x1440 - Medium (99p) 4,55 ms
Testconfiguratie
  • Game benchmarks 2022
Total War: Troy - 2560x1440 - Medium (99.9p) 5,25 ms
Testconfiguratie
  • Game benchmarks 2022
Total War: Troy - 2560x1440 - Ultra 141 fps
Testconfiguratie
  • Game benchmarks 2022
Total War: Troy - 2560x1440 - Ultra (99p) 9,14 ms
Testconfiguratie
  • Game benchmarks 2022
Total War: Troy - 2560x1440 - Ultra (99.9p) 11,1 ms
Testconfiguratie
  • Game benchmarks 2022
Total War: Troy - 3840x2160 - Medium 167,1 fps
Testconfiguratie
  • Game benchmarks 2022
Total War: Troy - 3840x2160 - Medium (99p) 7,13 ms
Testconfiguratie
  • Game benchmarks 2022
Total War: Troy - 3840x2160 - Medium (99.9p) 8,14 ms
Testconfiguratie
  • Game benchmarks 2022
Total War: Troy - 3840x2160 - Ultra 87,4 fps
Testconfiguratie
  • Game benchmarks 2022
Total War: Troy - 3840x2160 - Ultra (99p) 14,05 ms
Testconfiguratie
  • Game benchmarks 2022
Total War: Troy - 3840x2160 - Ultra (99.9p) 15,62 ms
Testconfiguratie
  • Game benchmarks 2022

Far Cry: New Dawn

Far Cry: New Dawn - 1920x1080 - Medium 151,7 fps
Testconfiguratie
  • Game benchmarks 2022
Far Cry: New Dawn - 1920x1080 - Medium (99p) 9,61 ms
Testconfiguratie
  • Game benchmarks 2022
Far Cry: New Dawn - 1920x1080 - Medium (99.9p) 14,5 ms
Testconfiguratie
  • Game benchmarks 2022
Far Cry: New Dawn - 1920x1080 - Ultra 131,5 fps
Testconfiguratie
  • Game benchmarks 2022
Far Cry: New Dawn - 1920x1080 - Ultra (99p) 10,98 ms
Testconfiguratie
  • Game benchmarks 2022
Far Cry: New Dawn - 1920x1080 - Ultra (99.9p) 15,05 ms
Testconfiguratie
  • Game benchmarks 2022
Far Cry: New Dawn - 2560x1440 - Medium 143,8 fps
Testconfiguratie
  • Game benchmarks 2022
Far Cry: New Dawn - 2560x1440 - Medium (99p) 9,49 ms
Testconfiguratie
  • Game benchmarks 2022
Far Cry: New Dawn - 2560x1440 - Medium (99.9p) 12,3 ms
Testconfiguratie
  • Game benchmarks 2022
Far Cry: New Dawn - 2560x1440 - Ultra 118 fps
Testconfiguratie
  • Game benchmarks 2022
Far Cry: New Dawn - 2560x1440 - Ultra (99p) 14,19 ms
Testconfiguratie
  • Game benchmarks 2022
Far Cry: New Dawn - 2560x1440 - Ultra (99.9p) 17,68 ms
Testconfiguratie
  • Game benchmarks 2022
Far Cry: New Dawn - 3840x2160 - Medium 122 fps
Testconfiguratie
  • Game benchmarks 2022
Far Cry: New Dawn - 3840x2160 - Medium (99p) 10,74 ms
Testconfiguratie
  • Game benchmarks 2022
Far Cry: New Dawn - 3840x2160 - Medium (99.9p) 18,34 ms
Testconfiguratie
  • Game benchmarks 2022
Far Cry: New Dawn - 3840x2160 - Ultra 104 fps
Testconfiguratie
  • Game benchmarks 2022
Far Cry: New Dawn - 3840x2160 - Ultra (99p) 12,61 ms
Testconfiguratie
  • Game benchmarks 2022
Far Cry: New Dawn - 3840x2160 - Ultra (99.9p) 18,24 ms
Testconfiguratie
  • Game benchmarks 2022

F1 2020

F1 2020 (DX12) - 1920x1080 - Medium 295,5 fps
Testconfiguratie
  • Game benchmarks 2022
F1 2020 (DX12) - 1920x1080 - Medium (99p) 5,2 ms
Testconfiguratie
  • Game benchmarks 2022
F1 2020 (DX12) - 1920x1080 - Medium (99.9p) 11,3 ms
Testconfiguratie
  • Game benchmarks 2022
F1 2020 (DX12) - 1920x1080 - Ultra 232,1 fps
Testconfiguratie
  • Game benchmarks 2022
F1 2020 (DX12) - 1920x1080 - Ultra (99p) 6,4 ms
Testconfiguratie
  • Game benchmarks 2022
F1 2020 (DX12) - 1920x1080 - Ultra (99.9p) 14 ms
Testconfiguratie
  • Game benchmarks 2022
F1 2020 (DX12) - 2560x1440 - Medium 292,5 fps
Testconfiguratie
  • Game benchmarks 2022
F1 2020 (DX12) - 2560x1440 - Medium (99p) 5,3 ms
Testconfiguratie
  • Game benchmarks 2022
F1 2020 (DX12) - 2560x1440 - Medium (99.9p) 11,1 ms
Testconfiguratie
  • Game benchmarks 2022
F1 2020 (DX12) - 2560x1440 - Ultra 234,4 fps
Testconfiguratie
  • Game benchmarks 2022
F1 2020 (DX12) - 2560x1440 - Ultra (99p) 6,4 ms
Testconfiguratie
  • Game benchmarks 2022
F1 2020 (DX12) - 2560x1440 - Ultra (99.9p) 13 ms
Testconfiguratie
  • Game benchmarks 2022
F1 2020 (DX12) - 3840x2160 - Medium 242,6 fps
Testconfiguratie
  • Game benchmarks 2022
F1 2020 (DX12) - 3840x2160 - Medium (99p) 5,6 ms
Testconfiguratie
  • Game benchmarks 2022
F1 2020 (DX12) - 3840x2160 - Medium (99.9p) 12,8 ms
Testconfiguratie
  • Game benchmarks 2022
F1 2020 (DX12) - 3840x2160 - Ultra 167,6 fps
Testconfiguratie
  • Game benchmarks 2022
F1 2020 (DX12) - 3840x2160 - Ultra (99p) 8,1 ms
Testconfiguratie
  • Game benchmarks 2022
F1 2020 (DX12) - 3840x2160 - Ultra (99.9p) 19 ms
Testconfiguratie
  • Game benchmarks 2022

Geluidstest

Noise floor 14 dB(A)
Testconfiguratie
  • Geluidsdichte ruimte 2021
  • Larson Davis SoundAdvisor Model 831C
Afstand geluidsmeting 50 cm
Testconfiguratie
  • Geluidsdichte ruimte 2021
  • Larson Davis SoundAdvisor Model 831C
WebXPRT 3 - LAeq 21,1 dB
Testconfiguratie
  • Geluidsdichte ruimte 2021
  • Larson Davis SoundAdvisor Model 831C
PCMark 10 Express - LAeq 25,2 dB
Testconfiguratie
  • Geluidsdichte ruimte 2021
  • Larson Davis SoundAdvisor Model 831C
Blender - LAeq 48,7 dB
Testconfiguratie
  • Geluidsdichte ruimte 2021
  • Larson Davis SoundAdvisor Model 831C
F1 2020 - LAeq 48,9 dB
Testconfiguratie
  • Geluidsdichte ruimte 2021
  • Larson Davis SoundAdvisor Model 831C

PCMark 10 Storage

PCMark 10 - Gebruiken Adobe Photoshop Heavy 449
Testconfiguratie
  • Windows benchmarks
PCMark 10 - Storage - Totaalscore - Toegangstijd 111
Testconfiguratie
  • Windows benchmarks
PCMark 10 - Storage - Totaalscore - Bandbreedte 235,57
PCMark 10 - Storage - Totaalscore 1.491
Testconfiguratie
  • Windows benchmarks
PCMark 10 - 2.37GB_(399_JPEGs)_leestest 236
PCMark 10 - 2.37GB_(399_JPEGs)_kopieertest 404
Testconfiguratie
  • Windows benchmarks
PCMark 10 - 2.37GB_(399_JPEGs)_schrijftest 268
Testconfiguratie
  • Windows benchmarks
PCMark 10 - 2GB_(4_ISOs)_leestest 3.037
Testconfiguratie
  • Windows benchmarks
PCMark 10 - 2GB_(4_ISOs)_kopieertest 2.749
Testconfiguratie
  • Windows benchmarks
PCMark 10 - 2GB_(4_ISOs)_schrijftest 2.093
Testconfiguratie
  • Windows benchmarks
PCMark 10 - Gebruiken Microsoft PowerPoint 55
Testconfiguratie
  • Windows benchmarks
PCMark 10 - Gebruiken Microsoft Excel 73
Testconfiguratie
  • Windows benchmarks
PCMark 10 - Gebruiken Adobe Photoshop Light 141
Testconfiguratie
  • Windows benchmarks
PCMark 10 - Starten Windows 10 240
Testconfiguratie
  • Windows benchmarks
PCMark 10 - Gebruiken Adobe InDesign 105
Testconfiguratie
  • Windows benchmarks
PCMark 10 - Gebruiken Adobe Illustrator 110
PCMark 10 - Gebruiken Adobe After Effects 219
Testconfiguratie
  • Windows benchmarks
PCMark 10 - Starten Overwatch 217
Testconfiguratie
  • Windows benchmarks
PCMark 10 - Starten Call of Duty: Black Ops 4 429
Testconfiguratie
  • Windows benchmarks
PCMark 10 - Starten Battlefield V 462
Testconfiguratie
  • Windows benchmarks
PCMark 10 - Starten Adobe Photoshop 110
Testconfiguratie
  • Windows benchmarks
PCMark 10 - Starten Adobe Lightroom 72
Testconfiguratie
  • Windows benchmarks
PCMark 10 - Starten Adobe Premiere_Pro 127
Testconfiguratie
  • Windows benchmarks
PCMark 10 - Starten Adobe Illustrator 83
Testconfiguratie
  • Windows benchmarks
PCMark 10 - Starten Adobe After Effects 106
Testconfiguratie
  • Windows benchmarks
PCMark 10 - Starten Adobe Acrobat 125
Testconfiguratie
  • Windows benchmarks
PCMark 10 - Quick Storage - Totaalscore 1.395
Testconfiguratie
  • Windows benchmarks
PCMark 10 - Quick Storage - Totaalscore - Bandbreedte 170,76
Testconfiguratie
  • Windows benchmarks
PCMark 10 - Quick Storage - Totaalscore - Toegangstijd 92
Testconfiguratie
  • Windows benchmarks

Platform onafhankelijke tests

Opstarttijd 22,1 sec.
Testconfiguratie
  • Platform onafhankelijke tests
JetStream 2 330,001
Testconfiguratie
  • Platform onafhankelijke tests
webXPRT 3 490
Testconfiguratie
  • Platform onafhankelijke tests
webXPRT 3 - Photo Enhancement 195 ms
Testconfiguratie
  • Platform onafhankelijke tests
webXPRT 3 - Organize Album using AI 1.506 ms
Testconfiguratie
  • Platform onafhankelijke tests
webXPRT 3 - Stock Option Pricing 56 ms
Testconfiguratie
  • Platform onafhankelijke tests
webXPRT 3 - Encrypt Notes and OCR Scan 680 ms
Testconfiguratie
  • Platform onafhankelijke tests
webXPRT 3 - Sales Graphs 178 ms
Testconfiguratie
  • Platform onafhankelijke tests
webXPRT 3 - Online Homework 460 ms
Testconfiguratie
  • Platform onafhankelijke tests
Geekbench 5 - Multi 20.726
Testconfiguratie
  • Platform onafhankelijke tests
Geekbench 5 - Multi Crypto 12.156
Testconfiguratie
  • Platform onafhankelijke tests
Geekbench 5 - Multi Integer 20.258
Testconfiguratie
  • Platform onafhankelijke tests
Geekbench 5 - Multi Floating Point 23.167
Testconfiguratie
  • Platform onafhankelijke tests
Geekbench 5 - Single 2.042
Testconfiguratie
  • Platform onafhankelijke tests
Geekbench 5 - Single Crypto 4.308
Testconfiguratie
  • Platform onafhankelijke tests
Geekbench 5 - Single Integer 1.812
Testconfiguratie
  • Platform onafhankelijke tests
Geekbench 5 - Single Floating Point 2.161
Testconfiguratie
  • Platform onafhankelijke tests
Geekbench 5 - OpenCL 211.687
Testconfiguratie
  • Platform onafhankelijke tests
WiFi speedtest 2.4GHz receive 230 Mbit/s
Testconfiguratie
  • Platform onafhankelijke tests
WiFi speedtest 2.4GHz send 193 Mbit/s
Testconfiguratie
  • Platform onafhankelijke tests
WiFi speedtest 5.0GHz receive 649 Mbit/s
Testconfiguratie
  • Platform onafhankelijke tests
WiFi speedtest 5.0GHz send 681 Mbit/s
Testconfiguratie
  • Platform onafhankelijke tests

Windows benchmarks

3DMark - Fire Strike 34.967
Testconfiguratie
  • Windows benchmarks
3DMark - Fire Strike Graphics 45.728
Testconfiguratie
  • Windows benchmarks
3DMark - Fire Strike Physics 39.856
Testconfiguratie
  • Windows benchmarks
3DMark - Fire Strike Combined 11.858
Testconfiguratie
  • Windows benchmarks
3DMark - Fire Strike Extreme 23.497
Testconfiguratie
  • Windows benchmarks
3DMark - Time Spy 19.715
Testconfiguratie
  • Windows benchmarks
3DMark - Time Spy Graphics 20.678
Testconfiguratie
  • Windows benchmarks
3DMark - Time Spy CPU 15.601
Testconfiguratie
  • Windows benchmarks
3DMark - Night Raid 74.810
Testconfiguratie
  • Windows benchmarks
3DMark - Night Raid Graphics 171.780
Testconfiguratie
  • Windows benchmarks
3DMark - Night Raid CPU 17.817
Testconfiguratie
  • Windows benchmarks
Cinebench R15 - Single 298
Testconfiguratie
  • Windows benchmarks
Cinebench R15 - Multi 4.920
Testconfiguratie
  • Windows benchmarks
Cinebench R20 - Single 799
Testconfiguratie
  • Windows benchmarks
Cinebench R20 - Multi 12.075
Testconfiguratie
  • Windows benchmarks
Cinebench R23 - Single 2.081
Testconfiguratie
  • Windows benchmarks
Cinebench R23 - Multi 31.611
Testconfiguratie
  • Windows benchmarks
Blender duurtest run #1 9,45
Testconfiguratie
  • Windows benchmarks
Blender duurtest run #2 9,32
Testconfiguratie
  • Windows benchmarks
Blender duurtest run #3 9,36
Testconfiguratie
  • Windows benchmarks
Blender duurtest run #4 9,58
Testconfiguratie
  • Windows benchmarks
Blender duurtest run #5 9,78
Testconfiguratie
  • Windows benchmarks
Blender duurtest run #6 9,79
Testconfiguratie
  • Windows benchmarks
Blender duurtest run #7 9,75
Testconfiguratie
  • Windows benchmarks
Blender duurtest run #8 9,65
Testconfiguratie
  • Windows benchmarks
Blender duurtest run #9 9,71
Testconfiguratie
  • Windows benchmarks
Blender duurtest run #10 9,7
Testconfiguratie
  • Windows benchmarks
Blender duurtest run #11 9,69
Testconfiguratie
  • Windows benchmarks
Blender duurtest run #12 9,6
Testconfiguratie
  • Windows benchmarks
Blender duurtest run #13 9,71
Testconfiguratie
  • Windows benchmarks
Blender duurtest run #14 9,69
Testconfiguratie
  • Windows benchmarks
Blender duurtest run #15 9,71
Testconfiguratie
  • Windows benchmarks
Blender duurtest run #16 9,66
Testconfiguratie
  • Windows benchmarks
Blender duurtest run #17 9,72
Testconfiguratie
  • Windows benchmarks
Blender duurtest run #18 9,96
Testconfiguratie
  • Windows benchmarks
Blender duurtest run #19 9,84
Testconfiguratie
  • Windows benchmarks
Blender duurtest run #20 9,95
Testconfiguratie
  • Windows benchmarks
Blender duurtest run #21 9,93
Testconfiguratie
  • Windows benchmarks
Blender duurtest run #22 9,9
Testconfiguratie
  • Windows benchmarks
Blender duurtest run #23 9,96
Testconfiguratie
  • Windows benchmarks
Blender duurtest run #24 9,94
Testconfiguratie
  • Windows benchmarks
Blender duurtest run #25 9,82
Testconfiguratie
  • Windows benchmarks
Blender duurtest run #26 9,78
Testconfiguratie
  • Windows benchmarks
Blender duurtest run #27 9,71
Testconfiguratie
  • Windows benchmarks
Blender duurtest run #28 9,78
Testconfiguratie
  • Windows benchmarks
Blender duurtest run #29 9,76
Testconfiguratie
  • Windows benchmarks
Blender duurtest run #30 9,79
Testconfiguratie
  • Windows benchmarks
Blender duurtest run #31 9,73
Testconfiguratie
  • Windows benchmarks
Blender duurtest run #32 9,88
Testconfiguratie
  • Windows benchmarks
Blender duurtest run #33 9,68
Testconfiguratie
  • Windows benchmarks
Blender duurtest run #34 9,78
Testconfiguratie
  • Windows benchmarks
Blender duurtest run #35 9,74
Testconfiguratie
  • Windows benchmarks
Blender duurtest run #36 9,76
Testconfiguratie
  • Windows benchmarks
Blender duurtest run #37 9,83
Testconfiguratie
  • Windows benchmarks
Blender duurtest run #38 9,89
Testconfiguratie
  • Windows benchmarks
Blender duurtest run #39 9,84
Testconfiguratie
  • Windows benchmarks
Blender duurtest run #40 9,72
Testconfiguratie
  • Windows benchmarks
Blender duurtest run #41 9,82
Testconfiguratie
  • Windows benchmarks
Blender duurtest run #42 9,8
Testconfiguratie
  • Windows benchmarks
Blender duurtest run #43 9,77
Testconfiguratie
  • Windows benchmarks
Blender duurtest run #44 9,79
Testconfiguratie
  • Windows benchmarks
Blender duurtest run #45 9,81
Testconfiguratie
  • Windows benchmarks
Blender duurtest run #46 9,77
Testconfiguratie
  • Windows benchmarks
Blender duurtest run #47 9,86
Testconfiguratie
  • Windows benchmarks
Blender duurtest run #48 9,82
Testconfiguratie
  • Windows benchmarks
Blender duurtest run #49 9,79
Testconfiguratie
  • Windows benchmarks
Blender duurtest run #50 9,8
Testconfiguratie
  • Windows benchmarks
PCMark 10 Extended 12.411
Testconfiguratie
  • Windows benchmarks
PCMark 10 Essentials 11.008
Testconfiguratie
  • Windows benchmarks
PCMark 10 App Start-up 15.027
Testconfiguratie
  • Windows benchmarks
PCMark 10 Video Conferencing 8.008
Testconfiguratie
  • Windows benchmarks
PCMark 10 Web Browsing 11.085
Testconfiguratie
  • Windows benchmarks
PCMark 10 Productivity 11.968
Testconfiguratie
  • Windows benchmarks
PCMark 10 Spreadsheets 16.139
Testconfiguratie
  • Windows benchmarks
PCMark 10 Writing 8.876
Testconfiguratie
  • Windows benchmarks
PCMark 10 Digital Content Creation 16.299
Testconfiguratie
  • Windows benchmarks
PCMark 10 Photo Editing 23.964
Testconfiguratie
  • Windows benchmarks
PCMark 10 Rendering and Visualization 21.061
Testconfiguratie
  • Windows benchmarks
PCMark 10 Video Editing 8.580
Testconfiguratie
  • Windows benchmarks
PCMark 10 Gaming 29.855
Testconfiguratie
  • Windows benchmarks
PCMark 10 Graphics 46.961
Testconfiguratie
  • Windows benchmarks
PCMark 10 Physics 40.064
Testconfiguratie
  • Windows benchmarks
PCMark 10 Combined 12.166
Testconfiguratie
  • Windows benchmarks

Energieverbruik / Accu

Energieverbruik uit 1,1 W
Testconfiguratie
  • Windows benchmarks
Energieverbruik adapter (zonder laptop) 0 W
Testconfiguratie
  • Windows benchmarks
Energieverbruik idle 16,6 W
Testconfiguratie
  • Windows benchmarks
Browser accutest - 180 cd/m2 143 min.
Testconfiguratie
  • Windows benchmarks
PCMark 10 Accu Digital 4.563
Testconfiguratie
  • Windows benchmarks
PCMark 10 Accu Essentials 8.256
Testconfiguratie
  • Windows benchmarks
PCMark 10 Accu Productivity 8.196
Testconfiguratie
  • Windows benchmarks
PCMark 10 Accu Duration in Minuten 87
Testconfiguratie
  • Windows benchmarks
PCMark 10 Accu Aantal Runs 4
Testconfiguratie
  • Windows benchmarks

Testresultaten beeldscherm

Gemeten kleurruimte sRGB
Testconfiguratie
  • Beeldscherm test SpectraCal CALman 5.13
Kleurtemperatuur 6.971 K
Testconfiguratie
  • Beeldscherm test SpectraCal CALman 5.13
Helderheid wit 151 cd/m²
Testconfiguratie
  • Beeldscherm test SpectraCal CALman 5.13
Helderheid zwart 0,14 cd/m²
Testconfiguratie
  • Beeldscherm test SpectraCal CALman 5.13
Contrast 1.077,5 : 1
Testconfiguratie
  • Beeldscherm test SpectraCal CALman 5.13
Checkerboard wit 150,797 cd/m²
Testconfiguratie
  • Beeldscherm test SpectraCal CALman 5.13
Checkerboard zwart 0,404 cd/m²
Testconfiguratie
  • Beeldscherm test SpectraCal CALman 5.13
Checkerboard contrast 373 : 1
Testconfiguratie
  • Beeldscherm test SpectraCal CALman 5.13
Gamma 2,17
Testconfiguratie
  • Beeldscherm test SpectraCal CALman 5.13
Gamma (afwijking van 2,2) 0,03
Testconfiguratie
  • Beeldscherm test SpectraCal CALman 5.13
Kleurafwijking 75% wit (Delta E 2000) 8,72 mΔuv
Testconfiguratie
  • Beeldscherm test SpectraCal CALman 5 i.c.m. X
  • Rite i1 Display Pro colorimeter
Kleurafwijking 75% rood (Delta E 2000) 0,71 mΔuv
Testconfiguratie
  • Beeldscherm test SpectraCal CALman 5 i.c.m. X
  • Rite i1 Display Pro colorimeter
Kleurafwijking 75% groen (Delta E 2000) 0,34 mΔuv
Testconfiguratie
  • Beeldscherm test SpectraCal CALman 5 i.c.m. X
  • Rite i1 Display Pro colorimeter
Kleurafwijking 75% blauw (Delta E 2000) 0,65 mΔuv
Testconfiguratie
  • Beeldscherm test SpectraCal CALman 5 i.c.m. X
  • Rite i1 Display Pro colorimeter
Kleurafwijking 75% cyaan (Delta E 2000) 3,15 mΔuv
Testconfiguratie
  • Beeldscherm test SpectraCal CALman 5 i.c.m. X
  • Rite i1 Display Pro colorimeter
Kleurafwijking 75% magenta (Delta E 2000) 0,9 mΔuv
Testconfiguratie
  • Beeldscherm test SpectraCal CALman 5 i.c.m. X
  • Rite i1 Display Pro colorimeter
Kleurafwijking 75% geel (Delta E 2000) 2,45 mΔuv
Testconfiguratie
  • Beeldscherm test SpectraCal CALman 5 i.c.m. X
  • Rite i1 Display Pro colorimeter
Gemiddelde kleurafwijking (Delta E 2000) 3,3 mΔuv
Testconfiguratie
  • Beeldscherm test SpectraCal CALman 5.13
Kleurafwijking 100% wit (Delta E 2000) 9,18 mΔuv
Testconfiguratie
  • Beeldscherm test SpectraCal CALman 5 i.c.m. X
  • Rite i1 Display Pro colorimeter
Gemiddelde kleurafwijking excl. wit (Delta E 2000) 1,6
Testconfiguratie
  • Beeldscherm test SpectraCal CALman 5 i.c.m. X
  • Rite i1 Display Pro colorimeter
Gemiddelde grijsafwijking (Delta E 2000) 4,0 mΔuv
Testconfiguratie
  • Beeldscherm test SpectraCal CALman 5.13
Reactietijd 0%-100% 2,67 ms
Testconfiguratie
  • Beeldscherm test SpectraCal CALman 5.13
Reactietijd 100%-0% 3,98 ms
Testconfiguratie
  • Beeldscherm test SpectraCal CALman 5.13
Reactietijd 20%-80% 3,87 ms
Testconfiguratie
  • Beeldscherm test SpectraCal CALman 5.13
Reactietijd 80%-20% 5,34 ms
Testconfiguratie
  • Beeldscherm test SpectraCal CALman 5.13
sRGB dekking 100 %
Testconfiguratie
  • Beeldscherm test SpectraCal CALman 5.13
DCI-P3 dekking 98,3 %
Testconfiguratie
  • Beeldscherm test SpectraCal CALman 5.13
Rec 2020 dekking 70,6 %
Testconfiguratie
  • Beeldscherm test SpectraCal CALman 5.13
0