Getest

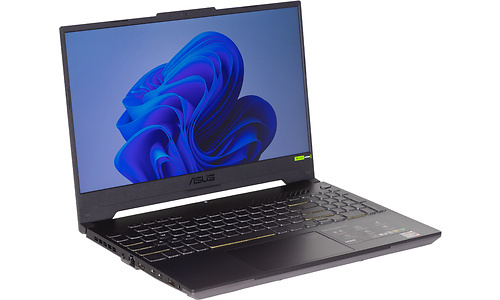
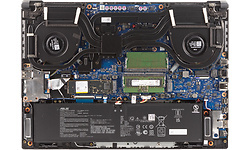
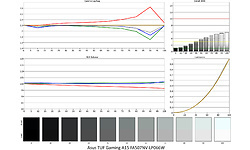
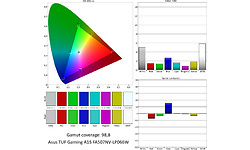
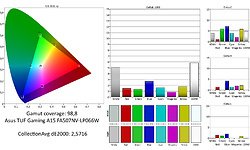
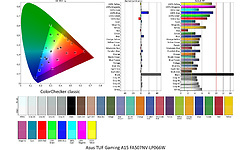
Asus TUF Gaming A15 FA507NV-LP066W

Prijsverloop

Specificaties

Belangrijkste specificaties

Processor type AMD Ryzen 7 7735HS
Geheugen capaciteit 16 GB
Scherm diagonaal 15,6 inch
Resolutie 1920x1080
Touchscreen
GPU type Nvidia GeForce RTX 4060 Laptop GPU
Totale opslagcapaciteit 512 GB
Toetsenbordindeling Qwerty
Gewicht totaal 2,10 kg
Besturingssysteem (serie) Windows

Processor / Chipset / Geheugen

Processor serie AMD Ryzen 7
Processor type AMD Ryzen 7 7735HS
Processor klokfrequentie 3,2 GHz
Processor klokfrequentie (max. turbo) 4,75 GHz
Configureerbare TDP-down 35 W
Configureerbare TDP-up 54 W
Aantal processorcores 8
Geheugen capaciteit 16 GB
Type geheugen DDR5
Geheugen klokfrequentie 4.800 MHz
Geheugen form factor Sodimm
SODIMM sloten 2
Vrije SODIMM sloten 0
Werkgeheugen uitbreidbaar tot 32 GB

Scherm

Scherm diagonaal 15,6 inch
Resolutie 1920x1080
Verhouding 16:9
Pixeldichtheid 141 ppi
Scherm type (mat/glans) Mat
Paneeltype IPS
Touchscreen
Maximale verversingsfrequentie 144 Hz

Graphics

GPU type Nvidia GeForce RTX 4060 Laptop GPU
Geïntegreerde / losse GPU Losse chip
Videogeheugen 8 GB

Opslag

Totale opslagcapaciteit 512 GB
SSD opslagcapaciteit 512 GB
Beschikbaar opslaggeheugen 398,2 GB
Aantal harddisks / SSD's 1
Harddisk/SSD 1 capaciteit 398,2 GB
Harddisk/SSD 1 soort SSD/Flash
Harddisk/SSD 1 form factor M.2
Harddisk/SSD 1 merk/product Micron_2400_MTFDKBA512QFM
DVD branden
Blu-ray lezen
Blu-ray branden

Connectiviteit / Netwerk

Netwerkaansluiting (bedraad)
Netwerkadapter (bedraad) Realtek PCIe GBE Family Controller
Netwerksnelheid (bedraad) 1000 Mbit/s
WiFi standaard 802.11ax (Wi-Fi 6)
WiFi adapter Realtek 8852BE Wireless LAN WiFi 6 PCI-E NIC
Bluetooth
Bluetooth-versie Bluetooth 5.2
4G (LTE)
5G

Aansluitingen

Smartcard
USB 3.2 - 5 Gb/s (Type-A) 2
USB 3.2 - 10 Gb/s (Type-C) 1
USB 4.0 - 40 Gb/s (Type-C) 1,0
Cardreader - SD
Cardreader - MicroSD
DVI-uitgang
VGA-uitgang
HDMI-uitgang
Aantal HDMI-uitgangen 1
Micro HDMI-uitgang
HDMI-versie 2.1
DisplayPort-uitgang
Mini DisplayPort-uitgang
Analoge audio aansluitingen 1
Aansluiting dockingstation
Kensingtonslot

Toetsenbord en touchpad

Toetsenbordindeling Qwerty
Numeriek toetsenbord
Toetsenbordverlichting helderheidsniveaus 3
Toetsenbordverlichting kleur RGB
Touchpad afzonderlijke muistoetsen

Camera

Webcam
Webcam resolutie 0,9 MPixel
Tweede camera
Flitser
Camera Windows Hello compatible
Webcamschuifje

Sensors

Accelerometer
Vingerafdruklezer
NFC

Overige hardware

Trusted Platform Module (TPM)
Geïntegreerde microfoon

Maten en gewichten

Accu capaciteit (Wh) 90 Wh
Verwisselbare accu
Gewicht totaal 2,10 kg
Afmeting - Breedte 35,5 cm
Afmeting - Diepte 25,5 cm
Afmeting - Hoogte/Dikte 2,49 cm
Passief gekoeld

Software

Besturingssysteem Microsoft Windows 11 Home
Besturingssysteem (serie) Windows
Windows versie 22H2
Windows OS Build 22.621,213
Aantal bits OS 64 bit

Fabrikantsopgave eigenschappen

Garantie 2 jaar

Platform onafhankelijke tests

Geekbench 6.1.0 - Multi 10.249
Geekbench 6.1.0 - Multi Integer 9.167
Geekbench 6.1.0 - Multi Floating Point 12.609
Geekbench 6.1.0 - Single 2.089
Geekbench 6.1.0 - Single Integer 1.927
Geekbench 6.1.0 - Single Floating Point 2.428
Geekbench 6.1.0 - Compute 96.002

Productcodes

SKU 90NR0E88-M00550
EAN 4711387135051
Toegevoegd aan Hardware Info woensdag 12 juli 2023

Testresultaten

Dit product is door Hardware Info getest op maandag 14 augustus 2023.

Metro Exodus

Metro Exodus - 1920x1080 - Medium 119,1 fps
Testconfiguratie
  • Game benchmarks 2022
Metro Exodus - 1920x1080 - Medium (99p) 19,65 ms
Testconfiguratie
  • Game benchmarks 2022
Metro Exodus - 1920x1080 - Medium (99.9p) 22,76 ms
Testconfiguratie
  • Game benchmarks 2022
Metro Exodus - 1920x1080 - Ultra 76,7 fps
Testconfiguratie
  • Game benchmarks 2022
Metro Exodus - 1920x1080 - Ultra (99p) 25,27 ms
Testconfiguratie
  • Game benchmarks 2022
Metro Exodus - 1920x1080 - Ultra (99.9p) 28,64 ms
Testconfiguratie
  • Game benchmarks 2022
Metro Exodus - 2560x1440 - Medium 93,2 fps
Testconfiguratie
  • Game benchmarks 2022
Metro Exodus - 2560x1440 - Medium (99p) 22 ms
Testconfiguratie
  • Game benchmarks 2022
Metro Exodus - 2560x1440 - Medium (99.9p) 27,61 ms
Testconfiguratie
  • Game benchmarks 2022
Metro Exodus - 2560x1440 - Ultra 61,7 fps
Testconfiguratie
  • Game benchmarks 2022
Metro Exodus - 2560x1440 - Ultra (99p) 29,12 ms
Testconfiguratie
  • Game benchmarks 2022
Metro Exodus - 2560x1440 - Ultra (99.9p) 34,15 ms
Testconfiguratie
  • Game benchmarks 2022
Metro Exodus - 3840x2160 - Medium 54,4 fps
Testconfiguratie
  • Game benchmarks 2022
Metro Exodus - 3840x2160 - Medium (99p) 30,42 ms
Testconfiguratie
  • Game benchmarks 2022
Metro Exodus - 3840x2160 - Medium (99.9p) 33,39 ms
Testconfiguratie
  • Game benchmarks 2022
Metro Exodus - 3840x2160 - Ultra 29,5 fps
Testconfiguratie
  • Game benchmarks 2022
Metro Exodus - 3840x2160 - Ultra (99p) 43,58 ms
Testconfiguratie
  • Game benchmarks 2022
Metro Exodus - 3840x2160 - Ultra (99.9p) 62,73 ms
Testconfiguratie
  • Game benchmarks 2022
Metro Exodus - 1920x1080 - Ultra (DXR - High) 65,4 fps
Testconfiguratie
  • Game benchmarks 2022
Metro Exodus - 1920x1080 - Ultra (DXR - High) (99p) 29,81 ms
Testconfiguratie
  • Game benchmarks 2022
Metro Exodus - 1920x1080 - Ultra (DXR - High) (99.9p) 37 ms
Testconfiguratie
  • Game benchmarks 2022
Metro Exodus - 2560x1440 - Ultra (DXR - High) 48,2 fps
Testconfiguratie
  • Game benchmarks 2022
Metro Exodus - 2560x1440 - Ultra (DXR - High) (99p) 35,91 ms
Testconfiguratie
  • Game benchmarks 2022
Metro Exodus - 2560x1440 - Ultra (DXR - High) (99.9p) 49,95 ms
Testconfiguratie
  • Game benchmarks 2022

Total War: Troy

Total War: Troy - 1920x1080 - Medium 204 fps
Testconfiguratie
  • Game benchmarks 2022
Total War: Troy - 1920x1080 - Medium (99p) 6,27 ms
Testconfiguratie
  • Game benchmarks 2022
Total War: Troy - 1920x1080 - Medium (99.9p) 7,16 ms
Testconfiguratie
  • Game benchmarks 2022
Total War: Troy - 1920x1080 - Ultra 99,6 fps
Testconfiguratie
  • Game benchmarks 2022
Total War: Troy - 1920x1080 - Ultra (99p) 13,71 ms
Testconfiguratie
  • Game benchmarks 2022
Total War: Troy - 1920x1080 - Ultra (99.9p) 15,45 ms
Testconfiguratie
  • Game benchmarks 2022
Total War: Troy - 2560x1440 - Medium 146,5 fps
Testconfiguratie
  • Game benchmarks 2022
Total War: Troy - 2560x1440 - Medium (99p) 8 ms
Testconfiguratie
  • Game benchmarks 2022
Total War: Troy - 2560x1440 - Medium (99.9p) 8,29 ms
Testconfiguratie
  • Game benchmarks 2022
Total War: Troy - 2560x1440 - Ultra 76,2 fps
Testconfiguratie
  • Game benchmarks 2022
Total War: Troy - 2560x1440 - Ultra (99p) 16,53 ms
Testconfiguratie
  • Game benchmarks 2022
Total War: Troy - 2560x1440 - Ultra (99.9p) 19,11 ms
Testconfiguratie
  • Game benchmarks 2022
Total War: Troy - 3840x2160 - Medium 76,9 fps
Testconfiguratie
  • Game benchmarks 2022
Total War: Troy - 3840x2160 - Medium (99p) 14,82 ms
Testconfiguratie
  • Game benchmarks 2022
Total War: Troy - 3840x2160 - Medium (99.9p) 15,21 ms
Testconfiguratie
  • Game benchmarks 2022
Total War: Troy - 3840x2160 - Ultra 42,1 fps
Testconfiguratie
  • Game benchmarks 2022
Total War: Troy - 3840x2160 - Ultra (99p) 28,86 ms
Testconfiguratie
  • Game benchmarks 2022
Total War: Troy - 3840x2160 - Ultra (99.9p) 31,18 ms
Testconfiguratie
  • Game benchmarks 2022

Far Cry: New Dawn

Far Cry: New Dawn - 1920x1080 - Medium 105,9 fps
Testconfiguratie
  • Game benchmarks 2022
Far Cry: New Dawn - 1920x1080 - Medium (99p) 13,38 ms
Testconfiguratie
  • Game benchmarks 2022
Far Cry: New Dawn - 1920x1080 - Medium (99.9p) 18,3 ms
Testconfiguratie
  • Game benchmarks 2022
Far Cry: New Dawn - 1920x1080 - Ultra 90,4 fps
Testconfiguratie
  • Game benchmarks 2022
Far Cry: New Dawn - 1920x1080 - Ultra (99p) 15,82 ms
Testconfiguratie
  • Game benchmarks 2022
Far Cry: New Dawn - 1920x1080 - Ultra (99.9p) 17,75 ms
Testconfiguratie
  • Game benchmarks 2022
Far Cry: New Dawn - 2560x1440 - Medium 98,6 fps
Testconfiguratie
  • Game benchmarks 2022
Far Cry: New Dawn - 2560x1440 - Medium (99p) 13,94 ms
Testconfiguratie
  • Game benchmarks 2022
Far Cry: New Dawn - 2560x1440 - Medium (99.9p) 16,82 ms
Testconfiguratie
  • Game benchmarks 2022
Far Cry: New Dawn - 2560x1440 - Ultra 85,6 fps
Testconfiguratie
  • Game benchmarks 2022
Far Cry: New Dawn - 2560x1440 - Ultra (99p) 16,16 ms
Testconfiguratie
  • Game benchmarks 2022
Far Cry: New Dawn - 2560x1440 - Ultra (99.9p) 22,48 ms
Testconfiguratie
  • Game benchmarks 2022
Far Cry: New Dawn - 3840x2160 - Medium 64,4 fps
Testconfiguratie
  • Game benchmarks 2022
Far Cry: New Dawn - 3840x2160 - Medium (99p) 20,1 ms
Testconfiguratie
  • Game benchmarks 2022
Far Cry: New Dawn - 3840x2160 - Medium (99.9p) 22,92 ms
Testconfiguratie
  • Game benchmarks 2022
Far Cry: New Dawn - 3840x2160 - Ultra 55,4 fps
Testconfiguratie
  • Game benchmarks 2022
Far Cry: New Dawn - 3840x2160 - Ultra (99p) 22,73 ms
Testconfiguratie
  • Game benchmarks 2022
Far Cry: New Dawn - 3840x2160 - Ultra (99.9p) 25 ms
Testconfiguratie
  • Game benchmarks 2022

F1 2020

F1 2020 (DX12) - 1920x1080 - Medium 198,2 fps
Testconfiguratie
  • Game benchmarks 2022
F1 2020 (DX12) - 1920x1080 - Medium (99p) 7,8 ms
Testconfiguratie
  • Game benchmarks 2022
F1 2020 (DX12) - 1920x1080 - Medium (99.9p) 10,5 ms
Testconfiguratie
  • Game benchmarks 2022
F1 2020 (DX12) - 1920x1080 - Ultra 169 fps
Testconfiguratie
  • Game benchmarks 2022
F1 2020 (DX12) - 1920x1080 - Ultra (99p) 8,7 ms
Testconfiguratie
  • Game benchmarks 2022
F1 2020 (DX12) - 1920x1080 - Ultra (99.9p) 11,1 ms
Testconfiguratie
  • Game benchmarks 2022
F1 2020 (DX12) - 2560x1440 - Medium 198,2 fps
Testconfiguratie
  • Game benchmarks 2022
F1 2020 (DX12) - 2560x1440 - Medium (99p) 7,7 ms
Testconfiguratie
  • Game benchmarks 2022
F1 2020 (DX12) - 2560x1440 - Medium (99.9p) 10,5 ms
Testconfiguratie
  • Game benchmarks 2022
F1 2020 (DX12) - 2560x1440 - Ultra 147,6 fps
Testconfiguratie
  • Game benchmarks 2022
F1 2020 (DX12) - 2560x1440 - Ultra (99p) 9,2 ms
Testconfiguratie
  • Game benchmarks 2022
F1 2020 (DX12) - 2560x1440 - Ultra (99.9p) 13,8 ms
Testconfiguratie
  • Game benchmarks 2022
F1 2020 (DX12) - 3840x2160 - Medium 120,9 fps
Testconfiguratie
  • Game benchmarks 2022
F1 2020 (DX12) - 3840x2160 - Medium (99p) 9,9 ms
Testconfiguratie
  • Game benchmarks 2022
F1 2020 (DX12) - 3840x2160 - Medium (99.9p) 13,7 ms
Testconfiguratie
  • Game benchmarks 2022
F1 2020 (DX12) - 3840x2160 - Ultra 83,7 fps
Testconfiguratie
  • Game benchmarks 2022
F1 2020 (DX12) - 3840x2160 - Ultra (99p) 14,7 ms
Testconfiguratie
  • Game benchmarks 2022
F1 2020 (DX12) - 3840x2160 - Ultra (99.9p) 26,6 ms
Testconfiguratie
  • Game benchmarks 2022

Geluidstest

Noise floor 14 dB(A)
Testconfiguratie
  • Geluidsdichte ruimte 2021
  • Larson Davis SoundAdvisor Model 831C
Afstand geluidsmeting 50 cm
Testconfiguratie
  • Geluidsdichte ruimte 2021
  • Larson Davis SoundAdvisor Model 831C
WebXPRT 3 - LAeq 19,4 dB
Testconfiguratie
  • Geluidsdichte ruimte 2021
  • Larson Davis SoundAdvisor Model 831C
PCMark 10 Express - LAeq 25,9 dB
Testconfiguratie
  • Geluidsdichte ruimte 2021
  • Larson Davis SoundAdvisor Model 831C
Blender - LAeq 49,8 dB
Testconfiguratie
  • Geluidsdichte ruimte 2021
  • Larson Davis SoundAdvisor Model 831C
F1 2020 - LAeq 50,8 dB
Testconfiguratie
  • Geluidsdichte ruimte 2021
  • Larson Davis SoundAdvisor Model 831C

PCMark 10 Storage

PCMark 10 - Gebruiken Adobe Photoshop Heavy 393
Testconfiguratie
  • Windows benchmarks
PCMark 10 - Storage - Totaalscore - Toegangstijd 116
Testconfiguratie
  • Windows benchmarks
PCMark 10 - Storage - Totaalscore - Bandbreedte 227,51
PCMark 10 - Storage - Totaalscore 1.434
Testconfiguratie
  • Windows benchmarks
PCMark 10 - 2.37GB_(399_JPEGs)_leestest 300
PCMark 10 - 2.37GB_(399_JPEGs)_kopieertest 376
Testconfiguratie
  • Windows benchmarks
PCMark 10 - 2.37GB_(399_JPEGs)_schrijftest 287
Testconfiguratie
  • Windows benchmarks
PCMark 10 - 2GB_(4_ISOs)_leestest 1.817
Testconfiguratie
  • Windows benchmarks
PCMark 10 - 2GB_(4_ISOs)_kopieertest 435
Testconfiguratie
  • Windows benchmarks
PCMark 10 - 2GB_(4_ISOs)_schrijftest 1.028
Testconfiguratie
  • Windows benchmarks
PCMark 10 - Gebruiken Microsoft PowerPoint 70
Testconfiguratie
  • Windows benchmarks
PCMark 10 - Gebruiken Microsoft Excel 95
Testconfiguratie
  • Windows benchmarks
PCMark 10 - Gebruiken Adobe Photoshop Light 165
Testconfiguratie
  • Windows benchmarks
PCMark 10 - Starten Windows 10 225
Testconfiguratie
  • Windows benchmarks
PCMark 10 - Gebruiken Adobe InDesign 108
Testconfiguratie
  • Windows benchmarks
PCMark 10 - Gebruiken Adobe Illustrator 136
PCMark 10 - Gebruiken Adobe After Effects 260
Testconfiguratie
  • Windows benchmarks
PCMark 10 - Starten Overwatch 239
Testconfiguratie
  • Windows benchmarks
PCMark 10 - Starten Call of Duty: Black Ops 4 433
Testconfiguratie
  • Windows benchmarks
PCMark 10 - Starten Battlefield V 510
Testconfiguratie
  • Windows benchmarks
PCMark 10 - Starten Adobe Photoshop 120
Testconfiguratie
  • Windows benchmarks
PCMark 10 - Starten Adobe Lightroom 95
Testconfiguratie
  • Windows benchmarks
PCMark 10 - Starten Adobe Premiere_Pro 142
Testconfiguratie
  • Windows benchmarks
PCMark 10 - Starten Adobe Illustrator 108
Testconfiguratie
  • Windows benchmarks
PCMark 10 - Starten Adobe After Effects 128
Testconfiguratie
  • Windows benchmarks
PCMark 10 - Starten Adobe Acrobat 133
Testconfiguratie
  • Windows benchmarks
PCMark 10 - Quick Storage - Totaalscore 1.737
Testconfiguratie
  • Windows benchmarks
PCMark 10 - Quick Storage - Totaalscore - Bandbreedte 212,82
Testconfiguratie
  • Windows benchmarks
PCMark 10 - Quick Storage - Totaalscore - Toegangstijd 74
Testconfiguratie
  • Windows benchmarks

Platform onafhankelijke tests

Opstarttijd 18,14 sec.
Testconfiguratie
  • Platform onafhankelijke tests
JetStream 2 241,82
Testconfiguratie
  • Platform onafhankelijke tests
webXPRT 3 387
Testconfiguratie
  • Platform onafhankelijke tests
webXPRT 3 - Photo Enhancement 217 ms
Testconfiguratie
  • Platform onafhankelijke tests
webXPRT 3 - Organize Album using AI 1.672 ms
Testconfiguratie
  • Platform onafhankelijke tests
webXPRT 3 - Stock Option Pricing 76 ms
Testconfiguratie
  • Platform onafhankelijke tests
webXPRT 3 - Encrypt Notes and OCR Scan 881 ms
Testconfiguratie
  • Platform onafhankelijke tests
webXPRT 3 - Sales Graphs 218 ms
Testconfiguratie
  • Platform onafhankelijke tests
webXPRT 3 - Online Homework 711 ms
Testconfiguratie
  • Platform onafhankelijke tests
Geekbench 5 - Multi 9.573
Testconfiguratie
  • Platform onafhankelijke tests
Geekbench 5 - Multi Crypto 7.175
Testconfiguratie
  • Platform onafhankelijke tests
Geekbench 5 - Multi Integer 9.129
Testconfiguratie
  • Platform onafhankelijke tests
Geekbench 5 - Multi Floating Point 10.933
Testconfiguratie
  • Platform onafhankelijke tests
Geekbench 5 - Single 1.555
Testconfiguratie
  • Platform onafhankelijke tests
Geekbench 5 - Single Crypto 3.672
Testconfiguratie
  • Platform onafhankelijke tests
Geekbench 5 - Single Integer 1.309
Testconfiguratie
  • Platform onafhankelijke tests
Geekbench 5 - Single Floating Point 1.734
Testconfiguratie
  • Platform onafhankelijke tests
Geekbench 5 - OpenCL 104.784
Testconfiguratie
  • Platform onafhankelijke tests
WiFi speedtest 2.4GHz receive 220 Mbit/s
Testconfiguratie
  • Platform onafhankelijke tests
WiFi speedtest 2.4GHz send 205 Mbit/s
Testconfiguratie
  • Platform onafhankelijke tests
WiFi speedtest 5.0GHz receive 641 Mbit/s
Testconfiguratie
  • Platform onafhankelijke tests
WiFi speedtest 5.0GHz send 639 Mbit/s
Testconfiguratie
  • Platform onafhankelijke tests

Windows benchmarks

3DMark - Fire Strike 23.929
Testconfiguratie
  • Windows benchmarks
3DMark - Fire Strike Graphics 27.079
Testconfiguratie
  • Windows benchmarks
3DMark - Fire Strike Physics 26.214
Testconfiguratie
  • Windows benchmarks
3DMark - Fire Strike Combined 11.946
Testconfiguratie
  • Windows benchmarks
3DMark - Fire Strike Extreme 12.012
Testconfiguratie
  • Windows benchmarks
3DMark - Time Spy 10.545
Testconfiguratie
  • Windows benchmarks
3DMark - Time Spy Graphics 10.590
Testconfiguratie
  • Windows benchmarks
3DMark - Time Spy CPU 10.300
Testconfiguratie
  • Windows benchmarks
3DMark - Night Raid 56.145
Testconfiguratie
  • Windows benchmarks
3DMark - Night Raid Graphics 105.830
Testconfiguratie
  • Windows benchmarks
3DMark - Night Raid CPU 15.339
Testconfiguratie
  • Windows benchmarks
Cinebench R15 - Single 230
Testconfiguratie
  • Windows benchmarks
Cinebench R15 - Multi 2.160
Testconfiguratie
  • Windows benchmarks
Cinebench R20 - Single 576
Testconfiguratie
  • Windows benchmarks
Cinebench R20 - Multi 5.389
Testconfiguratie
  • Windows benchmarks
Cinebench R23 - Single 1.520
Testconfiguratie
  • Windows benchmarks
Cinebench R23 - Multi 13.771
Testconfiguratie
  • Windows benchmarks
Blender duurtest run #1 20,49
Testconfiguratie
  • Windows benchmarks
Blender duurtest run #2 20,75
Testconfiguratie
  • Windows benchmarks
Blender duurtest run #3 21,02
Testconfiguratie
  • Windows benchmarks
Blender duurtest run #4 21,06
Testconfiguratie
  • Windows benchmarks
Blender duurtest run #5 20,94
Testconfiguratie
  • Windows benchmarks
Blender duurtest run #6 20,98
Testconfiguratie
  • Windows benchmarks
Blender duurtest run #7 20,85
Testconfiguratie
  • Windows benchmarks
Blender duurtest run #8 20,77
Testconfiguratie
  • Windows benchmarks
Blender duurtest run #9 20,8
Testconfiguratie
  • Windows benchmarks
Blender duurtest run #10 20,94
Testconfiguratie
  • Windows benchmarks
Blender duurtest run #11 20,8
Testconfiguratie
  • Windows benchmarks
Blender duurtest run #12 20,84
Testconfiguratie
  • Windows benchmarks
Blender duurtest run #13 20,76
Testconfiguratie
  • Windows benchmarks
Blender duurtest run #14 20,76
Testconfiguratie
  • Windows benchmarks
Blender duurtest run #15 20,81
Testconfiguratie
  • Windows benchmarks
Blender duurtest run #16 20,78
Testconfiguratie
  • Windows benchmarks
Blender duurtest run #17 20,82
Testconfiguratie
  • Windows benchmarks
Blender duurtest run #18 20,8
Testconfiguratie
  • Windows benchmarks
Blender duurtest run #19 20,81
Testconfiguratie
  • Windows benchmarks
Blender duurtest run #20 20,81
Testconfiguratie
  • Windows benchmarks
Blender duurtest run #21 20,75
Testconfiguratie
  • Windows benchmarks
Blender duurtest run #22 20,85
Testconfiguratie
  • Windows benchmarks
Blender duurtest run #23 20,77
Testconfiguratie
  • Windows benchmarks
Blender duurtest run #24 20,84
Testconfiguratie
  • Windows benchmarks
Blender duurtest run #25 20,8
Testconfiguratie
  • Windows benchmarks
Blender duurtest run #26 20,8
Testconfiguratie
  • Windows benchmarks
Blender duurtest run #27 20,86
Testconfiguratie
  • Windows benchmarks
Blender duurtest run #28 20,82
Testconfiguratie
  • Windows benchmarks
Blender duurtest run #29 20,79
Testconfiguratie
  • Windows benchmarks
Blender duurtest run #30 20,86
Testconfiguratie
  • Windows benchmarks
Blender duurtest run #31 20,92
Testconfiguratie
  • Windows benchmarks
Blender duurtest run #32 20,8
Testconfiguratie
  • Windows benchmarks
Blender duurtest run #33 20,89
Testconfiguratie
  • Windows benchmarks
Blender duurtest run #34 20,9
Testconfiguratie
  • Windows benchmarks
Blender duurtest run #35 20,77
Testconfiguratie
  • Windows benchmarks
Blender duurtest run #36 20,85
Testconfiguratie
  • Windows benchmarks
Blender duurtest run #37 20,77
Testconfiguratie
  • Windows benchmarks
Blender duurtest run #38 20,87
Testconfiguratie
  • Windows benchmarks
Blender duurtest run #39 20,89
Testconfiguratie
  • Windows benchmarks
Blender duurtest run #40 20,78
Testconfiguratie
  • Windows benchmarks
Blender duurtest run #41 20,85
Testconfiguratie
  • Windows benchmarks
Blender duurtest run #42 20,8
Testconfiguratie
  • Windows benchmarks
Blender duurtest run #43 20,87
Testconfiguratie
  • Windows benchmarks
Blender duurtest run #44 20,78
Testconfiguratie
  • Windows benchmarks
Blender duurtest run #45 20,83
Testconfiguratie
  • Windows benchmarks
Blender duurtest run #46 20,99
Testconfiguratie
  • Windows benchmarks
Blender duurtest run #47 20,83
Testconfiguratie
  • Windows benchmarks
Blender duurtest run #48 20,84
Testconfiguratie
  • Windows benchmarks
Blender duurtest run #49 20,79
Testconfiguratie
  • Windows benchmarks
Blender duurtest run #50 20,75
Testconfiguratie
  • Windows benchmarks
PCMark 10 Extended 9.250
Testconfiguratie
  • Windows benchmarks
PCMark 10 Essentials 10.025
Testconfiguratie
  • Windows benchmarks
PCMark 10 App Start-up 13.491
Testconfiguratie
  • Windows benchmarks
PCMark 10 Video Conferencing 7.971
Testconfiguratie
  • Windows benchmarks
PCMark 10 Web Browsing 9.370
Testconfiguratie
  • Windows benchmarks
PCMark 10 Productivity 8.903
Testconfiguratie
  • Windows benchmarks
PCMark 10 Spreadsheets 10.601
Testconfiguratie
  • Windows benchmarks
PCMark 10 Writing 7.477
Testconfiguratie
  • Windows benchmarks
PCMark 10 Digital Content Creation 10.815
Testconfiguratie
  • Windows benchmarks
PCMark 10 Photo Editing 16.411
Testconfiguratie
  • Windows benchmarks
PCMark 10 Rendering and Visualization 12.772
Testconfiguratie
  • Windows benchmarks
PCMark 10 Video Editing 6.036
Testconfiguratie
  • Windows benchmarks
PCMark 10 Gaming 20.492
Testconfiguratie
  • Windows benchmarks
PCMark 10 Graphics 27.765
Testconfiguratie
  • Windows benchmarks
PCMark 10 Physics 26.038
Testconfiguratie
  • Windows benchmarks
PCMark 10 Combined 12.620
Testconfiguratie
  • Windows benchmarks

Energieverbruik / Accu

Energieverbruik uit 1,5 W
Testconfiguratie
  • Windows benchmarks
Energieverbruik adapter (zonder laptop) 0 W
Testconfiguratie
  • Windows benchmarks
Energieverbruik idle 34,5 W
Testconfiguratie
  • Windows benchmarks
Browser accutest - 180 cd/m2 410 min.
Testconfiguratie
  • Windows benchmarks
PCMark 10 Accu Digital 5.364
Testconfiguratie
  • Windows benchmarks
PCMark 10 Accu Essentials 7.636
Testconfiguratie
  • Windows benchmarks
PCMark 10 Accu Productivity 6.625
Testconfiguratie
  • Windows benchmarks
PCMark 10 Accu Duration in Minuten 218
Testconfiguratie
  • Windows benchmarks
PCMark 10 Accu Aantal Runs 8
Testconfiguratie
  • Windows benchmarks

Testresultaten beeldscherm

Gemeten kleurruimte sRGB
Testconfiguratie
  • Beeldscherm test SpectraCal CALman 5.13
Kleurtemperatuur 7.054 K
Testconfiguratie
  • Beeldscherm test SpectraCal CALman 5.13
Afwijking kleurtemperatuur wit van 6504K 550 K
Testconfiguratie
  • Beeldscherm test SpectraCal CALman 5.13
Gemiddelde kleurtemperatuur 6.913 K
Testconfiguratie
  • Beeldscherm test SpectraCal CALman 5.13
Afwijking gemiddelde kleurtemperatuur van 6504K 409 K
Testconfiguratie
  • Beeldscherm test SpectraCal CALman 5.13
Helderheid wit 152 cd/m²
Testconfiguratie
  • Beeldscherm test SpectraCal CALman 5.13
Helderheid zwart 0,12 cd/m²
Testconfiguratie
  • Beeldscherm test SpectraCal CALman 5.13
Contrast 1.270,0 : 1
Testconfiguratie
  • Beeldscherm test SpectraCal CALman 5.13
Checkerboard wit 314,71 cd/m²
Testconfiguratie
  • Beeldscherm test SpectraCal CALman 5.13
Checkerboard zwart 0,249 cd/m²
Testconfiguratie
  • Beeldscherm test SpectraCal CALman 5.13
Checkerboard contrast 1.264 : 1
Testconfiguratie
  • Beeldscherm test SpectraCal CALman 5.13
Gamma 2,15
Testconfiguratie
  • Beeldscherm test SpectraCal CALman 5.13
Gamma (afwijking van 2,2) 0,05
Testconfiguratie
  • Beeldscherm test SpectraCal CALman 5.13
Gemiddelde kleurafwijking (Delta E 2000) 2,6 mΔuv
Testconfiguratie
  • Beeldscherm test SpectraCal CALman 5.13
Gemiddelde kleurafwijking ΔE ITP 6,43 Δuv
Testconfiguratie
  • Beeldscherm test SpectraCal CALman 5.13
Gemiddelde gedetailleerde kleur-afwijking ΔE 2000 2,32 Δuv
Testconfiguratie
  • Beeldscherm test SpectraCal CALman 5.13
Gemiddelde gedetailleerde kleur-afwijking ΔE ITP 5,38 Δuv
Testconfiguratie
  • Beeldscherm test SpectraCal CALman 5.13
Gemiddelde grijsafwijking (Delta E 2000) 3,8 mΔuv
Testconfiguratie
  • Beeldscherm test SpectraCal CALman 5.13
Gemiddelde grijsafwijking ΔE ITP 4,64 Δuv
Testconfiguratie
  • Beeldscherm test SpectraCal CALman 5.13
sRGB dekking 98,8 %
Testconfiguratie
  • Beeldscherm test SpectraCal CALman 5.13
DCI-P3 dekking 78,1 %
Testconfiguratie
  • Beeldscherm test SpectraCal CALman 5.13
Rec 2020 dekking 56,1 %
Testconfiguratie
  • Beeldscherm test SpectraCal CALman 5.13
0