Getest

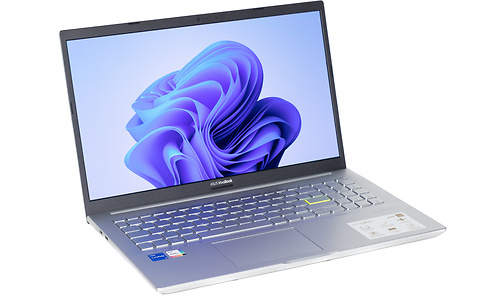
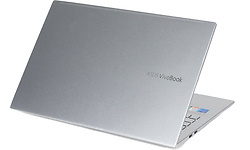
Asus VivoBook 15 OLED K513EA-L12829W

Prijsverloop

Dit product is niet (meer) verkrijgbaar bij de bij Hardware Info aangesloten shops.

Specificaties

Belangrijkste specificaties

Processor type Intel Core i5 1135G7
Geheugen capaciteit 16 GB
Scherm diagonaal 15,6 inch
Resolutie 1920x1080
Touchscreen
GPU type Intel Iris Xe Graphics G7 (Tiger Lake 80 EU)
Totale opslagcapaciteit 512 GB
Toetsenbordindeling Qwerty
Gewicht totaal 1,55 kg
Besturingssysteem (serie) Windows

Processor / Chipset / Geheugen

Processor serie Intel Core i5
Processor type Intel Core i5 1135G7
Processor klokfrequentie 2,4 GHz
Processor klokfrequentie (max. turbo) 4,2 GHz
Configureerbare TDP-down 12 W
Configureerbare TDP-up 28 W
Configureerbare TDP-downfrequentie 1 GHz
Configureerbare TDP-upfrequentie 2 GHz
Aantal processorcores 4
Geheugen capaciteit 16 GB
Type geheugen DDR4
Geheugen klokfrequentie 3.200 MHz
Geheugen form factor On-board + Sodimm
SODIMM sloten 1
Vrije SODIMM sloten 0
Werkgeheugen uitbreidbaar tot 16 GB

Scherm

Scherm diagonaal 15,6 inch
Resolutie 1920x1080
Verhouding 16:9
Pixeldichtheid 141 ppi
Scherm type (mat/glans) Glanzend
Paneeltype OLED
LED-achtergrondverlichting
Touchscreen
Maximale verversingsfrequentie 60 Hz

Graphics

GPU type Intel Iris Xe Graphics G7 (Tiger Lake 80 EU)
Geïntegreerde / losse GPU Geïntegreerd

Opslag

Totale opslagcapaciteit 512 GB
SSD opslagcapaciteit 512 GB
Beschikbaar opslaggeheugen 432,2 GB
Aantal harddisks / SSD's 1
Harddisk/SSD 1 capaciteit 512 GB
Harddisk/SSD 1 soort SSD/Flash
Harddisk/SSD 1 form factor M.2
DVD branden
Blu-ray lezen
Blu-ray branden

Connectiviteit / Netwerk

Netwerkaansluiting (bedraad)
WiFi standaard 802.11ax (Wi-Fi 6)
WiFi adapter Intel(R) Wi-Fi 6 AX201 160Mhz
Bluetooth
Bluetooth-versie Bluetooth 5.2
4G (LTE)
5G

Aansluitingen

Smartcard
USB 2.0 (Type-A) 2
USB 3.2 - 5 Gb/s (Type-A) 1
USB 3.2 - 5 Gb/s (Type-C) 1
Cardreader - SD
Cardreader - MicroSD
DVI-uitgang
VGA-uitgang
HDMI-uitgang
Aantal HDMI-uitgangen 1
Micro HDMI-uitgang
HDMI-versie 1.4
DisplayPort-uitgang
Mini DisplayPort-uitgang
Analoge audio aansluitingen 1
Aansluiting dockingstation
Kensingtonslot

Toetsenbord en touchpad

Toetsenbordindeling Qwerty
Numeriek toetsenbord
Toetsenbordverlichting helderheidsniveaus 3
Toetsenbordverlichting kleur Wit
Touchpad MS Precision compatible
Touchpad afzonderlijke muistoetsen

Camera

Webcam
Webcam resolutie 0,9 MPixel
Tweede camera
Flitser
Camera Windows Hello compatible
Webcamschuifje

Sensors

Accelerometer
Vingerafdruklezer
NFC

Overige hardware

Trusted Platform Module (TPM)
Geïntegreerde microfoon

Maten en gewichten

Accu capaciteit (Wh) 42,6 Wh
Verwisselbare accu
Gewicht totaal 1,55 kg
Afmeting - Breedte 35,9 cm
Afmeting - Diepte 23,5 cm
Afmeting - Hoogte/Dikte 1,79 cm
Passief gekoeld

Software

Besturingssysteem Microsoft Windows 11 Home
Besturingssysteem (serie) Windows
Windows versie 21H2
Windows OS Build 22.000,434
Aantal bits OS 64 bit

Fabrikantsopgave eigenschappen

Garantie 2 jaar

Productcodes

SKU 90NB0SG2-M006H0
EAN 4711081486619
Toegevoegd aan Hardware Info vrijdag 24 december 2021

Testresultaten

Dit product is door Hardware Info getest op vrijdag 28 januari 2022.

Geluidstest

Noise floor 14 dB(A)
Testconfiguratie
  • Geluidsdichte ruimte 2021
  • Larson Davis SoundAdvisor Model 831C
Afstand geluidsmeting 50 cm
Testconfiguratie
  • Geluidsdichte ruimte 2021
  • Larson Davis SoundAdvisor Model 831C
WebXPRT 3 - LAeq 17,4 dB
Testconfiguratie
  • Geluidsdichte ruimte 2021
  • Larson Davis SoundAdvisor Model 831C
PCMark 10 Express - LAeq 24,2 dB
Testconfiguratie
  • Geluidsdichte ruimte 2021
  • Larson Davis SoundAdvisor Model 831C
Blender - LAeq 41,3 dB
Testconfiguratie
  • Geluidsdichte ruimte 2021
  • Larson Davis SoundAdvisor Model 831C

PCMark 10 Storage

PCMark 10 - Gebruiken Adobe Photoshop Heavy 306
Testconfiguratie
  • Windows benchmarks
PCMark 10 - Storage - Totaalscore - Toegangstijd 123
Testconfiguratie
  • Windows benchmarks
PCMark 10 - Storage - Totaalscore - Bandbreedte 223,31
PCMark 10 - Storage - Totaalscore 1.379
Testconfiguratie
  • Windows benchmarks
PCMark 10 - 2.37GB_(399_JPEGs)_leestest 295
PCMark 10 - 2.37GB_(399_JPEGs)_kopieertest 289
Testconfiguratie
  • Windows benchmarks
PCMark 10 - 2.37GB_(399_JPEGs)_schrijftest 224
Testconfiguratie
  • Windows benchmarks
PCMark 10 - 2GB_(4_ISOs)_leestest 1.110
Testconfiguratie
  • Windows benchmarks
PCMark 10 - 2GB_(4_ISOs)_kopieertest 800
Testconfiguratie
  • Windows benchmarks
PCMark 10 - 2GB_(4_ISOs)_schrijftest 905
Testconfiguratie
  • Windows benchmarks
PCMark 10 - Gebruiken Microsoft PowerPoint 120
Testconfiguratie
  • Windows benchmarks
PCMark 10 - Gebruiken Microsoft Excel 103
Testconfiguratie
  • Windows benchmarks
PCMark 10 - Gebruiken Adobe Photoshop Light 168
Testconfiguratie
  • Windows benchmarks
PCMark 10 - Starten Windows 10 238
Testconfiguratie
  • Windows benchmarks
PCMark 10 - Gebruiken Adobe InDesign 140
Testconfiguratie
  • Windows benchmarks
PCMark 10 - Gebruiken Adobe Illustrator 127
PCMark 10 - Gebruiken Adobe After Effects 250
Testconfiguratie
  • Windows benchmarks
PCMark 10 - Starten Overwatch 238
Testconfiguratie
  • Windows benchmarks
PCMark 10 - Starten Call of Duty: Black Ops 4 396
Testconfiguratie
  • Windows benchmarks
PCMark 10 - Starten Battlefield V 454
Testconfiguratie
  • Windows benchmarks
PCMark 10 - Starten Adobe Photoshop 126
Testconfiguratie
  • Windows benchmarks
PCMark 10 - Starten Adobe Lightroom 101
Testconfiguratie
  • Windows benchmarks
PCMark 10 - Starten Adobe Premiere_Pro 129
Testconfiguratie
  • Windows benchmarks
PCMark 10 - Starten Adobe Illustrator 107
Testconfiguratie
  • Windows benchmarks
PCMark 10 - Starten Adobe After Effects 110
Testconfiguratie
  • Windows benchmarks
PCMark 10 - Starten Adobe Acrobat 115
Testconfiguratie
  • Windows benchmarks
PCMark 10 - Quick Storage - Totaalscore 1.680
Testconfiguratie
  • Windows benchmarks
PCMark 10 - Quick Storage - Totaalscore - Bandbreedte 209,87
Testconfiguratie
  • Windows benchmarks
PCMark 10 - Quick Storage - Totaalscore - Toegangstijd 78
Testconfiguratie
  • Windows benchmarks

Platform onafhankelijke tests

Opstarttijd 8,7 sec.
Testconfiguratie
  • Platform onafhankelijke tests
JetStream 2 157,176
Testconfiguratie
  • Platform onafhankelijke tests
webXPRT 3 221
Testconfiguratie
  • Platform onafhankelijke tests
webXPRT 3 - Photo Enhancement 266 ms
Testconfiguratie
  • Platform onafhankelijke tests
webXPRT 3 - Organize Album using AI 2.093 ms
Testconfiguratie
  • Platform onafhankelijke tests
webXPRT 3 - Stock Option Pricing 177 ms
Testconfiguratie
  • Platform onafhankelijke tests
webXPRT 3 - Encrypt Notes and OCR Scan 2.075 ms
Testconfiguratie
  • Platform onafhankelijke tests
webXPRT 3 - Sales Graphs 409 ms
Testconfiguratie
  • Platform onafhankelijke tests
webXPRT 3 - Online Homework 1.301 ms
Testconfiguratie
  • Platform onafhankelijke tests
Geekbench 5 - Multi 4.717
Testconfiguratie
  • Platform onafhankelijke tests
Geekbench 5 - Multi Crypto 5.705
Testconfiguratie
  • Platform onafhankelijke tests
Geekbench 5 - Multi Integer 4.469
Testconfiguratie
  • Platform onafhankelijke tests
Geekbench 5 - Multi Floating Point 5.091
Testconfiguratie
  • Platform onafhankelijke tests
Geekbench 5 - Single 1.403
Testconfiguratie
  • Platform onafhankelijke tests
Geekbench 5 - Single Crypto 3.682
Testconfiguratie
  • Platform onafhankelijke tests
Geekbench 5 - Single Integer 1.218
Testconfiguratie
  • Platform onafhankelijke tests
Geekbench 5 - Single Floating Point 1.425
Testconfiguratie
  • Platform onafhankelijke tests
Geekbench 5 - OpenCL 13.558
Testconfiguratie
  • Platform onafhankelijke tests
WiFi speedtest 2.4GHz receive 215 Mbit/s
Testconfiguratie
  • Platform onafhankelijke tests
WiFi speedtest 2.4GHz send 165 Mbit/s
Testconfiguratie
  • Platform onafhankelijke tests
WiFi speedtest 5.0GHz receive 648 Mbit/s
Testconfiguratie
  • Platform onafhankelijke tests
WiFi speedtest 5.0GHz send 671 Mbit/s
Testconfiguratie
  • Platform onafhankelijke tests

Windows benchmarks

3DMark - Ice Storm 93.715
Testconfiguratie
  • Windows benchmarks
3DMark - Cloud Gate 16.629
Testconfiguratie
  • Windows benchmarks
3DMark - Cloud Gate Graphics 22.008
Testconfiguratie
  • Windows benchmarks
3DMark - Cloud Gate Physics 8.963
Testconfiguratie
  • Windows benchmarks
3DMark - Fire Strike 3.064
Testconfiguratie
  • Windows benchmarks
3DMark - Fire Strike Graphics 3.373
Testconfiguratie
  • Windows benchmarks
3DMark - Fire Strike Physics 12.846
Testconfiguratie
  • Windows benchmarks
3DMark - Fire Strike Combined 1.083
Testconfiguratie
  • Windows benchmarks
3DMark - Time Spy 1.320
Testconfiguratie
  • Windows benchmarks
3DMark - Time Spy Graphics 1.174
Testconfiguratie
  • Windows benchmarks
3DMark - Time Spy CPU 4.511
Testconfiguratie
  • Windows benchmarks
3DMark - Night Raid 12.443
Testconfiguratie
  • Windows benchmarks
3DMark - Night Raid Graphics 13.360
Testconfiguratie
  • Windows benchmarks
3DMark - Night Raid CPU 8.960
Testconfiguratie
  • Windows benchmarks
Cinebench R15 - Single 196
Testconfiguratie
  • Windows benchmarks
Cinebench R15 - Multi 919
Testconfiguratie
  • Windows benchmarks
Cinebench R20 - Single 519
Testconfiguratie
  • Windows benchmarks
Cinebench R20 - Multi 2.184
Testconfiguratie
  • Windows benchmarks
Cinebench R23 - Single 1.355
Testconfiguratie
  • Windows benchmarks
Cinebench R23 - Multi 5.640
Testconfiguratie
  • Windows benchmarks
PCMark 8 - Storage 2.0 - Storage Score 5.014
Testconfiguratie
  • Windows benchmarks
PCMark 8 - Storage 2.0 - Storage Bandwidth 321,05 MB/s
Testconfiguratie
  • Windows benchmarks
Geekbench4 - Multi 18.987
Testconfiguratie
  • Windows benchmarks
Geekbench4 - Multi crypto 12.840
Testconfiguratie
  • Windows benchmarks
Geekbench4 - Multi integer 22.781
Testconfiguratie
  • Windows benchmarks
Geekbench4 - Multi float 23.311
Testconfiguratie
  • Windows benchmarks
Geekbench4 - Multi memory 5.501
Testconfiguratie
  • Windows benchmarks
Geekbench4 - Single 5.878
Testconfiguratie
  • Windows benchmarks
Geekbench4 - Single crypto 7.526
Testconfiguratie
  • Windows benchmarks
Geekbench4 - Single integer 5.773
Testconfiguratie
  • Windows benchmarks
Geekbench4 - Single float 6.184
Testconfiguratie
  • Windows benchmarks
Geekbench4 - Single memory 5.242
Testconfiguratie
  • Windows benchmarks
Blender duurtest run #1 46,4
Testconfiguratie
  • Windows benchmarks
Blender duurtest run #2 50,81
Testconfiguratie
  • Windows benchmarks
Blender duurtest run #3 53,9
Testconfiguratie
  • Windows benchmarks
Blender duurtest run #4 52,18
Testconfiguratie
  • Windows benchmarks
Blender duurtest run #5 51,83
Testconfiguratie
  • Windows benchmarks
Blender duurtest run #6 55,72
Testconfiguratie
  • Windows benchmarks
Blender duurtest run #7 55,03
Testconfiguratie
  • Windows benchmarks
Blender duurtest run #8 52,39
Testconfiguratie
  • Windows benchmarks
Blender duurtest run #9 54,87
Testconfiguratie
  • Windows benchmarks
Blender duurtest run #10 56,9
Testconfiguratie
  • Windows benchmarks
Blender duurtest run #11 56,83
Testconfiguratie
  • Windows benchmarks
Blender duurtest run #12 56,91
Testconfiguratie
  • Windows benchmarks
Blender duurtest run #13 56,72
Testconfiguratie
  • Windows benchmarks
Blender duurtest run #14 56,58
Testconfiguratie
  • Windows benchmarks
Blender duurtest run #15 56,81
Testconfiguratie
  • Windows benchmarks
Blender duurtest run #16 56,76
Testconfiguratie
  • Windows benchmarks
Blender duurtest run #17 57,14
Testconfiguratie
  • Windows benchmarks
Blender duurtest run #18 56,92
Testconfiguratie
  • Windows benchmarks
Blender duurtest run #19 56,99
Testconfiguratie
  • Windows benchmarks
Blender duurtest run #20 56,77
Testconfiguratie
  • Windows benchmarks
PCMark 10 Extended 4.153
Testconfiguratie
  • Windows benchmarks
PCMark 10 Essentials 9.668
Testconfiguratie
  • Windows benchmarks
PCMark 10 App Start-up 13.370
Testconfiguratie
  • Windows benchmarks
PCMark 10 Video Conferencing 7.928
Testconfiguratie
  • Windows benchmarks
PCMark 10 Web Browsing 8.526
Testconfiguratie
  • Windows benchmarks
PCMark 10 Productivity 6.522
Testconfiguratie
  • Windows benchmarks
PCMark 10 Spreadsheets 5.770
Testconfiguratie
  • Windows benchmarks
PCMark 10 Writing 7.374
Testconfiguratie
  • Windows benchmarks
PCMark 10 Digital Content Creation 5.094
Testconfiguratie
  • Windows benchmarks
PCMark 10 Photo Editing 8.465
Testconfiguratie
  • Windows benchmarks
PCMark 10 Rendering and Visualization 3.181
Testconfiguratie
  • Windows benchmarks
PCMark 10 Video Editing 4.909
Testconfiguratie
  • Windows benchmarks
PCMark 10 Gaming 2.505
Testconfiguratie
  • Windows benchmarks
PCMark 10 Graphics 3.289
Testconfiguratie
  • Windows benchmarks
PCMark 10 Physics 12.688
Testconfiguratie
  • Windows benchmarks
PCMark 10 Combined 1.075
Testconfiguratie
  • Windows benchmarks

Energieverbruik / Accu

Energieverbruik uit 0,2 W
Testconfiguratie
  • Windows benchmarks
Energieverbruik adapter (zonder laptop) 0 W
Testconfiguratie
  • Windows benchmarks
Energieverbruik idle 8,1 W
Testconfiguratie
  • Windows benchmarks
Browser accutest - 180 cd/m2 374 min.
Testconfiguratie
  • Windows benchmarks
PCMark Creative accutest - 180 cd/m2 171 min.
Testconfiguratie
  • Windows benchmarks
PCMark Creative (Accu) 4.006
Testconfiguratie
  • Windows benchmarks
PCMark 10 Accu Digital 3.324
Testconfiguratie
  • Windows benchmarks
PCMark 10 Accu Essentials 6.971
Testconfiguratie
  • Windows benchmarks
PCMark 10 Accu Productivity 5.039
Testconfiguratie
  • Windows benchmarks
PCMark 10 Accu Duration in Minuten 131
Testconfiguratie
  • Windows benchmarks
PCMark 10 Accu Aantal Runs 5
Testconfiguratie
  • Windows benchmarks

Testresultaten beeldscherm

Gemeten kleurruimte sRGB
Testconfiguratie
  • Beeldscherm test SpectraCal CALman 5.13
Kleurtemperatuur 7.185 K
Testconfiguratie
  • Beeldscherm test SpectraCal CALman 5.13
Helderheid wit 366 cd/m²
Testconfiguratie
  • Beeldscherm test SpectraCal CALman 5.13
Helderheid zwart 0,00 cd/m²
Testconfiguratie
  • Beeldscherm test SpectraCal CALman 5.13
Checkerboard wit 371,047 cd/m²
Testconfiguratie
  • Beeldscherm test SpectraCal CALman 5.13
Checkerboard zwart 0 cd/m²
Testconfiguratie
  • Beeldscherm test SpectraCal CALman 5.13
Gamma 1,84
Testconfiguratie
  • Beeldscherm test SpectraCal CALman 5.13
Gamma (afwijking van 2,2) 0,36
Testconfiguratie
  • Beeldscherm test SpectraCal CALman 5.13
Kleurafwijking rood (Delta E 1994) 1,62
Testconfiguratie
  • Beeldscherm test SpectraCal CALman 5 i.c.m. X
  • Rite i1 Display Pro colorimeter
Kleurafwijking groen (Delta E 1994) 4,44
Testconfiguratie
  • Beeldscherm test SpectraCal CALman 5 i.c.m. X
  • Rite i1 Display Pro colorimeter
Kleurafwijking blauw (Delta E 1994) 3,88
Testconfiguratie
  • Beeldscherm test SpectraCal CALman 5 i.c.m. X
  • Rite i1 Display Pro colorimeter
Kleurafwijking cyaan (Delta E 1994) 4,30
Testconfiguratie
  • Beeldscherm test SpectraCal CALman 5 i.c.m. X
  • Rite i1 Display Pro colorimeter
Kleurafwijking magenta (Delta E 1994) 1,19
Testconfiguratie
  • Beeldscherm test SpectraCal CALman 5 i.c.m. X
  • Rite i1 Display Pro colorimeter
Kleurafwijking geel (Delta E 1994) 2,28
Testconfiguratie
  • Beeldscherm test SpectraCal CALman 5 i.c.m. X
  • Rite i1 Display Pro colorimeter
Gemiddelde kleurafwijking (Delta E 1994) 3,0
Testconfiguratie
  • Beeldscherm test SpectraCal CALman 5 i.c.m. X
  • Rite i1 Display Pro colorimeter
Gemiddelde grijsafwijking (Delta E 1994) 5,2
Testconfiguratie
  • Beeldscherm test SpectraCal CALman 5 i.c.m. X
  • Rite i1 Display Pro colorimeter
Kleurafwijking 75% wit (Delta E 2000) 4,89 mΔuv
Testconfiguratie
  • Beeldscherm test SpectraCal CALman 5 i.c.m. X
  • Rite i1 Display Pro colorimeter
Kleurafwijking 75% rood (Delta E 2000) 1,57 mΔuv
Testconfiguratie
  • Beeldscherm test SpectraCal CALman 5 i.c.m. X
  • Rite i1 Display Pro colorimeter
Kleurafwijking 75% groen (Delta E 2000) 3,74 mΔuv
Testconfiguratie
  • Beeldscherm test SpectraCal CALman 5 i.c.m. X
  • Rite i1 Display Pro colorimeter
Kleurafwijking 75% blauw (Delta E 2000) 3,13 mΔuv
Testconfiguratie
  • Beeldscherm test SpectraCal CALman 5 i.c.m. X
  • Rite i1 Display Pro colorimeter
Kleurafwijking 75% cyaan (Delta E 2000) 3,92 mΔuv
Testconfiguratie
  • Beeldscherm test SpectraCal CALman 5 i.c.m. X
  • Rite i1 Display Pro colorimeter
Kleurafwijking 75% magenta (Delta E 2000) 1,16 mΔuv
Testconfiguratie
  • Beeldscherm test SpectraCal CALman 5 i.c.m. X
  • Rite i1 Display Pro colorimeter
Kleurafwijking 75% geel (Delta E 2000) 2,33 mΔuv
Testconfiguratie
  • Beeldscherm test SpectraCal CALman 5 i.c.m. X
  • Rite i1 Display Pro colorimeter
Gemiddelde kleurafwijking (Delta E 2000) 3,2 mΔuv
Testconfiguratie
  • Beeldscherm test SpectraCal CALman 5.13
Kleurafwijking 100% wit (Delta E 2000) 5,19 mΔuv
Testconfiguratie
  • Beeldscherm test SpectraCal CALman 5 i.c.m. X
  • Rite i1 Display Pro colorimeter
Gemiddelde kleurafwijking excl. wit (Delta E 2000) 2,6
Testconfiguratie
  • Beeldscherm test SpectraCal CALman 5 i.c.m. X
  • Rite i1 Display Pro colorimeter
Gemiddelde grijsafwijking (Delta E 2000) 4,7 mΔuv
Testconfiguratie
  • Beeldscherm test SpectraCal CALman 5.13
sRGB dekking 100 %
Testconfiguratie
  • Beeldscherm test SpectraCal CALman 5.13
DCI-P3 dekking 84,6 %
Testconfiguratie
  • Beeldscherm test SpectraCal CALman 5.13
Rec 2020 dekking 61,3 %
Testconfiguratie
  • Beeldscherm test SpectraCal CALman 5.13
0