Getest

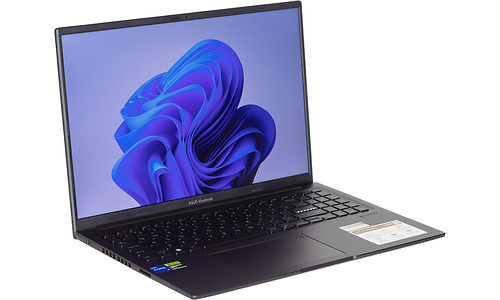
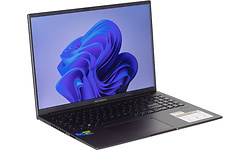
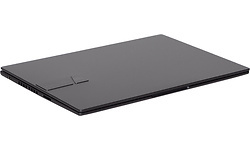
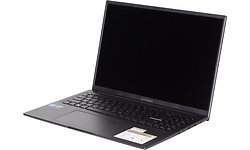
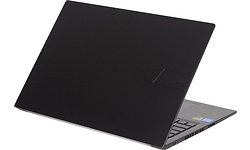
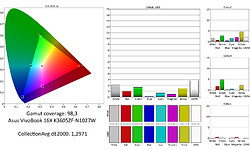
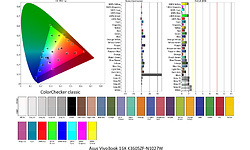
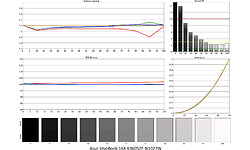
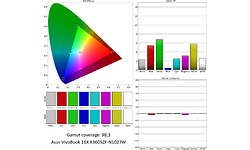
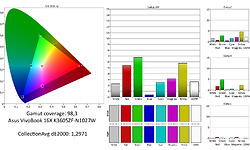
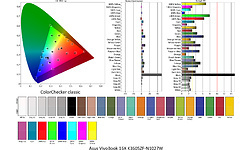
Asus VivoBook 16X K3605ZF-N1027W

Prijsverloop

Specificaties

Belangrijkste specificaties

Processor type Intel Core i5 12450H
Geheugen capaciteit 16 GB
Scherm diagonaal 16 inch
Resolutie 1920x1200
Touchscreen
GPU type Nvidia GeForce RTX 2050
Totale opslagcapaciteit 512 GB
Toetsenbordindeling Qwerty
Gewicht totaal 1,94 kg
Besturingssysteem (serie) Windows

Processor / Chipset / Geheugen

Processor serie Intel Core i5
Processor type Intel Core i5 12450H
Processor klokfrequentie 2 GHz
Processor klokfrequentie (max. turbo) 4,4 GHz
Configureerbare TDP-down 35 W
Configureerbare TDP-up 95 W
Aantal processorcores 8
Geheugen capaciteit 16 GB
Type geheugen DDR4
Geheugen klokfrequentie 3.200 MHz
Geheugen form factor On-board + Sodimm
SODIMM sloten 1
Vrije SODIMM sloten 0
Werkgeheugen uitbreidbaar tot 16 GB

Scherm

Scherm diagonaal 16 inch
Resolutie 1920x1200
Verhouding 16:10
Pixeldichtheid 142 ppi
Scherm type (mat/glans) Mat
Paneeltype IPS
LED-achtergrondverlichting
Touchscreen
Maximale verversingsfrequentie 120 Hz

Graphics

GPU type Nvidia GeForce RTX 2050
Geïntegreerde / losse GPU Losse chip
Videogeheugen 4 GB

Opslag

Totale opslagcapaciteit 512 GB
SSD opslagcapaciteit 512 GB
Beschikbaar opslaggeheugen 420,6 GB
Aantal harddisks / SSD's 1
Harddisk/SSD 1 capaciteit 420,6 GB
Harddisk/SSD 1 soort SSD/Flash
Harddisk/SSD 1 form factor M.2
Harddisk/SSD 1 merk/product Intel SSDPEKNU512GZ
DVD branden
Blu-ray lezen
Blu-ray branden

Connectiviteit / Netwerk

Netwerkaansluiting (bedraad)
WiFi standaard 802.11ax (Wi-Fi 6E)
WiFi adapter Intel(R) Wi-Fi 6E AX211 160Mhz
Bluetooth
Bluetooth-versie Bluetooth 5.3
4G (LTE)
5G

Aansluitingen

Smartcard
USB 3.2 - 5 Gb/s (Type-A) 2
USB 3.2 - 5 Gb/s (Type-C) 1
Cardreader - SD
Cardreader - MicroSD
DVI-uitgang
VGA-uitgang
HDMI-uitgang
Aantal HDMI-uitgangen 1
Micro HDMI-uitgang
HDMI-versie 2.1
DisplayPort-uitgang
Mini DisplayPort-uitgang
Analoge audio aansluitingen 1
Aansluiting dockingstation
Kensingtonslot

Toetsenbord en touchpad

Toetsenbordindeling Qwerty
Numeriek toetsenbord
Toetsenbordverlichting helderheidsniveaus 3
Toetsenbordverlichting kleur Wit
Touchpad afzonderlijke muistoetsen

Camera

Webcam
Webcam resolutie 0,9 MPixel
Tweede camera
Flitser
Camera Windows Hello compatible
Webcamschuifje

Sensors

Accelerometer
Vingerafdruklezer
NFC

Overige hardware

Trusted Platform Module (TPM)
Geïntegreerde microfoon

Maten en gewichten

Accu capaciteit (Wh) 50 Wh
Verwisselbare accu
Gewicht totaal 1,94 kg
Afmeting - Breedte 35,9 cm
Afmeting - Diepte 24,9 cm
Afmeting - Hoogte/Dikte 2,05 cm
Passief gekoeld

Software

Besturingssysteem Microsoft Windows 11 Home
Besturingssysteem (serie) Windows
Windows versie 22H2
Windows OS Build 22.621,213
Aantal bits OS 64 bit

Fabrikantsopgave eigenschappen

Garantie 2 jaar

Platform onafhankelijke tests

Geekbench 6.1.0 - Multi 8.137
Geekbench 6.1.0 - Multi Integer 7.291
Geekbench 6.1.0 - Multi Floating Point 9.978
Geekbench 6.1.0 - Single 2.148
Geekbench 6.1.0 - Single Integer 2.083
Geekbench 6.1.0 - Single Floating Point 2.273
Geekbench 6.1.0 - Compute 43.993

Productcodes

SKU 90NB11E1-M005D0
EAN 4711387094433
Toegevoegd aan Hardware Info donderdag 15 juni 2023

Testresultaten

Dit product is door Hardware Info getest op vrijdag 25 augustus 2023.

Metro Exodus

Metro Exodus - 1920x1080 - Medium 47,8 fps
Testconfiguratie
  • Game benchmarks 2022
Metro Exodus - 1920x1080 - Medium (99p) 42,27 ms
Testconfiguratie
  • Game benchmarks 2022
Metro Exodus - 1920x1080 - Medium (99.9p) 46,54 ms
Testconfiguratie
  • Game benchmarks 2022
Metro Exodus - 1920x1080 - Ultra 29,1 fps
Testconfiguratie
  • Game benchmarks 2022
Metro Exodus - 1920x1080 - Ultra (99p) 59,54 ms
Testconfiguratie
  • Game benchmarks 2022
Metro Exodus - 1920x1080 - Ultra (99.9p) 66,28 ms
Testconfiguratie
  • Game benchmarks 2022
Metro Exodus - 2560x1440 - Medium 34 fps
Testconfiguratie
  • Game benchmarks 2022
Metro Exodus - 2560x1440 - Medium (99p) 54,28 ms
Testconfiguratie
  • Game benchmarks 2022
Metro Exodus - 2560x1440 - Medium (99.9p) 57,9 ms
Testconfiguratie
  • Game benchmarks 2022
Metro Exodus - 2560x1440 - Ultra 22,3 fps
Testconfiguratie
  • Game benchmarks 2022
Metro Exodus - 2560x1440 - Ultra (99p) 75,71 ms
Testconfiguratie
  • Game benchmarks 2022
Metro Exodus - 2560x1440 - Ultra (99.9p) 84,81 ms
Testconfiguratie
  • Game benchmarks 2022
Metro Exodus - 3840x2160 - Medium 18,8 fps
Testconfiguratie
  • Game benchmarks 2022
Metro Exodus - 3840x2160 - Medium (99p) 91,18 ms
Testconfiguratie
  • Game benchmarks 2022
Metro Exodus - 3840x2160 - Medium (99.9p) 98,31 ms
Testconfiguratie
  • Game benchmarks 2022
Metro Exodus - 3840x2160 - Ultra 13,1 fps
Testconfiguratie
  • Game benchmarks 2022
Metro Exodus - 3840x2160 - Ultra (99p) 124,98 ms
Testconfiguratie
  • Game benchmarks 2022
Metro Exodus - 3840x2160 - Ultra (99.9p) 146,86 ms
Testconfiguratie
  • Game benchmarks 2022
Metro Exodus - 1920x1080 - Ultra (DXR - High) 23,5 fps
Testconfiguratie
  • Game benchmarks 2022
Metro Exodus - 1920x1080 - Ultra (DXR - High) (99p) 74,03 ms
Testconfiguratie
  • Game benchmarks 2022
Metro Exodus - 1920x1080 - Ultra (DXR - High) (99.9p) 104,88 ms
Testconfiguratie
  • Game benchmarks 2022
Metro Exodus - 2560x1440 - Ultra (DXR - High) 15,7 fps
Testconfiguratie
  • Game benchmarks 2022
Metro Exodus - 2560x1440 - Ultra (DXR - High) (99p) 110,82 ms
Testconfiguratie
  • Game benchmarks 2022
Metro Exodus - 2560x1440 - Ultra (DXR - High) (99.9p) 130,02 ms
Testconfiguratie
  • Game benchmarks 2022

Total War: Troy

Total War: Troy - 1920x1080 - Medium 80,7 fps
Testconfiguratie
  • Game benchmarks 2022
Total War: Troy - 1920x1080 - Medium (99p) 14,74 ms
Testconfiguratie
  • Game benchmarks 2022
Total War: Troy - 1920x1080 - Medium (99.9p) 15,17 ms
Testconfiguratie
  • Game benchmarks 2022
Total War: Troy - 1920x1080 - Ultra 40,1 fps
Testconfiguratie
  • Game benchmarks 2022
Total War: Troy - 1920x1080 - Ultra (99p) 31,32 ms
Testconfiguratie
  • Game benchmarks 2022
Total War: Troy - 1920x1080 - Ultra (99.9p) 35,24 ms
Testconfiguratie
  • Game benchmarks 2022
Total War: Troy - 2560x1440 - Medium 56,6 fps
Testconfiguratie
  • Game benchmarks 2022
Total War: Troy - 2560x1440 - Medium (99p) 20,62 ms
Testconfiguratie
  • Game benchmarks 2022
Total War: Troy - 2560x1440 - Medium (99.9p) 21 ms
Testconfiguratie
  • Game benchmarks 2022
Total War: Troy - 2560x1440 - Ultra 29,7 fps
Testconfiguratie
  • Game benchmarks 2022
Total War: Troy - 2560x1440 - Ultra (99p) 41,74 ms
Testconfiguratie
  • Game benchmarks 2022
Total War: Troy - 2560x1440 - Ultra (99.9p) 45,48 ms
Testconfiguratie
  • Game benchmarks 2022
Total War: Troy - 3840x2160 - Medium 31,1 fps
Testconfiguratie
  • Game benchmarks 2022
Total War: Troy - 3840x2160 - Medium (99p) 36,89 ms
Testconfiguratie
  • Game benchmarks 2022
Total War: Troy - 3840x2160 - Medium (99.9p) 37,31 ms
Testconfiguratie
  • Game benchmarks 2022
Total War: Troy - 3840x2160 - Ultra 16,8 fps
Testconfiguratie
  • Game benchmarks 2022
Total War: Troy - 3840x2160 - Ultra (99p) 74 ms
Testconfiguratie
  • Game benchmarks 2022
Total War: Troy - 3840x2160 - Ultra (99.9p) 82,07 ms
Testconfiguratie
  • Game benchmarks 2022

Far Cry: New Dawn

Far Cry: New Dawn - 1920x1080 - Medium 69,8 fps
Testconfiguratie
  • Game benchmarks 2022
Far Cry: New Dawn - 1920x1080 - Medium (99p) 19,08 ms
Testconfiguratie
  • Game benchmarks 2022
Far Cry: New Dawn - 1920x1080 - Medium (99.9p) 24,36 ms
Testconfiguratie
  • Game benchmarks 2022
Far Cry: New Dawn - 1920x1080 - Ultra 58,5 fps
Testconfiguratie
  • Game benchmarks 2022
Far Cry: New Dawn - 1920x1080 - Ultra (99p) 23,56 ms
Testconfiguratie
  • Game benchmarks 2022
Far Cry: New Dawn - 1920x1080 - Ultra (99.9p) 26,74 ms
Testconfiguratie
  • Game benchmarks 2022
Far Cry: New Dawn - 2560x1440 - Medium 50 fps
Testconfiguratie
  • Game benchmarks 2022
Far Cry: New Dawn - 2560x1440 - Medium (99p) 25,31 ms
Testconfiguratie
  • Game benchmarks 2022
Far Cry: New Dawn - 2560x1440 - Medium (99.9p) 32,75 ms
Testconfiguratie
  • Game benchmarks 2022
Far Cry: New Dawn - 2560x1440 - Ultra 42,1 fps
Testconfiguratie
  • Game benchmarks 2022
Far Cry: New Dawn - 2560x1440 - Ultra (99p) 30,73 ms
Testconfiguratie
  • Game benchmarks 2022
Far Cry: New Dawn - 2560x1440 - Ultra (99.9p) 44,41 ms
Testconfiguratie
  • Game benchmarks 2022
Far Cry: New Dawn - 3840x2160 - Medium 25,9 fps
Testconfiguratie
  • Game benchmarks 2022
Far Cry: New Dawn - 3840x2160 - Medium (99p) 47,84 ms
Testconfiguratie
  • Game benchmarks 2022
Far Cry: New Dawn - 3840x2160 - Medium (99.9p) 57,78 ms
Testconfiguratie
  • Game benchmarks 2022
Far Cry: New Dawn - 3840x2160 - Ultra 22,2 fps
Testconfiguratie
  • Game benchmarks 2022
Far Cry: New Dawn - 3840x2160 - Ultra (99p) 55,78 ms
Testconfiguratie
  • Game benchmarks 2022
Far Cry: New Dawn - 3840x2160 - Ultra (99.9p) 69,65 ms
Testconfiguratie
  • Game benchmarks 2022

F1 2020

F1 2020 (DX12) - 1920x1080 - Medium 118,1 fps
Testconfiguratie
  • Game benchmarks 2022
F1 2020 (DX12) - 1920x1080 - Medium (99p) 11,1 ms
Testconfiguratie
  • Game benchmarks 2022
F1 2020 (DX12) - 1920x1080 - Medium (99.9p) 14,4 ms
Testconfiguratie
  • Game benchmarks 2022
F1 2020 (DX12) - 1920x1080 - Ultra 81 fps
Testconfiguratie
  • Game benchmarks 2022
F1 2020 (DX12) - 1920x1080 - Ultra (99p) 16,7 ms
Testconfiguratie
  • Game benchmarks 2022
F1 2020 (DX12) - 1920x1080 - Ultra (99.9p) 21,8 ms
Testconfiguratie
  • Game benchmarks 2022
F1 2020 (DX12) - 2560x1440 - Medium 85,4 fps
Testconfiguratie
  • Game benchmarks 2022
F1 2020 (DX12) - 2560x1440 - Medium (99p) 14,7 ms
Testconfiguratie
  • Game benchmarks 2022
F1 2020 (DX12) - 2560x1440 - Medium (99.9p) 17,8 ms
Testconfiguratie
  • Game benchmarks 2022
F1 2020 (DX12) - 2560x1440 - Ultra 57,7 fps
Testconfiguratie
  • Game benchmarks 2022
F1 2020 (DX12) - 2560x1440 - Ultra (99p) 21,7 ms
Testconfiguratie
  • Game benchmarks 2022
F1 2020 (DX12) - 2560x1440 - Ultra (99.9p) 24,7 ms
Testconfiguratie
  • Game benchmarks 2022
F1 2020 (DX12) - 3840x2160 - Medium 46,5 fps
Testconfiguratie
  • Game benchmarks 2022
F1 2020 (DX12) - 3840x2160 - Medium (99p) 25,5 ms
Testconfiguratie
  • Game benchmarks 2022
F1 2020 (DX12) - 3840x2160 - Medium (99.9p) 31,8 ms
Testconfiguratie
  • Game benchmarks 2022
F1 2020 (DX12) - 3840x2160 - Ultra 31,9 fps
Testconfiguratie
  • Game benchmarks 2022
F1 2020 (DX12) - 3840x2160 - Ultra (99p) 38,2 ms
Testconfiguratie
  • Game benchmarks 2022
F1 2020 (DX12) - 3840x2160 - Ultra (99.9p) 74,5 ms
Testconfiguratie
  • Game benchmarks 2022

Geluidstest

Noise floor 14 dB(A)
Testconfiguratie
  • Geluidsdichte ruimte 2021
  • Larson Davis SoundAdvisor Model 831C
Afstand geluidsmeting 50 cm
Testconfiguratie
  • Geluidsdichte ruimte 2021
  • Larson Davis SoundAdvisor Model 831C
WebXPRT 3 - LAeq 17,7 dB
Testconfiguratie
  • Geluidsdichte ruimte 2021
  • Larson Davis SoundAdvisor Model 831C
PCMark 10 Express - LAeq 26,1 dB
Testconfiguratie
  • Geluidsdichte ruimte 2021
  • Larson Davis SoundAdvisor Model 831C
Blender - LAeq 47,4 dB
Testconfiguratie
  • Geluidsdichte ruimte 2021
  • Larson Davis SoundAdvisor Model 831C
F1 2020 - LAeq 48,8 dB
Testconfiguratie
  • Geluidsdichte ruimte 2021
  • Larson Davis SoundAdvisor Model 831C

PCMark 10 Storage

PCMark 10 - Gebruiken Adobe Photoshop Heavy 590
Testconfiguratie
  • Windows benchmarks
PCMark 10 - Storage - Totaalscore - Toegangstijd 91
Testconfiguratie
  • Windows benchmarks
PCMark 10 - Storage - Totaalscore - Bandbreedte 299,76
PCMark 10 - Storage - Totaalscore 1.858
Testconfiguratie
  • Windows benchmarks
PCMark 10 - 2.37GB_(399_JPEGs)_leestest 370
PCMark 10 - 2.37GB_(399_JPEGs)_kopieertest 487
Testconfiguratie
  • Windows benchmarks
PCMark 10 - 2.37GB_(399_JPEGs)_schrijftest 332
Testconfiguratie
  • Windows benchmarks
PCMark 10 - 2GB_(4_ISOs)_leestest 1.680
Testconfiguratie
  • Windows benchmarks
PCMark 10 - 2GB_(4_ISOs)_kopieertest 1.230
Testconfiguratie
  • Windows benchmarks
PCMark 10 - 2GB_(4_ISOs)_schrijftest 1.453
Testconfiguratie
  • Windows benchmarks
PCMark 10 - Gebruiken Microsoft PowerPoint 124
Testconfiguratie
  • Windows benchmarks
PCMark 10 - Gebruiken Microsoft Excel 123
Testconfiguratie
  • Windows benchmarks
PCMark 10 - Gebruiken Adobe Photoshop Light 216
Testconfiguratie
  • Windows benchmarks
PCMark 10 - Starten Windows 10 270
Testconfiguratie
  • Windows benchmarks
PCMark 10 - Gebruiken Adobe InDesign 155
Testconfiguratie
  • Windows benchmarks
PCMark 10 - Gebruiken Adobe Illustrator 157
PCMark 10 - Gebruiken Adobe After Effects 308
Testconfiguratie
  • Windows benchmarks
PCMark 10 - Starten Overwatch 302
Testconfiguratie
  • Windows benchmarks
PCMark 10 - Starten Call of Duty: Black Ops 4 554
Testconfiguratie
  • Windows benchmarks
PCMark 10 - Starten Battlefield V 609
Testconfiguratie
  • Windows benchmarks
PCMark 10 - Starten Adobe Photoshop 162
Testconfiguratie
  • Windows benchmarks
PCMark 10 - Starten Adobe Lightroom 124
Testconfiguratie
  • Windows benchmarks
PCMark 10 - Starten Adobe Premiere_Pro 183
Testconfiguratie
  • Windows benchmarks
PCMark 10 - Starten Adobe Illustrator 131
Testconfiguratie
  • Windows benchmarks
PCMark 10 - Starten Adobe After Effects 161
Testconfiguratie
  • Windows benchmarks
PCMark 10 - Starten Adobe Acrobat 156
Testconfiguratie
  • Windows benchmarks
PCMark 10 - Quick Storage - Totaalscore 2.025
Testconfiguratie
  • Windows benchmarks
PCMark 10 - Quick Storage - Totaalscore - Bandbreedte 250,27
Testconfiguratie
  • Windows benchmarks
PCMark 10 - Quick Storage - Totaalscore - Toegangstijd 64
Testconfiguratie
  • Windows benchmarks

Platform onafhankelijke tests

Opstarttijd 14,7 sec.
Testconfiguratie
  • Platform onafhankelijke tests
JetStream 2 253,126
Testconfiguratie
  • Platform onafhankelijke tests
webXPRT 3 378
Testconfiguratie
  • Platform onafhankelijke tests
webXPRT 3 - Photo Enhancement 231 ms
Testconfiguratie
  • Platform onafhankelijke tests
webXPRT 3 - Organize Album using AI 1.668 ms
Testconfiguratie
  • Platform onafhankelijke tests
webXPRT 3 - Stock Option Pricing 77 ms
Testconfiguratie
  • Platform onafhankelijke tests
webXPRT 3 - Encrypt Notes and OCR Scan 877 ms
Testconfiguratie
  • Platform onafhankelijke tests
webXPRT 3 - Sales Graphs 237 ms
Testconfiguratie
  • Platform onafhankelijke tests
webXPRT 3 - Online Homework 699 ms
Testconfiguratie
  • Platform onafhankelijke tests
Geekbench 5 - Multi 7.350
Testconfiguratie
  • Platform onafhankelijke tests
Geekbench 5 - Multi Crypto 5.662
Testconfiguratie
  • Platform onafhankelijke tests
Geekbench 5 - Multi Integer 7.088
Testconfiguratie
  • Platform onafhankelijke tests
Geekbench 5 - Multi Floating Point 8.200
Testconfiguratie
  • Platform onafhankelijke tests
Geekbench 5 - Single 1.545
Testconfiguratie
  • Platform onafhankelijke tests
Geekbench 5 - Single Crypto 3.696
Testconfiguratie
  • Platform onafhankelijke tests
Geekbench 5 - Single Integer 1.341
Testconfiguratie
  • Platform onafhankelijke tests
Geekbench 5 - Single Floating Point 1.630
Testconfiguratie
  • Platform onafhankelijke tests
Geekbench 5 - OpenCL 46.430
Testconfiguratie
  • Platform onafhankelijke tests
WiFi speedtest 2.4GHz receive 230 Mbit/s
Testconfiguratie
  • Platform onafhankelijke tests
WiFi speedtest 2.4GHz send 158 Mbit/s
Testconfiguratie
  • Platform onafhankelijke tests
WiFi speedtest 5.0GHz receive 642 Mbit/s
Testconfiguratie
  • Platform onafhankelijke tests
WiFi speedtest 5.0GHz send 671 Mbit/s
Testconfiguratie
  • Platform onafhankelijke tests

Windows benchmarks

3DMark - Fire Strike 8.644
Testconfiguratie
  • Windows benchmarks
3DMark - Fire Strike Graphics 9.838
Testconfiguratie
  • Windows benchmarks
3DMark - Fire Strike Physics 21.236
Testconfiguratie
  • Windows benchmarks
3DMark - Fire Strike Combined 3.088
Testconfiguratie
  • Windows benchmarks
3DMark - Fire Strike Extreme 4.419
Testconfiguratie
  • Windows benchmarks
3DMark - Time Spy 3.878
Testconfiguratie
  • Windows benchmarks
3DMark - Time Spy Graphics 3.566
Testconfiguratie
  • Windows benchmarks
3DMark - Time Spy CPU 7.702
Testconfiguratie
  • Windows benchmarks
3DMark - Night Raid 30.768
Testconfiguratie
  • Windows benchmarks
3DMark - Night Raid Graphics 43.446
Testconfiguratie
  • Windows benchmarks
3DMark - Night Raid CPU 11.595
Testconfiguratie
  • Windows benchmarks
Cinebench R15 - Single 237
Testconfiguratie
  • Windows benchmarks
Cinebench R15 - Multi 1.614
Testconfiguratie
  • Windows benchmarks
Cinebench R20 - Single 634
Testconfiguratie
  • Windows benchmarks
Cinebench R20 - Multi 3.993
Testconfiguratie
  • Windows benchmarks
Cinebench R23 - Single 1.652
Testconfiguratie
  • Windows benchmarks
Cinebench R23 - Multi 10.260
Testconfiguratie
  • Windows benchmarks
Blender duurtest run #1 26,33
Testconfiguratie
  • Windows benchmarks
Blender duurtest run #2 28
Testconfiguratie
  • Windows benchmarks
Blender duurtest run #3 27,82
Testconfiguratie
  • Windows benchmarks
Blender duurtest run #4 27,4
Testconfiguratie
  • Windows benchmarks
Blender duurtest run #5 27,43
Testconfiguratie
  • Windows benchmarks
Blender duurtest run #6 27,48
Testconfiguratie
  • Windows benchmarks
Blender duurtest run #7 27,58
Testconfiguratie
  • Windows benchmarks
Blender duurtest run #8 27,58
Testconfiguratie
  • Windows benchmarks
Blender duurtest run #9 27,63
Testconfiguratie
  • Windows benchmarks
Blender duurtest run #10 27,67
Testconfiguratie
  • Windows benchmarks
Blender duurtest run #11 27,73
Testconfiguratie
  • Windows benchmarks
Blender duurtest run #12 27,64
Testconfiguratie
  • Windows benchmarks
Blender duurtest run #13 27,69
Testconfiguratie
  • Windows benchmarks
Blender duurtest run #14 27,83
Testconfiguratie
  • Windows benchmarks
Blender duurtest run #15 27,85
Testconfiguratie
  • Windows benchmarks
Blender duurtest run #16 27,82
Testconfiguratie
  • Windows benchmarks
Blender duurtest run #17 27,75
Testconfiguratie
  • Windows benchmarks
Blender duurtest run #18 27,94
Testconfiguratie
  • Windows benchmarks
Blender duurtest run #19 27,81
Testconfiguratie
  • Windows benchmarks
Blender duurtest run #20 27,79
Testconfiguratie
  • Windows benchmarks
Blender duurtest run #21 27,91
Testconfiguratie
  • Windows benchmarks
Blender duurtest run #22 27,94
Testconfiguratie
  • Windows benchmarks
Blender duurtest run #23 28,03
Testconfiguratie
  • Windows benchmarks
Blender duurtest run #24 27,97
Testconfiguratie
  • Windows benchmarks
Blender duurtest run #25 27,93
Testconfiguratie
  • Windows benchmarks
Blender duurtest run #26 28,09
Testconfiguratie
  • Windows benchmarks
Blender duurtest run #27 28,02
Testconfiguratie
  • Windows benchmarks
Blender duurtest run #28 28
Testconfiguratie
  • Windows benchmarks
Blender duurtest run #29 28,19
Testconfiguratie
  • Windows benchmarks
Blender duurtest run #30 28,15
Testconfiguratie
  • Windows benchmarks
Blender duurtest run #31 28,05
Testconfiguratie
  • Windows benchmarks
Blender duurtest run #32 27,98
Testconfiguratie
  • Windows benchmarks
Blender duurtest run #33 28,05
Testconfiguratie
  • Windows benchmarks
Blender duurtest run #34 28,06
Testconfiguratie
  • Windows benchmarks
Blender duurtest run #35 27,96
Testconfiguratie
  • Windows benchmarks
Blender duurtest run #36 27,97
Testconfiguratie
  • Windows benchmarks
Blender duurtest run #37 28,2
Testconfiguratie
  • Windows benchmarks
Blender duurtest run #38 28,13
Testconfiguratie
  • Windows benchmarks
Blender duurtest run #39 28,16
Testconfiguratie
  • Windows benchmarks
Blender duurtest run #40 28,06
Testconfiguratie
  • Windows benchmarks
Blender duurtest run #41 28,15
Testconfiguratie
  • Windows benchmarks
Blender duurtest run #42 28,14
Testconfiguratie
  • Windows benchmarks
Blender duurtest run #43 28,15
Testconfiguratie
  • Windows benchmarks
PCMark 10 Extended 6.437
Testconfiguratie
  • Windows benchmarks
PCMark 10 Essentials 10.055
Testconfiguratie
  • Windows benchmarks
PCMark 10 App Start-up 13.678
Testconfiguratie
  • Windows benchmarks
PCMark 10 Video Conferencing 8.068
Testconfiguratie
  • Windows benchmarks
PCMark 10 Web Browsing 9.214
Testconfiguratie
  • Windows benchmarks
PCMark 10 Productivity 9.498
Testconfiguratie
  • Windows benchmarks
PCMark 10 Spreadsheets 11.852
Testconfiguratie
  • Windows benchmarks
PCMark 10 Writing 7.612
Testconfiguratie
  • Windows benchmarks
PCMark 10 Digital Content Creation 7.016
Testconfiguratie
  • Windows benchmarks
PCMark 10 Photo Editing 7.045
Testconfiguratie
  • Windows benchmarks
PCMark 10 Rendering and Visualization 8.762
Testconfiguratie
  • Windows benchmarks
PCMark 10 Video Editing 5.596
Testconfiguratie
  • Windows benchmarks
PCMark 10 Gaming 6.927
Testconfiguratie
  • Windows benchmarks
PCMark 10 Graphics 9.383
Testconfiguratie
  • Windows benchmarks
PCMark 10 Physics 20.168
Testconfiguratie
  • Windows benchmarks
PCMark 10 Combined 3.029
Testconfiguratie
  • Windows benchmarks

Energieverbruik / Accu

Energieverbruik uit 0,5 W
Testconfiguratie
  • Windows benchmarks
Energieverbruik adapter (zonder laptop) 0 W
Testconfiguratie
  • Windows benchmarks
Energieverbruik idle 6,7 W
Testconfiguratie
  • Windows benchmarks
Browser accutest - 180 cd/m2 441 min.
Testconfiguratie
  • Windows benchmarks
PCMark 10 Accu Digital 2.588
Testconfiguratie
  • Windows benchmarks
PCMark 10 Accu Essentials 4.178
Testconfiguratie
  • Windows benchmarks
PCMark 10 Accu Productivity 3.635
Testconfiguratie
  • Windows benchmarks
PCMark 10 Accu Duration in Minuten 113
Testconfiguratie
  • Windows benchmarks
PCMark 10 Accu Aantal Runs 5
Testconfiguratie
  • Windows benchmarks

Testresultaten beeldscherm

Gemeten kleurruimte sRGB
Testconfiguratie
  • Beeldscherm test SpectraCal CALman 5.13
Kleurtemperatuur 6.289 K
Testconfiguratie
  • Beeldscherm test SpectraCal CALman 5.13
Afwijking kleurtemperatuur wit van 6504K 215 K
Testconfiguratie
  • Beeldscherm test SpectraCal CALman 5.13
Gemiddelde kleurtemperatuur 6.286 K
Testconfiguratie
  • Beeldscherm test SpectraCal CALman 5.13
Afwijking gemiddelde kleurtemperatuur van 6504K 218 K
Testconfiguratie
  • Beeldscherm test SpectraCal CALman 5.13
Helderheid wit 151 cd/m²
Testconfiguratie
  • Beeldscherm test SpectraCal CALman 5.13
Helderheid zwart 0,08 cd/m²
Testconfiguratie
  • Beeldscherm test SpectraCal CALman 5.13
Contrast 1.893,5 : 1
Testconfiguratie
  • Beeldscherm test SpectraCal CALman 5.13
Checkerboard wit 347,08 cd/m²
Testconfiguratie
  • Beeldscherm test SpectraCal CALman 5.13
Checkerboard zwart 0,193 cd/m²
Testconfiguratie
  • Beeldscherm test SpectraCal CALman 5.13
Checkerboard contrast 1.798 : 1
Testconfiguratie
  • Beeldscherm test SpectraCal CALman 5.13
Gamma 2,15
Testconfiguratie
  • Beeldscherm test SpectraCal CALman 5.13
Gamma (afwijking van 2,2) 0,05
Testconfiguratie
  • Beeldscherm test SpectraCal CALman 5.13
Gemiddelde kleurafwijking (Delta E 2000) 1,3 mΔuv
Testconfiguratie
  • Beeldscherm test SpectraCal CALman 5.13
Gemiddelde kleurafwijking ΔE ITP 3,61 Δuv
Testconfiguratie
  • Beeldscherm test SpectraCal CALman 5.13
Gemiddelde gedetailleerde kleur-afwijking ΔE 2000 1,3 Δuv
Testconfiguratie
  • Beeldscherm test SpectraCal CALman 5.13
Gemiddelde gedetailleerde kleur-afwijking ΔE ITP 3,62 Δuv
Testconfiguratie
  • Beeldscherm test SpectraCal CALman 5.13
Gemiddelde grijsafwijking (Delta E 2000) 2,1 mΔuv
Testconfiguratie
  • Beeldscherm test SpectraCal CALman 5.13
Gemiddelde grijsafwijking ΔE ITP 4,92 Δuv
Testconfiguratie
  • Beeldscherm test SpectraCal CALman 5.13
sRGB dekking 98,3 %
Testconfiguratie
  • Beeldscherm test SpectraCal CALman 5.13
DCI-P3 dekking 75,4 %
Testconfiguratie
  • Beeldscherm test SpectraCal CALman 5.13
Rec 2020 dekking 54,1 %
Testconfiguratie
  • Beeldscherm test SpectraCal CALman 5.13
0