

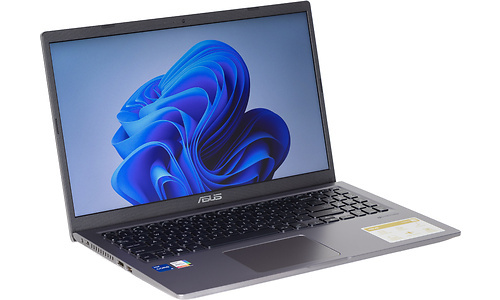
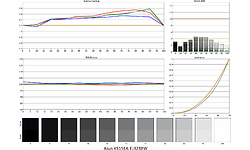
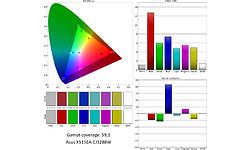
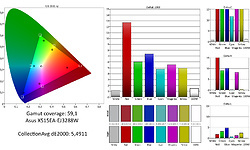
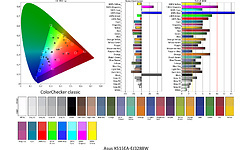
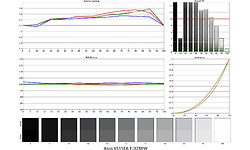
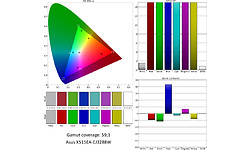
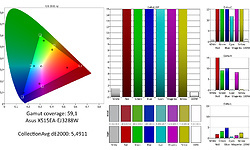
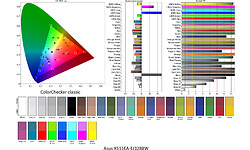
Asus X515EA-EJ3288W


| Processor type | Intel Core i5 1135G7 |
| Geheugen capaciteit | 16 GB |
| Scherm diagonaal | 15,6 inch |
| Resolutie | 1920x1080 |
| Touchscreen | |
| GPU type | Intel Iris Xe Graphics G7 (Tiger Lake 80 EU) |
| Totale opslagcapaciteit | 512 GB |
| Toetsenbordindeling | Qwerty |
| Gewicht totaal | 1,67 kg |
| Besturingssysteem (serie) | Windows |
| Processor serie | Intel Core i5 |
| Processor type | Intel Core i5 1135G7 |
| Processor klokfrequentie | 2,4 GHz |
| Processor klokfrequentie (max. turbo) | 4,1 GHz |
| Configureerbare TDP-down | 12 W |
| Configureerbare TDP-up | 28 W |
| Configureerbare TDP-downfrequentie | 1 GHz |
| Configureerbare TDP-upfrequentie | 2 GHz |
| Aantal processorcores | 4 |
| Geheugen capaciteit | 16 GB |
| Type geheugen | DDR4 |
| Geheugen klokfrequentie | 3.200 MHz |
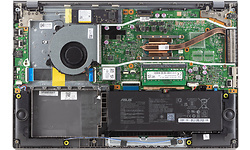
| Geheugen form factor | On-board + Sodimm |
| SODIMM sloten | 1 |
| Vrije SODIMM sloten | 0 |
| Werkgeheugen uitbreidbaar tot | 16 GB |
| Scherm diagonaal | 15,6 inch |
| Resolutie | 1920x1080 |
| Verhouding | 16:9 |
| Pixeldichtheid | 141 ppi |
| Scherm type (mat/glans) | Mat |
| Paneeltype | IPS |
| LED-achtergrondverlichting | |
| Touchscreen | |
| Maximale verversingsfrequentie | 60 Hz |
| GPU type | Intel Iris Xe Graphics G7 (Tiger Lake 80 EU) |
| Geïntegreerde / losse GPU | Geïntegreerd |
| Totale opslagcapaciteit | 512 GB |
| SSD opslagcapaciteit | 512 GB |
| Beschikbaar opslaggeheugen | 429 GB |
| Aantal harddisks / SSD's | 1 |
| Harddisk/SSD 1 capaciteit | 429 GB |
| Harddisk/SSD 1 soort | SSD/Flash |
| Harddisk/SSD 1 form factor | M.2 |
| Harddisk/SSD 1 merk/product | Micron_2400_MTFDKBA512QFM |
| DVD branden | |
| Blu-ray lezen | |
| Blu-ray branden |
| Netwerkaansluiting (bedraad) | |
| WiFi standaard | 802.11ac (Wi-Fi 5) |
| WiFi adapter | Realtek 8821CE Wireless LAN 802.11ac PCI-E NIC |
| Bluetooth | |
| Bluetooth-versie | Bluetooth 5.0 |
| 4G (LTE) | |
| 5G |
| Smartcard | |
| USB 2.0 (Type-A) | 2 |
| USB 3.2 - 5 Gb/s (Type-A) | 1 |
| USB 3.2 - 5 Gb/s (Type-C) | 1 |
| Cardreader - SD | |
| Cardreader - MicroSD | |
| DVI-uitgang | |
| VGA-uitgang | |
| HDMI-uitgang | |
| Aantal HDMI-uitgangen | 1 |
| Micro HDMI-uitgang | |
| HDMI-versie | 1.4 |
| DisplayPort-uitgang | |
| Mini DisplayPort-uitgang | |
| Analoge audio aansluitingen | 1 |
| Aansluiting dockingstation | |
| Kensingtonslot |
| Toetsenbordindeling | Qwerty |
| Numeriek toetsenbord | |
| Touchpad afzonderlijke muistoetsen |
| Webcam | |
| Webcam resolutie | 0,9 MPixel |
| Tweede camera | |
| Flitser | |
| Camera Windows Hello compatible | |
| Webcamschuifje |
| Accelerometer | |
| Vingerafdruklezer | |
| NFC |
| Trusted Platform Module (TPM) | |
| Geïntegreerde microfoon |
| Accu capaciteit (Wh) | 37,1 Wh |
| Verwisselbare accu | |
| Gewicht totaal | 1,67 kg |
| Afmeting - Breedte | 36 cm |
| Afmeting - Diepte | 23,5 cm |
| Afmeting - Hoogte/Dikte | 2,34 cm |
| Passief gekoeld |
| Besturingssysteem | Microsoft Windows 11 Home |
| Besturingssysteem (serie) | Windows |
| Windows versie | 22H2 |
| Windows OS Build | 22.621,213 |
| Aantal bits OS | 64 bit |
| Garantie | 2 jaar |
| Geekbench 6.1.0 - Multi | 3.561 |
| Geekbench 6.1.0 - Multi Integer | 3.403 |
| Geekbench 6.1.0 - Multi Floating Point | 3.875 |
| Geekbench 6.1.0 - Single | 1.890 |
| Geekbench 6.1.0 - Single Integer | 1.891 |
| Geekbench 6.1.0 - Single Floating Point | 1.887 |
| Geekbench 6.1.0 - Compute | 8.725 |
| SKU | 90NB0TY1-M03A50, X515EA-EJ3288W, 90NB0TY1-M04L80 | |
| EAN | 4711387002452 | |
| Toegevoegd aan Hardware Info | maandag 9 januari 2023 |
| PCMark 10 - Gebruiken Adobe Photoshop Heavy | 527 |
Testconfiguratie
|
|
| PCMark 10 - Storage - Totaalscore - Toegangstijd | 98 |
Testconfiguratie
|
|
| PCMark 10 - Storage - Totaalscore - Bandbreedte | 274,96 |
|
|
| PCMark 10 - Storage - Totaalscore | 1.715 |
Testconfiguratie
|
|
| PCMark 10 - 2.37GB_(399_JPEGs)_leestest | 326 |
|
|
| PCMark 10 - 2.37GB_(399_JPEGs)_kopieertest | 474 |
Testconfiguratie
|
|
| PCMark 10 - 2.37GB_(399_JPEGs)_schrijftest | 300 |
Testconfiguratie
|
|
| PCMark 10 - 2GB_(4_ISOs)_leestest | 1.843 |
Testconfiguratie
|
|
| PCMark 10 - 2GB_(4_ISOs)_kopieertest | 1.313 |
Testconfiguratie
|
|
| PCMark 10 - 2GB_(4_ISOs)_schrijftest | 1.466 |
Testconfiguratie
|
|
| PCMark 10 - Gebruiken Microsoft PowerPoint | 82 |
Testconfiguratie
|
|
| PCMark 10 - Gebruiken Microsoft Excel | 107 |
Testconfiguratie
|
|
| PCMark 10 - Gebruiken Adobe Photoshop Light | 191 |
Testconfiguratie
|
|
| PCMark 10 - Starten Windows 10 | 252 |
Testconfiguratie
|
|
| PCMark 10 - Gebruiken Adobe InDesign | 118 |
Testconfiguratie
|
|
| PCMark 10 - Gebruiken Adobe Illustrator | 149 |
|
|
| PCMark 10 - Gebruiken Adobe After Effects | 287 |
Testconfiguratie
|
|
| PCMark 10 - Starten Overwatch | 263 |
Testconfiguratie
|
|
| PCMark 10 - Starten Call of Duty: Black Ops 4 | 465 |
Testconfiguratie
|
|
| PCMark 10 - Starten Battlefield V | 534 |
Testconfiguratie
|
|
| PCMark 10 - Starten Adobe Photoshop | 152 |
Testconfiguratie
|
|
| PCMark 10 - Starten Adobe Lightroom | 114 |
Testconfiguratie
|
|
| PCMark 10 - Starten Adobe Premiere_Pro | 175 |
Testconfiguratie
|
|
| PCMark 10 - Starten Adobe Illustrator | 123 |
Testconfiguratie
|
|
| PCMark 10 - Starten Adobe After Effects | 158 |
Testconfiguratie
|
|
| PCMark 10 - Starten Adobe Acrobat | 169 |
Testconfiguratie
|
|
| PCMark 10 - Quick Storage - Totaalscore | 1.842 |
Testconfiguratie
|
|
| PCMark 10 - Quick Storage - Totaalscore - Bandbreedte | 226,55 |
Testconfiguratie
|
|
| PCMark 10 - Quick Storage - Totaalscore - Toegangstijd | 70 |
Testconfiguratie
|

