Getest

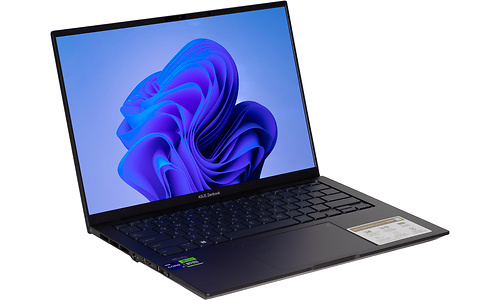
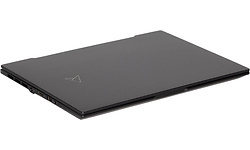
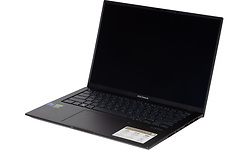
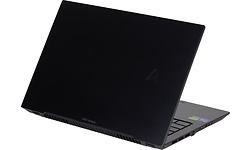
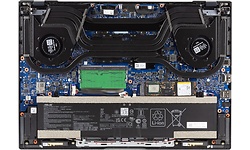
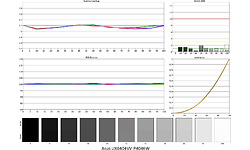
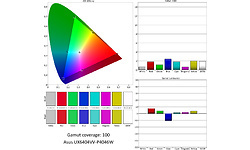
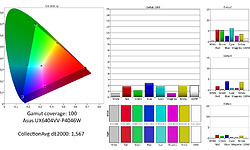
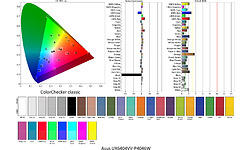
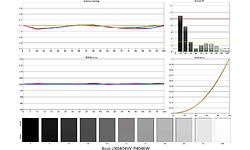
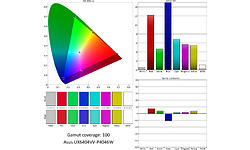
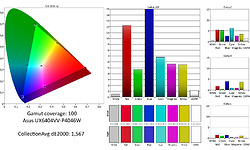
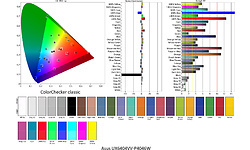
Asus Zenbook Pro 14 OLED UX6404VV-P4046W

Prijsverloop

Specificaties

Belangrijkste specificaties

Processor type Intel Core i9 13900H
Geheugen capaciteit 32 GB
Scherm diagonaal 14,5 inch
Resolutie 2880x1800
Touchscreen
GPU type Nvidia GeForce RTX 4060 Laptop GPU
Totale opslagcapaciteit 1.024 GB
Toetsenbordindeling Qwerty
Gewicht totaal 1,61 kg
Besturingssysteem (serie) Windows

Processor / Chipset / Geheugen

Processor serie Intel Core i9
Processor type Intel Core i9 13900H
Processor klokfrequentie 2,6 GHz
Processor klokfrequentie (max. turbo) 5,4 GHz
Configureerbare TDP-down 35 W
Configureerbare TDP-up 115 W
Aantal processorcores 14
Geheugen capaciteit 32 GB
Type geheugen DDR5
Geheugen klokfrequentie 4.800 MHz
Geheugen form factor On-board + Sodimm
SODIMM sloten 1
Vrije SODIMM sloten 0
Werkgeheugen uitbreidbaar tot 48 GB

Scherm

Scherm diagonaal 14,5 inch
Resolutie 2880x1800
Verhouding 16:10
Pixeldichtheid 234 ppi
Scherm type (mat/glans) Glanzend
Paneeltype OLED
Touchscreen
Maximale verversingsfrequentie 120 Hz

Graphics

GPU type Nvidia GeForce RTX 4060 Laptop GPU
Geïntegreerde / losse GPU Losse chip
Videogeheugen 8 GB

Opslag

Totale opslagcapaciteit 1.024 GB
SSD opslagcapaciteit 1.024 GB
Beschikbaar opslaggeheugen 884,9 GB
Aantal harddisks / SSD's 1
Harddisk/SSD 1 capaciteit 884,9 GB
Harddisk/SSD 1 soort SSD/Flash
Harddisk/SSD 1 form factor M.2
Harddisk/SSD 1 merk/product Micron_3400_MTFDKBA1T0TFH
DVD branden
Blu-ray lezen
Blu-ray branden

Connectiviteit / Netwerk

Netwerkaansluiting (bedraad)
WiFi standaard 802.11ax (Wi-Fi 6E)
WiFi adapter Intel(R) Wi-Fi 6E AX211 160Mhz
Bluetooth
Bluetooth-versie Bluetooth 5.3
4G (LTE)
5G

Aansluitingen

Smartcard
USB 3.2 - 10 Gb/s (Type-A) 1
USB 3.2 - 10 Gb/s (Type-C) 1
Thunderbolt 4 (Type-C) 1
Cardreader - SD
Cardreader - MicroSD
DVI-uitgang
VGA-uitgang
HDMI-uitgang
Aantal HDMI-uitgangen 1
Micro HDMI-uitgang
HDMI-versie 2.1
DisplayPort-uitgang
Mini DisplayPort-uitgang
Analoge audio aansluitingen 1
Aansluiting dockingstation
Kensingtonslot

Toetsenbord en touchpad

Toetsenbordindeling Qwerty
Numeriek toetsenbord
Toetsenbordverlichting helderheidsniveaus 3
Toetsenbordverlichting kleur Wit
Touchpad afzonderlijke muistoetsen

Camera

Webcam
Webcam resolutie 2,1 MPixel
Tweede camera
Flitser
Camera Windows Hello compatible
Webcamschuifje

Sensors

Accelerometer
Vingerafdruklezer
NFC

Overige hardware

Trusted Platform Module (TPM)
Geïntegreerde microfoon

Maten en gewichten

Accu capaciteit (Wh) 76 Wh
Verwisselbare accu
Gewicht totaal 1,61 kg
Afmeting - Breedte 32,2 cm
Afmeting - Diepte 22,3 cm
Afmeting - Hoogte/Dikte 2,18 cm
Passief gekoeld

Software

Besturingssysteem Microsoft Windows 11 Home
Besturingssysteem (serie) Windows
Windows versie 22H2
Windows OS Build 22.621,185
Aantal bits OS 64 bit

Fabrikantsopgave eigenschappen

Garantie 1 jaar

Productcodes

SKU 90NB11J2-M001S0, UX6404VV-P4046W
EAN 4711387020685
Toegevoegd aan Hardware Info dinsdag 13 juni 2023

Testresultaten

Dit product is door Hardware Info getest op vrijdag 30 juni 2023.

Metro Exodus

Metro Exodus - 1920x1080 - Medium 116,7 fps
Testconfiguratie
  • Game benchmarks 2022
Metro Exodus - 1920x1080 - Medium (99p) 18,24 ms
Testconfiguratie
  • Game benchmarks 2022
Metro Exodus - 1920x1080 - Medium (99.9p) 21,64 ms
Testconfiguratie
  • Game benchmarks 2022
Metro Exodus - 1920x1080 - Ultra 71,9 fps
Testconfiguratie
  • Game benchmarks 2022
Metro Exodus - 1920x1080 - Ultra (99p) 26,2 ms
Testconfiguratie
  • Game benchmarks 2022
Metro Exodus - 1920x1080 - Ultra (99.9p) 29,23 ms
Testconfiguratie
  • Game benchmarks 2022
Metro Exodus - 2560x1440 - Medium 84,7 fps
Testconfiguratie
  • Game benchmarks 2022
Metro Exodus - 2560x1440 - Medium (99p) 20,89 ms
Testconfiguratie
  • Game benchmarks 2022
Metro Exodus - 2560x1440 - Medium (99.9p) 24,98 ms
Testconfiguratie
  • Game benchmarks 2022
Metro Exodus - 2560x1440 - Ultra 54,8 fps
Testconfiguratie
  • Game benchmarks 2022
Metro Exodus - 2560x1440 - Ultra (99p) 31,13 ms
Testconfiguratie
  • Game benchmarks 2022
Metro Exodus - 2560x1440 - Ultra (99.9p) 36,09 ms
Testconfiguratie
  • Game benchmarks 2022
Metro Exodus - 3840x2160 - Medium 46,9 fps
Testconfiguratie
  • Game benchmarks 2022
Metro Exodus - 3840x2160 - Medium (99p) 33,49 ms
Testconfiguratie
  • Game benchmarks 2022
Metro Exodus - 3840x2160 - Medium (99.9p) 35,76 ms
Testconfiguratie
  • Game benchmarks 2022
Metro Exodus - 3840x2160 - Ultra 28,8 fps
Testconfiguratie
  • Game benchmarks 2022
Metro Exodus - 3840x2160 - Ultra (99p) 45,53 ms
Testconfiguratie
  • Game benchmarks 2022
Metro Exodus - 3840x2160 - Ultra (99.9p) 66,55 ms
Testconfiguratie
  • Game benchmarks 2022
Metro Exodus - 1920x1080 - Ultra (DXR - High) 59,5 fps
Testconfiguratie
  • Game benchmarks 2022
Metro Exodus - 1920x1080 - Ultra (DXR - High) (99p) 28,8 ms
Testconfiguratie
  • Game benchmarks 2022
Metro Exodus - 1920x1080 - Ultra (DXR - High) (99.9p) 35,72 ms
Testconfiguratie
  • Game benchmarks 2022
Metro Exodus - 2560x1440 - Ultra (DXR - High) 42,1 fps
Testconfiguratie
  • Game benchmarks 2022
Metro Exodus - 2560x1440 - Ultra (DXR - High) (99p) 36,91 ms
Testconfiguratie
  • Game benchmarks 2022
Metro Exodus - 2560x1440 - Ultra (DXR - High) (99.9p) 54,35 ms
Testconfiguratie
  • Game benchmarks 2022

Total War: Troy

Total War: Troy - 1920x1080 - Medium 200,4 fps
Testconfiguratie
  • Game benchmarks 2022
Total War: Troy - 1920x1080 - Medium (99p) 5,97 ms
Testconfiguratie
  • Game benchmarks 2022
Total War: Troy - 1920x1080 - Medium (99.9p) 6,36 ms
Testconfiguratie
  • Game benchmarks 2022
Total War: Troy - 1920x1080 - Ultra 97,7 fps
Testconfiguratie
  • Game benchmarks 2022
Total War: Troy - 1920x1080 - Ultra (99p) 12,65 ms
Testconfiguratie
  • Game benchmarks 2022
Total War: Troy - 1920x1080 - Ultra (99.9p) 13,73 ms
Testconfiguratie
  • Game benchmarks 2022
Total War: Troy - 2560x1440 - Medium 138 fps
Testconfiguratie
  • Game benchmarks 2022
Total War: Troy - 2560x1440 - Medium (99p) 8,41 ms
Testconfiguratie
  • Game benchmarks 2022
Total War: Troy - 2560x1440 - Medium (99.9p) 8,83 ms
Testconfiguratie
  • Game benchmarks 2022
Total War: Troy - 2560x1440 - Ultra 71,4 fps
Testconfiguratie
  • Game benchmarks 2022
Total War: Troy - 2560x1440 - Ultra (99p) 16,8 ms
Testconfiguratie
  • Game benchmarks 2022
Total War: Troy - 2560x1440 - Ultra (99.9p) 17,96 ms
Testconfiguratie
  • Game benchmarks 2022
Total War: Troy - 3840x2160 - Medium 72,5 fps
Testconfiguratie
  • Game benchmarks 2022
Total War: Troy - 3840x2160 - Medium (99p) 15,65 ms
Testconfiguratie
  • Game benchmarks 2022
Total War: Troy - 3840x2160 - Medium (99.9p) 16,14 ms
Testconfiguratie
  • Game benchmarks 2022
Total War: Troy - 3840x2160 - Ultra 39,5 fps
Testconfiguratie
  • Game benchmarks 2022
Total War: Troy - 3840x2160 - Ultra (99p) 29,88 ms
Testconfiguratie
  • Game benchmarks 2022
Total War: Troy - 3840x2160 - Ultra (99.9p) 31,88 ms
Testconfiguratie
  • Game benchmarks 2022

Far Cry: New Dawn

Far Cry: New Dawn - 1920x1080 - Medium 115,8 fps
Testconfiguratie
  • Game benchmarks 2022
Far Cry: New Dawn - 1920x1080 - Medium (99p) 11,93 ms
Testconfiguratie
  • Game benchmarks 2022
Far Cry: New Dawn - 1920x1080 - Medium (99.9p) 13,78 ms
Testconfiguratie
  • Game benchmarks 2022
Far Cry: New Dawn - 1920x1080 - Ultra 132,9 fps
Testconfiguratie
  • Game benchmarks 2022
Far Cry: New Dawn - 1920x1080 - Ultra (99p) 10,23 ms
Testconfiguratie
  • Game benchmarks 2022
Far Cry: New Dawn - 1920x1080 - Ultra (99.9p) 11,91 ms
Testconfiguratie
  • Game benchmarks 2022
Far Cry: New Dawn - 2560x1440 - Medium 111 fps
Testconfiguratie
  • Game benchmarks 2022
Far Cry: New Dawn - 2560x1440 - Medium (99p) 11,85 ms
Testconfiguratie
  • Game benchmarks 2022
Far Cry: New Dawn - 2560x1440 - Medium (99.9p) 14,4 ms
Testconfiguratie
  • Game benchmarks 2022
Far Cry: New Dawn - 2560x1440 - Ultra 93,4 fps
Testconfiguratie
  • Game benchmarks 2022
Far Cry: New Dawn - 2560x1440 - Ultra (99p) 14,83 ms
Testconfiguratie
  • Game benchmarks 2022
Far Cry: New Dawn - 2560x1440 - Ultra (99.9p) 18,09 ms
Testconfiguratie
  • Game benchmarks 2022
Far Cry: New Dawn - 3840x2160 - Medium 57,5 fps
Testconfiguratie
  • Game benchmarks 2022
Far Cry: New Dawn - 3840x2160 - Medium (99p) 21,8 ms
Testconfiguratie
  • Game benchmarks 2022
Far Cry: New Dawn - 3840x2160 - Medium (99.9p) 23,33 ms
Testconfiguratie
  • Game benchmarks 2022
Far Cry: New Dawn - 3840x2160 - Ultra 49 fps
Testconfiguratie
  • Game benchmarks 2022
Far Cry: New Dawn - 3840x2160 - Ultra (99p) 25,47 ms
Testconfiguratie
  • Game benchmarks 2022
Far Cry: New Dawn - 3840x2160 - Ultra (99.9p) 27,85 ms
Testconfiguratie
  • Game benchmarks 2022

F1 2020

F1 2020 (DX12) - 1920x1080 - Medium 258,2 fps
Testconfiguratie
  • Game benchmarks 2022
F1 2020 (DX12) - 1920x1080 - Medium (99p) 5,6 ms
Testconfiguratie
  • Game benchmarks 2022
F1 2020 (DX12) - 1920x1080 - Medium (99.9p) 7,4 ms
Testconfiguratie
  • Game benchmarks 2022
F1 2020 (DX12) - 1920x1080 - Ultra 180,9 fps
Testconfiguratie
  • Game benchmarks 2022
F1 2020 (DX12) - 1920x1080 - Ultra (99p) 7,6 ms
Testconfiguratie
  • Game benchmarks 2022
F1 2020 (DX12) - 1920x1080 - Ultra (99.9p) 10,9 ms
Testconfiguratie
  • Game benchmarks 2022
F1 2020 (DX12) - 2560x1440 - Medium 196,9 fps
Testconfiguratie
  • Game benchmarks 2022
F1 2020 (DX12) - 2560x1440 - Medium (99p) 6,3 ms
Testconfiguratie
  • Game benchmarks 2022
F1 2020 (DX12) - 2560x1440 - Medium (99.9p) 7,5 ms
Testconfiguratie
  • Game benchmarks 2022
F1 2020 (DX12) - 2560x1440 - Ultra 129,4 fps
Testconfiguratie
  • Game benchmarks 2022
F1 2020 (DX12) - 2560x1440 - Ultra (99p) 9,8 ms
Testconfiguratie
  • Game benchmarks 2022
F1 2020 (DX12) - 2560x1440 - Ultra (99.9p) 11,3 ms
Testconfiguratie
  • Game benchmarks 2022
F1 2020 (DX12) - 3840x2160 - Medium 109,4 fps
Testconfiguratie
  • Game benchmarks 2022
F1 2020 (DX12) - 3840x2160 - Medium (99p) 10,6 ms
Testconfiguratie
  • Game benchmarks 2022
F1 2020 (DX12) - 3840x2160 - Medium (99.9p) 14,3 ms
Testconfiguratie
  • Game benchmarks 2022
F1 2020 (DX12) - 3840x2160 - Ultra 70,2 fps
Testconfiguratie
  • Game benchmarks 2022
F1 2020 (DX12) - 3840x2160 - Ultra (99p) 16,8 ms
Testconfiguratie
  • Game benchmarks 2022
F1 2020 (DX12) - 3840x2160 - Ultra (99.9p) 19,6 ms
Testconfiguratie
  • Game benchmarks 2022

Geluidstest

Noise floor 14 dB(A)
Testconfiguratie
  • Geluidsdichte ruimte 2021
  • Larson Davis SoundAdvisor Model 831C
Afstand geluidsmeting 50 cm
Testconfiguratie
  • Geluidsdichte ruimte 2021
  • Larson Davis SoundAdvisor Model 831C
WebXPRT 3 - LAeq 16,5 dB
Testconfiguratie
  • Geluidsdichte ruimte 2021
  • Larson Davis SoundAdvisor Model 831C
PCMark 10 Express - LAeq 29,5 dB
Testconfiguratie
  • Geluidsdichte ruimte 2021
  • Larson Davis SoundAdvisor Model 831C
Blender - LAeq 46,1 dB
Testconfiguratie
  • Geluidsdichte ruimte 2021
  • Larson Davis SoundAdvisor Model 831C
F1 2020 - LAeq 48,9 dB
Testconfiguratie
  • Geluidsdichte ruimte 2021
  • Larson Davis SoundAdvisor Model 831C

PCMark 10 Storage

PCMark 10 - Gebruiken Adobe Photoshop Heavy 712
Testconfiguratie
  • Windows benchmarks
PCMark 10 - Storage - Totaalscore - Toegangstijd 70
Testconfiguratie
  • Windows benchmarks
PCMark 10 - Storage - Totaalscore - Bandbreedte 380,26
PCMark 10 - Storage - Totaalscore 2.386
Testconfiguratie
  • Windows benchmarks
PCMark 10 - 2.37GB_(399_JPEGs)_leestest 529
PCMark 10 - 2.37GB_(399_JPEGs)_kopieertest 744
Testconfiguratie
  • Windows benchmarks
PCMark 10 - 2.37GB_(399_JPEGs)_schrijftest 485
Testconfiguratie
  • Windows benchmarks
PCMark 10 - 2GB_(4_ISOs)_leestest 2.548
Testconfiguratie
  • Windows benchmarks
PCMark 10 - 2GB_(4_ISOs)_kopieertest 2.310
Testconfiguratie
  • Windows benchmarks
PCMark 10 - 2GB_(4_ISOs)_schrijftest 2.381
Testconfiguratie
  • Windows benchmarks
PCMark 10 - Gebruiken Microsoft PowerPoint 139
Testconfiguratie
  • Windows benchmarks
PCMark 10 - Gebruiken Microsoft Excel 141
Testconfiguratie
  • Windows benchmarks
PCMark 10 - Gebruiken Adobe Photoshop Light 236
Testconfiguratie
  • Windows benchmarks
PCMark 10 - Starten Windows 10 316
Testconfiguratie
  • Windows benchmarks
PCMark 10 - Gebruiken Adobe InDesign 189
Testconfiguratie
  • Windows benchmarks
PCMark 10 - Gebruiken Adobe Illustrator 213
PCMark 10 - Gebruiken Adobe After Effects 376
Testconfiguratie
  • Windows benchmarks
PCMark 10 - Starten Overwatch 345
Testconfiguratie
  • Windows benchmarks
PCMark 10 - Starten Call of Duty: Black Ops 4 640
Testconfiguratie
  • Windows benchmarks
PCMark 10 - Starten Battlefield V 690
Testconfiguratie
  • Windows benchmarks
PCMark 10 - Starten Adobe Photoshop 175
Testconfiguratie
  • Windows benchmarks
PCMark 10 - Starten Adobe Lightroom 141
Testconfiguratie
  • Windows benchmarks
PCMark 10 - Starten Adobe Premiere_Pro 211
Testconfiguratie
  • Windows benchmarks
PCMark 10 - Starten Adobe Illustrator 167
Testconfiguratie
  • Windows benchmarks
PCMark 10 - Starten Adobe After Effects 189
Testconfiguratie
  • Windows benchmarks
PCMark 10 - Starten Adobe Acrobat 198
Testconfiguratie
  • Windows benchmarks
PCMark 10 - Quick Storage - Totaalscore 2.727
Testconfiguratie
  • Windows benchmarks
PCMark 10 - Quick Storage - Totaalscore - Bandbreedte 333,29
Testconfiguratie
  • Windows benchmarks
PCMark 10 - Quick Storage - Totaalscore - Toegangstijd 47
Testconfiguratie
  • Windows benchmarks

Platform onafhankelijke tests

Opstarttijd 14,38 sec.
Testconfiguratie
  • Platform onafhankelijke tests
JetStream 2 314,76
Testconfiguratie
  • Platform onafhankelijke tests
webXPRT 3 472
Testconfiguratie
  • Platform onafhankelijke tests
webXPRT 3 - Photo Enhancement 197 ms
Testconfiguratie
  • Platform onafhankelijke tests
webXPRT 3 - Organize Album using AI 1.382 ms
Testconfiguratie
  • Platform onafhankelijke tests
webXPRT 3 - Stock Option Pricing 62 ms
Testconfiguratie
  • Platform onafhankelijke tests
webXPRT 3 - Encrypt Notes and OCR Scan 722 ms
Testconfiguratie
  • Platform onafhankelijke tests
webXPRT 3 - Sales Graphs 179 ms
Testconfiguratie
  • Platform onafhankelijke tests
webXPRT 3 - Online Homework 532 ms
Testconfiguratie
  • Platform onafhankelijke tests
Geekbench 5 - Multi 14.455
Testconfiguratie
  • Platform onafhankelijke tests
Geekbench 5 - Multi Crypto 12.187
Testconfiguratie
  • Platform onafhankelijke tests
Geekbench 5 - Multi Integer 14.037
Testconfiguratie
  • Platform onafhankelijke tests
Geekbench 5 - Multi Floating Point 15.737
Testconfiguratie
  • Platform onafhankelijke tests
Geekbench 5 - Single 2.009
Testconfiguratie
  • Platform onafhankelijke tests
Geekbench 5 - Single Crypto 4.356
Testconfiguratie
  • Platform onafhankelijke tests
Geekbench 5 - Single Integer 1.777
Testconfiguratie
  • Platform onafhankelijke tests
Geekbench 5 - Single Floating Point 2.122
Testconfiguratie
  • Platform onafhankelijke tests
Geekbench 5 - OpenCL 100.950
Testconfiguratie
  • Platform onafhankelijke tests
WiFi speedtest 2.4GHz receive 231 Mbit/s
Testconfiguratie
  • Platform onafhankelijke tests
WiFi speedtest 2.4GHz send 159 Mbit/s
Testconfiguratie
  • Platform onafhankelijke tests
WiFi speedtest 5.0GHz receive 638 Mbit/s
Testconfiguratie
  • Platform onafhankelijke tests
WiFi speedtest 5.0GHz send 475 Mbit/s
Testconfiguratie
  • Platform onafhankelijke tests
Geekbench 6 - Multi 14.099
Testconfiguratie
  • Platform onafhankelijke tests
Geekbench 6 - Multi Integer 13.322
Testconfiguratie
  • Platform onafhankelijke tests
Geekbench 6 - Multi Floating Point 15.663
Testconfiguratie
  • Platform onafhankelijke tests
Geekbench 6 - Single 2.741
Testconfiguratie
  • Platform onafhankelijke tests
Geekbench 6 - Single Integer 2.728
Testconfiguratie
  • Platform onafhankelijke tests
Geekbench 6 - Single Floating Point 2.764
Testconfiguratie
  • Platform onafhankelijke tests
Geekbench 6 - OpenCL 92.523
Testconfiguratie
  • Platform onafhankelijke tests

Windows benchmarks

3DMark - Fire Strike 23.515
Testconfiguratie
  • Windows benchmarks
3DMark - Fire Strike Graphics 26.236
Testconfiguratie
  • Windows benchmarks
3DMark - Fire Strike Physics 29.743
Testconfiguratie
  • Windows benchmarks
3DMark - Fire Strike Combined 11.241
Testconfiguratie
  • Windows benchmarks
3DMark - Time Spy 10.267
Testconfiguratie
  • Windows benchmarks
3DMark - Time Spy Graphics 9.847
Testconfiguratie
  • Windows benchmarks
3DMark - Time Spy CPU 13.547
Testconfiguratie
  • Windows benchmarks
3DMark - Night Raid 47.555
Testconfiguratie
  • Windows benchmarks
3DMark - Night Raid Graphics 77.378
Testconfiguratie
  • Windows benchmarks
3DMark - Night Raid CPU 14.936
Testconfiguratie
  • Windows benchmarks
Cinebench R15 - Single 297
Testconfiguratie
  • Windows benchmarks
Cinebench R15 - Multi 3.034
Testconfiguratie
  • Windows benchmarks
Cinebench R20 - Single 781
Testconfiguratie
  • Windows benchmarks
Cinebench R20 - Multi 7.236
Testconfiguratie
  • Windows benchmarks
Cinebench R23 - Single 2.054
Testconfiguratie
  • Windows benchmarks
Cinebench R23 - Multi 18.914
Testconfiguratie
  • Windows benchmarks
Blender duurtest run #1 14,38
Testconfiguratie
  • Windows benchmarks
Blender duurtest run #2 15,08
Testconfiguratie
  • Windows benchmarks
Blender duurtest run #3 15,26
Testconfiguratie
  • Windows benchmarks
Blender duurtest run #4 15,36
Testconfiguratie
  • Windows benchmarks
Blender duurtest run #5 15,63
Testconfiguratie
  • Windows benchmarks
Blender duurtest run #6 15,44
Testconfiguratie
  • Windows benchmarks
Blender duurtest run #7 15,91
Testconfiguratie
  • Windows benchmarks
Blender duurtest run #8 16,98
Testconfiguratie
  • Windows benchmarks
Blender duurtest run #9 17,07
Testconfiguratie
  • Windows benchmarks
Blender duurtest run #10 17,09
Testconfiguratie
  • Windows benchmarks
Blender duurtest run #11 17,46
Testconfiguratie
  • Windows benchmarks
Blender duurtest run #12 17,51
Testconfiguratie
  • Windows benchmarks
Blender duurtest run #13 17,49
Testconfiguratie
  • Windows benchmarks
Blender duurtest run #14 17,59
Testconfiguratie
  • Windows benchmarks
Blender duurtest run #15 17,76
Testconfiguratie
  • Windows benchmarks
Blender duurtest run #16 17,86
Testconfiguratie
  • Windows benchmarks
Blender duurtest run #17 17,45
Testconfiguratie
  • Windows benchmarks
Blender duurtest run #18 17,51
Testconfiguratie
  • Windows benchmarks
Blender duurtest run #19 17,53
Testconfiguratie
  • Windows benchmarks
Blender duurtest run #20 17,61
Testconfiguratie
  • Windows benchmarks
Blender duurtest run #21 17,55
Testconfiguratie
  • Windows benchmarks
Blender duurtest run #22 17,47
Testconfiguratie
  • Windows benchmarks
Blender duurtest run #23 17,5
Testconfiguratie
  • Windows benchmarks
Blender duurtest run #24 17,59
Testconfiguratie
  • Windows benchmarks
Blender duurtest run #25 17,6
Testconfiguratie
  • Windows benchmarks
Blender duurtest run #26 17,46
Testconfiguratie
  • Windows benchmarks
Blender duurtest run #27 17,42
Testconfiguratie
  • Windows benchmarks
Blender duurtest run #28 17,4
Testconfiguratie
  • Windows benchmarks
Blender duurtest run #29 17,44
Testconfiguratie
  • Windows benchmarks
Blender duurtest run #30 17,36
Testconfiguratie
  • Windows benchmarks
Blender duurtest run #31 17,52
Testconfiguratie
  • Windows benchmarks
Blender duurtest run #32 17,7
Testconfiguratie
  • Windows benchmarks
Blender duurtest run #33 17,47
Testconfiguratie
  • Windows benchmarks
Blender duurtest run #34 17,48
Testconfiguratie
  • Windows benchmarks
Blender duurtest run #35 17,43
Testconfiguratie
  • Windows benchmarks
Blender duurtest run #36 17,4
Testconfiguratie
  • Windows benchmarks
Blender duurtest run #37 17,4
Testconfiguratie
  • Windows benchmarks
Blender duurtest run #38 17,48
Testconfiguratie
  • Windows benchmarks
Blender duurtest run #39 17,47
Testconfiguratie
  • Windows benchmarks
Blender duurtest run #40 17,43
Testconfiguratie
  • Windows benchmarks
Blender duurtest run #41 17,34
Testconfiguratie
  • Windows benchmarks
Blender duurtest run #42 17,33
Testconfiguratie
  • Windows benchmarks
Blender duurtest run #43 17,46
Testconfiguratie
  • Windows benchmarks
Blender duurtest run #44 17,4
Testconfiguratie
  • Windows benchmarks
Blender duurtest run #45 17,37
Testconfiguratie
  • Windows benchmarks
Blender duurtest run #46 17,42
Testconfiguratie
  • Windows benchmarks
Blender duurtest run #47 17,31
Testconfiguratie
  • Windows benchmarks
Blender duurtest run #48 17,41
Testconfiguratie
  • Windows benchmarks
Blender duurtest run #49 17,47
Testconfiguratie
  • Windows benchmarks
Blender duurtest run #50 17,43
Testconfiguratie
  • Windows benchmarks
PCMark 10 Extended 10.072
Testconfiguratie
  • Windows benchmarks
PCMark 10 Essentials 11.355
Testconfiguratie
  • Windows benchmarks
PCMark 10 App Start-up 15.900
Testconfiguratie
  • Windows benchmarks
PCMark 10 Video Conferencing 8.767
Testconfiguratie
  • Windows benchmarks
PCMark 10 Web Browsing 10.504
Testconfiguratie
  • Windows benchmarks
PCMark 10 Productivity 11.471
Testconfiguratie
  • Windows benchmarks
PCMark 10 Spreadsheets 14.979
Testconfiguratie
  • Windows benchmarks
PCMark 10 Writing 8.785
Testconfiguratie
  • Windows benchmarks
PCMark 10 Digital Content Creation 11.095
Testconfiguratie
  • Windows benchmarks
PCMark 10 Photo Editing 11.699
Testconfiguratie
  • Windows benchmarks
PCMark 10 Rendering and Visualization 15.438
Testconfiguratie
  • Windows benchmarks
PCMark 10 Video Editing 7.564
Testconfiguratie
  • Windows benchmarks
PCMark 10 Gaming 19.249
Testconfiguratie
  • Windows benchmarks
PCMark 10 Graphics 25.939
Testconfiguratie
  • Windows benchmarks
PCMark 10 Physics 28.532
Testconfiguratie
  • Windows benchmarks
PCMark 10 Combined 10.925
Testconfiguratie
  • Windows benchmarks

Energieverbruik / Accu

Energieverbruik uit 10,5 W
Testconfiguratie
  • Windows benchmarks
Energieverbruik adapter (zonder laptop) 0 W
Testconfiguratie
  • Windows benchmarks
Energieverbruik idle 30,7 W
Testconfiguratie
  • Windows benchmarks
Browser accutest - 180 cd/m2 416 min.
Testconfiguratie
  • Windows benchmarks
PCMark 10 Accu Digital 3.322
Testconfiguratie
  • Windows benchmarks
PCMark 10 Accu Essentials 4.230
Testconfiguratie
  • Windows benchmarks
PCMark 10 Accu Productivity 3.560
Testconfiguratie
  • Windows benchmarks
PCMark 10 Accu Duration in Minuten 165
Testconfiguratie
  • Windows benchmarks
PCMark 10 Accu Aantal Runs 1
Testconfiguratie
  • Windows benchmarks

Testresultaten beeldscherm

Gemeten kleurruimte DCI-P3
Testconfiguratie
  • Beeldscherm test SpectraCal CALman 5.13
Kleurtemperatuur 6.564 K
Testconfiguratie
  • Beeldscherm test SpectraCal CALman 5.13
Afwijking kleurtemperatuur wit van 6504K 60 K
Testconfiguratie
  • Beeldscherm test SpectraCal CALman 5.13
Gemiddelde kleurtemperatuur 6.477 K
Testconfiguratie
  • Beeldscherm test SpectraCal CALman 5.13
Afwijking gemiddelde kleurtemperatuur van 6504K 27 K
Testconfiguratie
  • Beeldscherm test SpectraCal CALman 5.13
Helderheid wit 178 cd/m²
Testconfiguratie
  • Beeldscherm test SpectraCal CALman 5.13
Helderheid zwart 0,00 cd/m²
Testconfiguratie
  • Beeldscherm test SpectraCal CALman 5.13
Contrast 0,0 : 1
Testconfiguratie
  • Beeldscherm test SpectraCal CALman 5.13
Checkerboard wit 373,8 cd/m²
Testconfiguratie
  • Beeldscherm test SpectraCal CALman 5.13
Checkerboard zwart 0 cd/m²
Testconfiguratie
  • Beeldscherm test SpectraCal CALman 5.13
Gamma 2,15
Testconfiguratie
  • Beeldscherm test SpectraCal CALman 5.13
Gamma (afwijking van 2,2) 0,05
Testconfiguratie
  • Beeldscherm test SpectraCal CALman 5.13
Gemiddelde kleurafwijking (Delta E 2000) 1,6 mΔuv
Testconfiguratie
  • Beeldscherm test SpectraCal CALman 5.13
Gemiddelde kleurafwijking ΔE ITP 9,21 Δuv
Testconfiguratie
  • Beeldscherm test SpectraCal CALman 5.13
Gemiddelde gedetailleerde kleur-afwijking ΔE 2000 1,6 Δuv
Testconfiguratie
  • Beeldscherm test SpectraCal CALman 5.13
Gemiddelde gedetailleerde kleur-afwijking ΔE ITP 6,51 Δuv
Testconfiguratie
  • Beeldscherm test SpectraCal CALman 5.13
Gemiddelde grijsafwijking (Delta E 2000) 1,2 mΔuv
Testconfiguratie
  • Beeldscherm test SpectraCal CALman 5.13
Gemiddelde grijsafwijking ΔE ITP 3,26 Δuv
Testconfiguratie
  • Beeldscherm test SpectraCal CALman 5.13
sRGB dekking 100 %
Testconfiguratie
  • Beeldscherm test SpectraCal CALman 5.13
DCI-P3 dekking 100 %
Testconfiguratie
  • Beeldscherm test SpectraCal CALman 5.13
Rec 2020 dekking 76,3 %
Testconfiguratie
  • Beeldscherm test SpectraCal CALman 5.13
0