Getest

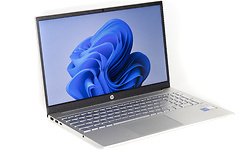
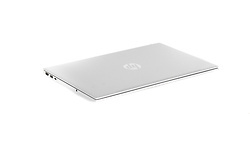
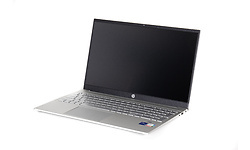
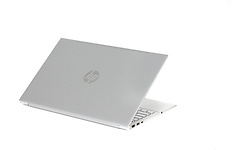
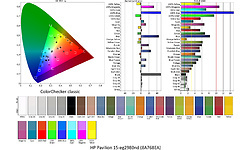
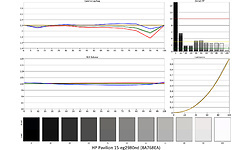
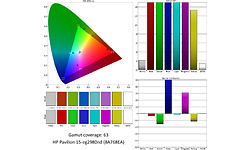
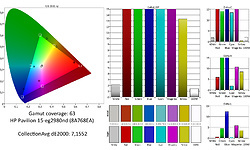
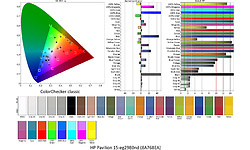
HP Pavilion 15-eg2980nd (8A768EA)

Prijsverloop

Specificaties

Belangrijkste specificaties

Processor type Intel Core i7 1255U
Geheugen capaciteit 16 GB
Scherm diagonaal 15,6 inch
Resolutie 1920x1080
Touchscreen
GPU type Intel Iris Xe Graphics G7 (Tiger Lake 96 EU)
Totale opslagcapaciteit 1.024 GB
Toetsenbordindeling Qwerty
Gewicht totaal 1,69 kg
Besturingssysteem (serie) Windows

Processor / Chipset / Geheugen

Processor serie Intel Core i7
Processor type Intel Core i7 1255U
Processor klokfrequentie 1,7 GHz
Processor klokfrequentie (max. turbo) 4,7 GHz
Configureerbare TDP-down 12 W
Aantal processorcores 10
Geheugen capaciteit 16 GB
Type geheugen DDR4
Geheugen klokfrequentie 3.200 MHz
Geheugen form factor Sodimm
SODIMM sloten 2
Vrije SODIMM sloten 0

Scherm

Scherm diagonaal 15,6 inch
Resolutie 1920x1080
Verhouding 16:9
Pixeldichtheid 141 ppi
Scherm type (mat/glans) Mat
Paneeltype IPS
Touchscreen
Maximale verversingsfrequentie 60 Hz

Graphics

GPU type Intel Iris Xe Graphics G7 (Tiger Lake 96 EU)
Geïntegreerde / losse GPU Geïntegreerd

Opslag

Totale opslagcapaciteit 1.024 GB
SSD opslagcapaciteit 1.024 GB
Beschikbaar opslaggeheugen 895,2 GB
Aantal harddisks / SSD's 1
Harddisk/SSD 1 capaciteit 1.024 GB
Harddisk/SSD 1 soort SSD/Flash
Harddisk/SSD 1 form factor M.2
Harddisk/SSD 1 merk/product KBG50ZNV1T02 KIOXIA
DVD branden
Blu-ray lezen
Blu-ray branden

Connectiviteit / Netwerk

Netwerkaansluiting (bedraad)
WiFi standaard 802.11ax (Wi-Fi 6)
WiFi adapter MediaTek Wi-Fi 6 MT7921 Wireless LAN Card
Bluetooth
Bluetooth-versie Bluetooth 5.2
4G (LTE)
5G

Aansluitingen

Smartcard
USB 3.2 - 5 Gb/s (Type-A) 2
USB 3.2 - 5 Gb/s (Type-C) 1
Cardreader - SD
Cardreader - MicroSD
DVI-uitgang
VGA-uitgang
HDMI-uitgang
Aantal HDMI-uitgangen 1
Micro HDMI-uitgang
HDMI-versie 2.0b
DisplayPort-uitgang
Mini DisplayPort-uitgang
Analoge audio aansluitingen 1
Aansluiting dockingstation
Kensingtonslot

Toetsenbord en touchpad

Toetsenbordindeling Qwerty
Numeriek toetsenbord
Toetsenbordverlichting helderheidsniveaus 2
Toetsenbordverlichting kleur Wit
Touchpad afzonderlijke muistoetsen

Camera

Webcam
Webcam resolutie 0,9 MPixel
Tweede camera
Flitser
Camera Windows Hello compatible
Webcamschuifje

Sensors

Accelerometer
Vingerafdruklezer
NFC

Overige hardware

Trusted Platform Module (TPM)
Geïntegreerde microfoon

Maten en gewichten

Accu capaciteit (Wh) 41 Wh
Verwisselbare accu
Gewicht totaal 1,69 kg
Afmeting - Breedte 36,02 cm
Afmeting - Diepte 23,4 cm
Afmeting - Hoogte/Dikte 1,98 cm
Passief gekoeld

Software

Besturingssysteem Microsoft Windows 11 Home
Besturingssysteem (serie) Windows
Windows versie 22H2
Windows OS Build 22.621,228
Aantal bits OS 64 bit

Fabrikantsopgave eigenschappen

Garantie 2 jaar

Platform onafhankelijke tests

Geekbench 6.1.0 - Multi 8.541
Geekbench 6.1.0 - Multi Integer 7.862
Geekbench 6.1.0 - Multi Floating Point 9.963
Geekbench 6.1.0 - Single 2.220
Geekbench 6.1.0 - Single Integer 2.170
Geekbench 6.1.0 - Single Floating Point 2.317
Geekbench 6.1.0 - Compute 14.032

Productcodes

SKU 8A768EA#ABH
EAN 0196337113596
Toegevoegd aan Hardware Info maandag 17 juli 2023

Testresultaten

Dit product is door Hardware Info getest op donderdag 21 september 2023.

Geluidstest

Noise floor 14 dB(A)
Testconfiguratie
  • Geluidsdichte ruimte 2021
  • Larson Davis SoundAdvisor Model 831C
Afstand geluidsmeting 50 cm
Testconfiguratie
  • Geluidsdichte ruimte 2021
  • Larson Davis SoundAdvisor Model 831C
WebXPRT 3 - LAeq 22,5 dB
Testconfiguratie
  • Geluidsdichte ruimte 2021
  • Larson Davis SoundAdvisor Model 831C
PCMark 10 Express - LAeq 29,9 dB
Testconfiguratie
  • Geluidsdichte ruimte 2021
  • Larson Davis SoundAdvisor Model 831C
Blender - LAeq 34,8 dB
Testconfiguratie
  • Geluidsdichte ruimte 2021
  • Larson Davis SoundAdvisor Model 831C

PCMark 10 Storage

PCMark 10 - Gebruiken Adobe Photoshop Heavy 501
Testconfiguratie
  • Windows benchmarks
PCMark 10 - Storage - Totaalscore - Toegangstijd 101
Testconfiguratie
  • Windows benchmarks
PCMark 10 - Storage - Totaalscore - Bandbreedte 259,28
PCMark 10 - Storage - Totaalscore 1.640
Testconfiguratie
  • Windows benchmarks
PCMark 10 - 2.37GB_(399_JPEGs)_leestest 319
PCMark 10 - 2.37GB_(399_JPEGs)_kopieertest 450
Testconfiguratie
  • Windows benchmarks
PCMark 10 - 2.37GB_(399_JPEGs)_schrijftest 286
Testconfiguratie
  • Windows benchmarks
PCMark 10 - 2GB_(4_ISOs)_leestest 1.325
Testconfiguratie
  • Windows benchmarks
PCMark 10 - 2GB_(4_ISOs)_kopieertest 1.387
Testconfiguratie
  • Windows benchmarks
PCMark 10 - 2GB_(4_ISOs)_schrijftest 1.553
Testconfiguratie
  • Windows benchmarks
PCMark 10 - Gebruiken Microsoft PowerPoint 80
Testconfiguratie
  • Windows benchmarks
PCMark 10 - Gebruiken Microsoft Excel 99
Testconfiguratie
  • Windows benchmarks
PCMark 10 - Gebruiken Adobe Photoshop Light 180
Testconfiguratie
  • Windows benchmarks
PCMark 10 - Starten Windows 10 248
Testconfiguratie
  • Windows benchmarks
PCMark 10 - Gebruiken Adobe InDesign 113
Testconfiguratie
  • Windows benchmarks
PCMark 10 - Gebruiken Adobe Illustrator 147
PCMark 10 - Gebruiken Adobe After Effects 329
Testconfiguratie
  • Windows benchmarks
PCMark 10 - Starten Overwatch 219
Testconfiguratie
  • Windows benchmarks
PCMark 10 - Starten Call of Duty: Black Ops 4 385
Testconfiguratie
  • Windows benchmarks
PCMark 10 - Starten Battlefield V 487
Testconfiguratie
  • Windows benchmarks
PCMark 10 - Starten Adobe Photoshop 134
Testconfiguratie
  • Windows benchmarks
PCMark 10 - Starten Adobe Lightroom 107
Testconfiguratie
  • Windows benchmarks
PCMark 10 - Starten Adobe Premiere_Pro 170
Testconfiguratie
  • Windows benchmarks
PCMark 10 - Starten Adobe Illustrator 119
Testconfiguratie
  • Windows benchmarks
PCMark 10 - Starten Adobe After Effects 153
Testconfiguratie
  • Windows benchmarks
PCMark 10 - Starten Adobe Acrobat 149
Testconfiguratie
  • Windows benchmarks
PCMark 10 - Quick Storage - Totaalscore 1.862
Testconfiguratie
  • Windows benchmarks
PCMark 10 - Quick Storage - Totaalscore - Bandbreedte 224,92
Testconfiguratie
  • Windows benchmarks
PCMark 10 - Quick Storage - Totaalscore - Toegangstijd 68
Testconfiguratie
  • Windows benchmarks

Platform onafhankelijke tests

Opstarttijd 14,72 sec.
Testconfiguratie
  • Platform onafhankelijke tests
JetStream 2 255,136
Testconfiguratie
  • Platform onafhankelijke tests
webXPRT 3 391
Testconfiguratie
  • Platform onafhankelijke tests
webXPRT 3 - Photo Enhancement 218 ms
Testconfiguratie
  • Platform onafhankelijke tests
webXPRT 3 - Organize Album using AI 1.704 ms
Testconfiguratie
  • Platform onafhankelijke tests
webXPRT 3 - Stock Option Pricing 73 ms
Testconfiguratie
  • Platform onafhankelijke tests
webXPRT 3 - Encrypt Notes and OCR Scan 853 ms
Testconfiguratie
  • Platform onafhankelijke tests
webXPRT 3 - Sales Graphs 222 ms
Testconfiguratie
  • Platform onafhankelijke tests
webXPRT 3 - Online Homework 701 ms
Testconfiguratie
  • Platform onafhankelijke tests
Geekbench 5 - Multi 7.491
Testconfiguratie
  • Platform onafhankelijke tests
Geekbench 5 - Multi Crypto 7.430
Testconfiguratie
  • Platform onafhankelijke tests
Geekbench 5 - Multi Integer 7.653
Testconfiguratie
  • Platform onafhankelijke tests
Geekbench 5 - Multi Floating Point 7.151
Testconfiguratie
  • Platform onafhankelijke tests
Geekbench 5 - Single 1.736
Testconfiguratie
  • Platform onafhankelijke tests
Geekbench 5 - Single Crypto 4.197
Testconfiguratie
  • Platform onafhankelijke tests
Geekbench 5 - Single Integer 1.510
Testconfiguratie
  • Platform onafhankelijke tests
Geekbench 5 - Single Floating Point 1.817
Testconfiguratie
  • Platform onafhankelijke tests
Geekbench 5 - OpenCL 16.298
Testconfiguratie
  • Platform onafhankelijke tests
WiFi speedtest 2.4GHz receive 220 Mbit/s
Testconfiguratie
  • Platform onafhankelijke tests
WiFi speedtest 2.4GHz send 199 Mbit/s
Testconfiguratie
  • Platform onafhankelijke tests
WiFi speedtest 5.0GHz receive 516 Mbit/s
Testconfiguratie
  • Platform onafhankelijke tests
WiFi speedtest 5.0GHz send 399 Mbit/s
Testconfiguratie
  • Platform onafhankelijke tests

Windows benchmarks

3DMark - Fire Strike 3.476
Testconfiguratie
  • Windows benchmarks
3DMark - Fire Strike Graphics 3.921
Testconfiguratie
  • Windows benchmarks
3DMark - Fire Strike Physics 10.324
Testconfiguratie
  • Windows benchmarks
3DMark - Fire Strike Combined 1.222
Testconfiguratie
  • Windows benchmarks
3DMark - Time Spy 1.592
Testconfiguratie
  • Windows benchmarks
3DMark - Time Spy Graphics 1.431
Testconfiguratie
  • Windows benchmarks
3DMark - Time Spy CPU 4.394
Testconfiguratie
  • Windows benchmarks
3DMark - Night Raid 13.907
Testconfiguratie
  • Windows benchmarks
3DMark - Night Raid Graphics 17.705
Testconfiguratie
  • Windows benchmarks
3DMark - Night Raid CPU 6.278
Testconfiguratie
  • Windows benchmarks
Cinebench R15 - Single 206
Testconfiguratie
  • Windows benchmarks
Cinebench R15 - Multi 1.301
Testconfiguratie
  • Windows benchmarks
Cinebench R20 - Single 651
Testconfiguratie
  • Windows benchmarks
Cinebench R20 - Multi 2.634
Testconfiguratie
  • Windows benchmarks
Cinebench R23 - Single 1.688
Testconfiguratie
  • Windows benchmarks
Cinebench R23 - Multi 7.423
Testconfiguratie
  • Windows benchmarks
Blender duurtest run #1 32,07
Testconfiguratie
  • Windows benchmarks
Blender duurtest run #2 42,1
Testconfiguratie
  • Windows benchmarks
Blender duurtest run #3 43,46
Testconfiguratie
  • Windows benchmarks
Blender duurtest run #4 45,58
Testconfiguratie
  • Windows benchmarks
Blender duurtest run #5 45,72
Testconfiguratie
  • Windows benchmarks
Blender duurtest run #6 44,57
Testconfiguratie
  • Windows benchmarks
Blender duurtest run #7 50,6
Testconfiguratie
  • Windows benchmarks
Blender duurtest run #8 48,35
Testconfiguratie
  • Windows benchmarks
Blender duurtest run #9 44,6
Testconfiguratie
  • Windows benchmarks
Blender duurtest run #10 42,97
Testconfiguratie
  • Windows benchmarks
Blender duurtest run #11 45,2
Testconfiguratie
  • Windows benchmarks
Blender duurtest run #12 48,09
Testconfiguratie
  • Windows benchmarks
Blender duurtest run #13 48,4
Testconfiguratie
  • Windows benchmarks
Blender duurtest run #14 47,25
Testconfiguratie
  • Windows benchmarks
Blender duurtest run #15 44,51
Testconfiguratie
  • Windows benchmarks
Blender duurtest run #16 44,7
Testconfiguratie
  • Windows benchmarks
Blender duurtest run #17 48,02
Testconfiguratie
  • Windows benchmarks
Blender duurtest run #18 48,48
Testconfiguratie
  • Windows benchmarks
Blender duurtest run #19 47,36
Testconfiguratie
  • Windows benchmarks
Blender duurtest run #20 45,31
Testconfiguratie
  • Windows benchmarks
Blender duurtest run #21 47,53
Testconfiguratie
  • Windows benchmarks
Blender duurtest run #22 48,18
Testconfiguratie
  • Windows benchmarks
Blender duurtest run #23 47,23
Testconfiguratie
  • Windows benchmarks
Blender duurtest run #24 48
Testconfiguratie
  • Windows benchmarks
Blender duurtest run #25 45,6
Testconfiguratie
  • Windows benchmarks
Blender duurtest run #26 47,97
Testconfiguratie
  • Windows benchmarks
PCMark 10 Extended 5.031
Testconfiguratie
  • Windows benchmarks
PCMark 10 Essentials 11.610
Testconfiguratie
  • Windows benchmarks
PCMark 10 App Start-up 19.157
Testconfiguratie
  • Windows benchmarks
PCMark 10 Video Conferencing 8.471
Testconfiguratie
  • Windows benchmarks
PCMark 10 Web Browsing 9.644
Testconfiguratie
  • Windows benchmarks
PCMark 10 Productivity 7.056
Testconfiguratie
  • Windows benchmarks
PCMark 10 Spreadsheets 6.960
Testconfiguratie
  • Windows benchmarks
PCMark 10 Writing 7.154
Testconfiguratie
  • Windows benchmarks
PCMark 10 Digital Content Creation 5.953
Testconfiguratie
  • Windows benchmarks
PCMark 10 Photo Editing 9.961
Testconfiguratie
  • Windows benchmarks
PCMark 10 Rendering and Visualization 3.420
Testconfiguratie
  • Windows benchmarks
PCMark 10 Video Editing 6.193
Testconfiguratie
  • Windows benchmarks
PCMark 10 Gaming 3.552
Testconfiguratie
  • Windows benchmarks
PCMark 10 Graphics 4.628
Testconfiguratie
  • Windows benchmarks
PCMark 10 Physics 14.935
Testconfiguratie
  • Windows benchmarks
PCMark 10 Combined 1.597
Testconfiguratie
  • Windows benchmarks

Energieverbruik / Accu

Energieverbruik uit 0,3 W
Testconfiguratie
  • Windows benchmarks
Energieverbruik adapter (zonder laptop) 0 W
Testconfiguratie
  • Windows benchmarks
Energieverbruik idle 6,5 W
Testconfiguratie
  • Windows benchmarks
Browser accutest - 180 cd/m2 363 min.
Testconfiguratie
  • Windows benchmarks
PCMark 10 Accu Digital 3.716
Testconfiguratie
  • Windows benchmarks
PCMark 10 Accu Essentials 8.150
Testconfiguratie
  • Windows benchmarks
PCMark 10 Accu Productivity 5.620
Testconfiguratie
  • Windows benchmarks
PCMark 10 Accu Duration in Minuten 151
Testconfiguratie
  • Windows benchmarks
PCMark 10 Accu Aantal Runs 5
Testconfiguratie
  • Windows benchmarks

Testresultaten beeldscherm

Gemeten kleurruimte sRGB
Testconfiguratie
  • Beeldscherm test SpectraCal CALman 5.13
Kleurtemperatuur 6.597 K
Testconfiguratie
  • Beeldscherm test SpectraCal CALman 5.13
Afwijking kleurtemperatuur wit van 6504K 93 K
Testconfiguratie
  • Beeldscherm test SpectraCal CALman 5.13
Gemiddelde kleurtemperatuur 6.374 K
Testconfiguratie
  • Beeldscherm test SpectraCal CALman 5.13
Afwijking gemiddelde kleurtemperatuur van 6504K 130 K
Testconfiguratie
  • Beeldscherm test SpectraCal CALman 5.13
Helderheid wit 151 cd/m²
Testconfiguratie
  • Beeldscherm test SpectraCal CALman 5.13
Helderheid zwart 0,13 cd/m²
Testconfiguratie
  • Beeldscherm test SpectraCal CALman 5.13
Contrast 1.162,8 : 1
Testconfiguratie
  • Beeldscherm test SpectraCal CALman 5.13
Checkerboard wit 273,66 cd/m²
Testconfiguratie
  • Beeldscherm test SpectraCal CALman 5.13
Checkerboard zwart 0,227 cd/m²
Testconfiguratie
  • Beeldscherm test SpectraCal CALman 5.13
Checkerboard contrast 1.206 : 1
Testconfiguratie
  • Beeldscherm test SpectraCal CALman 5.13
Gamma 2,14
Testconfiguratie
  • Beeldscherm test SpectraCal CALman 5.13
Gamma (afwijking van 2,2) 0,06
Testconfiguratie
  • Beeldscherm test SpectraCal CALman 5.13
Gemiddelde kleurafwijking (Delta E 2000) 7,2 mΔuv
Testconfiguratie
  • Beeldscherm test SpectraCal CALman 5.13
Gemiddelde kleurafwijking ΔE ITP 27,22 Δuv
Testconfiguratie
  • Beeldscherm test SpectraCal CALman 5.13
Gemiddelde gedetailleerde kleur-afwijking ΔE 2000 5,3 Δuv
Testconfiguratie
  • Beeldscherm test SpectraCal CALman 5.13
Gemiddelde gedetailleerde kleur-afwijking ΔE ITP 17,99 Δuv
Testconfiguratie
  • Beeldscherm test SpectraCal CALman 5.13
Gemiddelde grijsafwijking (Delta E 2000) 1,4 mΔuv
Testconfiguratie
  • Beeldscherm test SpectraCal CALman 5.13
Gemiddelde grijsafwijking ΔE ITP 2,76 Δuv
Testconfiguratie
  • Beeldscherm test SpectraCal CALman 5.13
sRGB dekking 63 %
Testconfiguratie
  • Beeldscherm test SpectraCal CALman 5.13
DCI-P3 dekking 47,4 %
Testconfiguratie
  • Beeldscherm test SpectraCal CALman 5.13
Rec 2020 dekking 34 %
Testconfiguratie
  • Beeldscherm test SpectraCal CALman 5.13
0