Getest

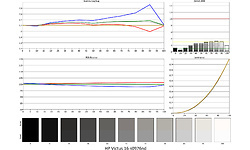
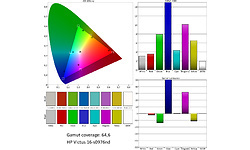
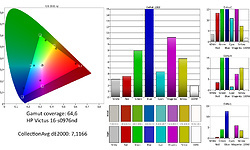
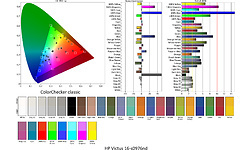
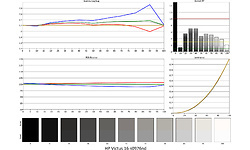
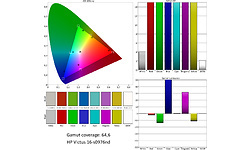
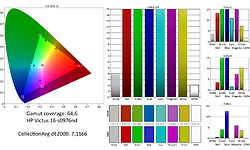
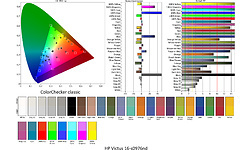
HP Victus 16-s0976nd
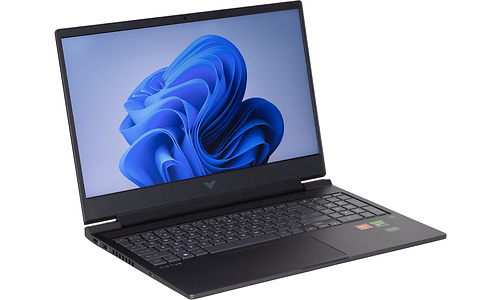
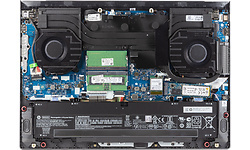
Prijsverloop

Specificaties

Belangrijkste specificaties

Processor type AMD Ryzen 7 7840HS
Geheugen capaciteit 16 GB
Scherm diagonaal 16,1 inch
Resolutie 1920x1080
Touchscreen
GPU type Nvidia GeForce RTX 4070 Laptop GPU
Totale opslagcapaciteit 512 GB
Toetsenbordindeling Qwerty
Gewicht totaal 2,36 kg
Besturingssysteem (serie) Windows

Processor / Chipset / Geheugen

Processor serie AMD Ryzen 7
Processor type AMD Ryzen 7 7840HS
Processor klokfrequentie 3,8 GHz
Processor klokfrequentie (max. turbo) 5,1 GHz
Configureerbare TDP-down 35 W
Configureerbare TDP-up 54 W
Aantal processorcores 8
Geheugen capaciteit 16 GB
Type geheugen LPDDR5
Geheugen klokfrequentie 5.600 MHz
Geheugen form factor Sodimm
SODIMM sloten 2
Vrije SODIMM sloten 0

Scherm

Scherm diagonaal 16,1 inch
Resolutie 1920x1080
Verhouding 16:9
Pixeldichtheid 137 ppi
Scherm type (mat/glans) Mat
Paneeltype IPS
Touchscreen
Maximale verversingsfrequentie 144 Hz

Graphics

GPU type Nvidia GeForce RTX 4070 Laptop GPU
Geïntegreerde / losse GPU Losse chip
Videogeheugen 8 GB

Opslag

Totale opslagcapaciteit 512 GB
SSD opslagcapaciteit 512 GB
Beschikbaar opslaggeheugen 423,8 GB
Aantal harddisks / SSD's 1
Harddisk/SSD 1 capaciteit 423,8 GB
Harddisk/SSD 1 soort SSD/Flash
Harddisk/SSD 1 form factor M.2
Harddisk/SSD 1 merk/product KXG80ZNV512G KIOXIA
DVD branden
Blu-ray lezen
Blu-ray branden

Connectiviteit / Netwerk

Netwerkaansluiting (bedraad)
Netwerkadapter (bedraad) Realtek Gaming GBE Family Controller
Netwerksnelheid (bedraad) 1000 Mbit/s
WiFi standaard 802.11ax (Wi-Fi 6)
WiFi adapter MediaTek Wi-Fi 6 MT7921 Wireless LAN Card
Bluetooth
Bluetooth-versie Bluetooth 5.2
4G (LTE)
5G

Aansluitingen

Smartcard
USB 3.2 - 5 Gb/s (Type-A) 3
USB 3.2 - 5 Gb/s (Type-C) 1
Cardreader - SD
Cardreader - MicroSD
DVI-uitgang
VGA-uitgang
HDMI-uitgang
Aantal HDMI-uitgangen 1
Micro HDMI-uitgang
HDMI-versie 2.1
DisplayPort-uitgang
Mini DisplayPort-uitgang
Analoge audio aansluitingen 1
Aansluiting dockingstation
Kensingtonslot

Toetsenbord en touchpad

Toetsenbordindeling Qwerty
Numeriek toetsenbord
Toetsenbordverlichting helderheidsniveaus 1
Toetsenbordverlichting kleur Wit
Touchpad afzonderlijke muistoetsen

Camera

Webcam
Webcam resolutie 2,1 MPixel
Tweede camera
Flitser
Camera Windows Hello compatible
Webcamschuifje

Sensors

Accelerometer
Vingerafdruklezer
NFC

Overige hardware

Trusted Platform Module (TPM)
Geïntegreerde microfoon

Maten en gewichten

Accu capaciteit (Wh) 70 Wh
Verwisselbare accu
Gewicht totaal 2,36 kg
Afmeting - Breedte 36,9 cm
Afmeting - Diepte 26 cm
Afmeting - Hoogte/Dikte 2,74 cm
Passief gekoeld

Software

Besturingssysteem Microsoft Windows 11 Home
Besturingssysteem (serie) Windows
Windows versie 22H2
Windows OS Build 22.621,213
Aantal bits OS 64 bit

Fabrikantsopgave eigenschappen

Garantie 1 jaar

Platform onafhankelijke tests

Geekbench 6.1.0 - Multi 11.569
Geekbench 6.1.0 - Multi Integer 10.720
Geekbench 6.1.0 - Multi Floating Point 13.327
Geekbench 6.1.0 - Single 2.637
Geekbench 6.1.0 - Single Integer 2.543
Geekbench 6.1.0 - Single Floating Point 2.822
Geekbench 6.1.0 - Compute 116.074

Productcodes

SKU 8B2G3EA#ABH
EAN 0197029510815
Toegevoegd aan Hardware Info maandag 31 juli 2023

Testresultaten

Dit product is door Hardware Info getest op maandag 14 augustus 2023.

Metro Exodus

Metro Exodus - 1920x1080 - Medium 142,3 fps
Testconfiguratie
  • Game benchmarks 2022
Metro Exodus - 1920x1080 - Medium (99p) 15,8 ms
Testconfiguratie
  • Game benchmarks 2022
Metro Exodus - 1920x1080 - Medium (99.9p) 18,37 ms
Testconfiguratie
  • Game benchmarks 2022
Metro Exodus - 1920x1080 - Ultra 91,8 fps
Testconfiguratie
  • Game benchmarks 2022
Metro Exodus - 1920x1080 - Ultra (99p) 20,79 ms
Testconfiguratie
  • Game benchmarks 2022
Metro Exodus - 1920x1080 - Ultra (99.9p) 26,28 ms
Testconfiguratie
  • Game benchmarks 2022
Metro Exodus - 2560x1440 - Medium 109,9 fps
Testconfiguratie
  • Game benchmarks 2022
Metro Exodus - 2560x1440 - Medium (99p) 17,8 ms
Testconfiguratie
  • Game benchmarks 2022
Metro Exodus - 2560x1440 - Medium (99.9p) 21,59 ms
Testconfiguratie
  • Game benchmarks 2022
Metro Exodus - 2560x1440 - Ultra 73,3 fps
Testconfiguratie
  • Game benchmarks 2022
Metro Exodus - 2560x1440 - Ultra (99p) 24,21 ms
Testconfiguratie
  • Game benchmarks 2022
Metro Exodus - 2560x1440 - Ultra (99.9p) 28,64 ms
Testconfiguratie
  • Game benchmarks 2022
Metro Exodus - 3840x2160 - Medium 63,1 fps
Testconfiguratie
  • Game benchmarks 2022
Metro Exodus - 3840x2160 - Medium (99p) 26,67 ms
Testconfiguratie
  • Game benchmarks 2022
Metro Exodus - 3840x2160 - Medium (99.9p) 29,36 ms
Testconfiguratie
  • Game benchmarks 2022
Metro Exodus - 3840x2160 - Ultra 45,3 fps
Testconfiguratie
  • Game benchmarks 2022
Metro Exodus - 3840x2160 - Ultra (99p) 34,62 ms
Testconfiguratie
  • Game benchmarks 2022
Metro Exodus - 3840x2160 - Ultra (99.9p) 44,75 ms
Testconfiguratie
  • Game benchmarks 2022
Metro Exodus - 1920x1080 - Ultra (DXR - High) 78,7 fps
Testconfiguratie
  • Game benchmarks 2022
Metro Exodus - 1920x1080 - Ultra (DXR - High) (99p) 23,9 ms
Testconfiguratie
  • Game benchmarks 2022
Metro Exodus - 1920x1080 - Ultra (DXR - High) (99.9p) 37,8 ms
Testconfiguratie
  • Game benchmarks 2022
Metro Exodus - 2560x1440 - Ultra (DXR - High) 57,2 fps
Testconfiguratie
  • Game benchmarks 2022
Metro Exodus - 2560x1440 - Ultra (DXR - High) (99p) 29,46 ms
Testconfiguratie
  • Game benchmarks 2022
Metro Exodus - 2560x1440 - Ultra (DXR - High) (99.9p) 38,27 ms
Testconfiguratie
  • Game benchmarks 2022

Total War: Troy

Total War: Troy - 1920x1080 - Medium 235,8 fps
Testconfiguratie
  • Game benchmarks 2022
Total War: Troy - 1920x1080 - Medium (99p) 5,49 ms
Testconfiguratie
  • Game benchmarks 2022
Total War: Troy - 1920x1080 - Medium (99.9p) 6,55 ms
Testconfiguratie
  • Game benchmarks 2022
Total War: Troy - 1920x1080 - Ultra 119,8 fps
Testconfiguratie
  • Game benchmarks 2022
Total War: Troy - 1920x1080 - Ultra (99p) 11,63 ms
Testconfiguratie
  • Game benchmarks 2022
Total War: Troy - 1920x1080 - Ultra (99.9p) 13,15 ms
Testconfiguratie
  • Game benchmarks 2022
Total War: Troy - 2560x1440 - Medium 166,6 fps
Testconfiguratie
  • Game benchmarks 2022
Total War: Troy - 2560x1440 - Medium (99p) 7,39 ms
Testconfiguratie
  • Game benchmarks 2022
Total War: Troy - 2560x1440 - Medium (99.9p) 55,48 ms
Testconfiguratie
  • Game benchmarks 2022
Total War: Troy - 2560x1440 - Ultra 89,7 fps
Testconfiguratie
  • Game benchmarks 2022
Total War: Troy - 2560x1440 - Ultra (99p) 14,41 ms
Testconfiguratie
  • Game benchmarks 2022
Total War: Troy - 2560x1440 - Ultra (99.9p) 18,18 ms
Testconfiguratie
  • Game benchmarks 2022
Total War: Troy - 3840x2160 - Medium 86,2 fps
Testconfiguratie
  • Game benchmarks 2022
Total War: Troy - 3840x2160 - Medium (99p) 13,26 ms
Testconfiguratie
  • Game benchmarks 2022
Total War: Troy - 3840x2160 - Medium (99.9p) 14,02 ms
Testconfiguratie
  • Game benchmarks 2022
Total War: Troy - 3840x2160 - Ultra 49,2 fps
Testconfiguratie
  • Game benchmarks 2022
Total War: Troy - 3840x2160 - Ultra (99p) 27,23 ms
Testconfiguratie
  • Game benchmarks 2022
Total War: Troy - 3840x2160 - Ultra (99.9p) 36,75 ms
Testconfiguratie
  • Game benchmarks 2022

Far Cry: New Dawn

Far Cry: New Dawn - 1920x1080 - Medium 113,6 fps
Testconfiguratie
  • Game benchmarks 2022
Far Cry: New Dawn - 1920x1080 - Medium (99p) 11,73 ms
Testconfiguratie
  • Game benchmarks 2022
Far Cry: New Dawn - 1920x1080 - Medium (99.9p) 15,29 ms
Testconfiguratie
  • Game benchmarks 2022
Far Cry: New Dawn - 1920x1080 - Ultra 100,3 fps
Testconfiguratie
  • Game benchmarks 2022
Far Cry: New Dawn - 1920x1080 - Ultra (99p) 14,55 ms
Testconfiguratie
  • Game benchmarks 2022
Far Cry: New Dawn - 1920x1080 - Ultra (99.9p) 16,35 ms
Testconfiguratie
  • Game benchmarks 2022
Far Cry: New Dawn - 2560x1440 - Medium 110,2 fps
Testconfiguratie
  • Game benchmarks 2022
Far Cry: New Dawn - 2560x1440 - Medium (99p) 12,37 ms
Testconfiguratie
  • Game benchmarks 2022
Far Cry: New Dawn - 2560x1440 - Medium (99.9p) 16,74 ms
Testconfiguratie
  • Game benchmarks 2022
Far Cry: New Dawn - 2560x1440 - Ultra 96,3 fps
Testconfiguratie
  • Game benchmarks 2022
Far Cry: New Dawn - 2560x1440 - Ultra (99p) 14,57 ms
Testconfiguratie
  • Game benchmarks 2022
Far Cry: New Dawn - 2560x1440 - Ultra (99.9p) 19,58 ms
Testconfiguratie
  • Game benchmarks 2022
Far Cry: New Dawn - 3840x2160 - Medium 73 fps
Testconfiguratie
  • Game benchmarks 2022
Far Cry: New Dawn - 3840x2160 - Medium (99p) 17,26 ms
Testconfiguratie
  • Game benchmarks 2022
Far Cry: New Dawn - 3840x2160 - Medium (99.9p) 31,74 ms
Testconfiguratie
  • Game benchmarks 2022
Far Cry: New Dawn - 3840x2160 - Ultra 63,4 fps
Testconfiguratie
  • Game benchmarks 2022
Far Cry: New Dawn - 3840x2160 - Ultra (99p) 20,29 ms
Testconfiguratie
  • Game benchmarks 2022
Far Cry: New Dawn - 3840x2160 - Ultra (99.9p) 29,72 ms
Testconfiguratie
  • Game benchmarks 2022

F1 2020

F1 2020 (DX12) - 1920x1080 - Medium 229,7 fps
Testconfiguratie
  • Game benchmarks 2022
F1 2020 (DX12) - 1920x1080 - Medium (99p) 6,4 ms
Testconfiguratie
  • Game benchmarks 2022
F1 2020 (DX12) - 1920x1080 - Medium (99.9p) 9,1 ms
Testconfiguratie
  • Game benchmarks 2022
F1 2020 (DX12) - 1920x1080 - Ultra 191,9 fps
Testconfiguratie
  • Game benchmarks 2022
F1 2020 (DX12) - 1920x1080 - Ultra (99p) 7,5 ms
Testconfiguratie
  • Game benchmarks 2022
F1 2020 (DX12) - 1920x1080 - Ultra (99.9p) 9,8 ms
Testconfiguratie
  • Game benchmarks 2022
F1 2020 (DX12) - 2560x1440 - Medium 230,9 fps
Testconfiguratie
  • Game benchmarks 2022
F1 2020 (DX12) - 2560x1440 - Medium (99p) 6,1 ms
Testconfiguratie
  • Game benchmarks 2022
F1 2020 (DX12) - 2560x1440 - Medium (99.9p) 8,6 ms
Testconfiguratie
  • Game benchmarks 2022
F1 2020 (DX12) - 2560x1440 - Ultra 174,1 fps
Testconfiguratie
  • Game benchmarks 2022
F1 2020 (DX12) - 2560x1440 - Ultra (99p) 8,2 ms
Testconfiguratie
  • Game benchmarks 2022
F1 2020 (DX12) - 2560x1440 - Ultra (99.9p) 18,3 ms
Testconfiguratie
  • Game benchmarks 2022
F1 2020 (DX12) - 3840x2160 - Medium 148,2 fps
Testconfiguratie
  • Game benchmarks 2022
F1 2020 (DX12) - 3840x2160 - Medium (99p) 8,1 ms
Testconfiguratie
  • Game benchmarks 2022
F1 2020 (DX12) - 3840x2160 - Medium (99.9p) 8,9 ms
Testconfiguratie
  • Game benchmarks 2022
F1 2020 (DX12) - 3840x2160 - Ultra 102 fps
Testconfiguratie
  • Game benchmarks 2022
F1 2020 (DX12) - 3840x2160 - Ultra (99p) 12,2 ms
Testconfiguratie
  • Game benchmarks 2022
F1 2020 (DX12) - 3840x2160 - Ultra (99.9p) 13,5 ms
Testconfiguratie
  • Game benchmarks 2022

Geluidstest

Noise floor 14 dB(A)
Testconfiguratie
  • Geluidsdichte ruimte 2021
  • Larson Davis SoundAdvisor Model 831C
Afstand geluidsmeting 50 cm
Testconfiguratie
  • Geluidsdichte ruimte 2021
  • Larson Davis SoundAdvisor Model 831C
WebXPRT 3 - LAeq 25,3 dB
Testconfiguratie
  • Geluidsdichte ruimte 2021
  • Larson Davis SoundAdvisor Model 831C
PCMark 10 Express - LAeq 31,3 dB
Testconfiguratie
  • Geluidsdichte ruimte 2021
  • Larson Davis SoundAdvisor Model 831C
Blender - LAeq 51,9 dB
Testconfiguratie
  • Geluidsdichte ruimte 2021
  • Larson Davis SoundAdvisor Model 831C
F1 2020 - LAeq 53 dB
Testconfiguratie
  • Geluidsdichte ruimte 2021
  • Larson Davis SoundAdvisor Model 831C

PCMark 10 Storage

PCMark 10 - Gebruiken Adobe Photoshop Heavy 537
Testconfiguratie
  • Windows benchmarks
PCMark 10 - Storage - Totaalscore - Toegangstijd 91
Testconfiguratie
  • Windows benchmarks
PCMark 10 - Storage - Totaalscore - Bandbreedte 285,11
PCMark 10 - Storage - Totaalscore 1.812
Testconfiguratie
  • Windows benchmarks
PCMark 10 - 2.37GB_(399_JPEGs)_leestest 404
PCMark 10 - 2.37GB_(399_JPEGs)_kopieertest 584
Testconfiguratie
  • Windows benchmarks
PCMark 10 - 2.37GB_(399_JPEGs)_schrijftest 356
Testconfiguratie
  • Windows benchmarks
PCMark 10 - 2GB_(4_ISOs)_leestest 2.220
Testconfiguratie
  • Windows benchmarks
PCMark 10 - 2GB_(4_ISOs)_kopieertest 2.004
Testconfiguratie
  • Windows benchmarks
PCMark 10 - 2GB_(4_ISOs)_schrijftest 2.199
Testconfiguratie
  • Windows benchmarks
PCMark 10 - Gebruiken Microsoft PowerPoint 91
Testconfiguratie
  • Windows benchmarks
PCMark 10 - Gebruiken Microsoft Excel 102
Testconfiguratie
  • Windows benchmarks
PCMark 10 - Gebruiken Adobe Photoshop Light 179
Testconfiguratie
  • Windows benchmarks
PCMark 10 - Starten Windows 10 245
Testconfiguratie
  • Windows benchmarks
PCMark 10 - Gebruiken Adobe InDesign 139
Testconfiguratie
  • Windows benchmarks
PCMark 10 - Gebruiken Adobe Illustrator 155
PCMark 10 - Gebruiken Adobe After Effects 317
Testconfiguratie
  • Windows benchmarks
PCMark 10 - Starten Overwatch 237
Testconfiguratie
  • Windows benchmarks
PCMark 10 - Starten Call of Duty: Black Ops 4 366
Testconfiguratie
  • Windows benchmarks
PCMark 10 - Starten Battlefield V 434
Testconfiguratie
  • Windows benchmarks
PCMark 10 - Starten Adobe Photoshop 133
Testconfiguratie
  • Windows benchmarks
PCMark 10 - Starten Adobe Lightroom 105
Testconfiguratie
  • Windows benchmarks
PCMark 10 - Starten Adobe Premiere_Pro 163
Testconfiguratie
  • Windows benchmarks
PCMark 10 - Starten Adobe Illustrator 122
Testconfiguratie
  • Windows benchmarks
PCMark 10 - Starten Adobe After Effects 143
Testconfiguratie
  • Windows benchmarks
PCMark 10 - Starten Adobe Acrobat 152
Testconfiguratie
  • Windows benchmarks
PCMark 10 - Quick Storage - Totaalscore 2.049
Testconfiguratie
  • Windows benchmarks
PCMark 10 - Quick Storage - Totaalscore - Bandbreedte 248,14
Testconfiguratie
  • Windows benchmarks
PCMark 10 - Quick Storage - Totaalscore - Toegangstijd 62
Testconfiguratie
  • Windows benchmarks

Platform onafhankelijke tests

Opstarttijd 14,52 sec.
Testconfiguratie
  • Platform onafhankelijke tests
JetStream 2 255,509
Testconfiguratie
  • Platform onafhankelijke tests
webXPRT 3 413
Testconfiguratie
  • Platform onafhankelijke tests
webXPRT 3 - Photo Enhancement 204 ms
Testconfiguratie
  • Platform onafhankelijke tests
webXPRT 3 - Organize Album using AI 1.398 ms
Testconfiguratie
  • Platform onafhankelijke tests
webXPRT 3 - Stock Option Pricing 76 ms
Testconfiguratie
  • Platform onafhankelijke tests
webXPRT 3 - Encrypt Notes and OCR Scan 765 ms
Testconfiguratie
  • Platform onafhankelijke tests
webXPRT 3 - Sales Graphs 227 ms
Testconfiguratie
  • Platform onafhankelijke tests
webXPRT 3 - Online Homework 693 ms
Testconfiguratie
  • Platform onafhankelijke tests
Geekbench 5 - Multi 10.920
Testconfiguratie
  • Platform onafhankelijke tests
Geekbench 5 - Multi Crypto 7.473
Testconfiguratie
  • Platform onafhankelijke tests
Geekbench 5 - Multi Integer 10.838
Testconfiguratie
  • Platform onafhankelijke tests
Geekbench 5 - Multi Floating Point 11.671
Testconfiguratie
  • Platform onafhankelijke tests
Geekbench 5 - Single 1.901
Testconfiguratie
  • Platform onafhankelijke tests
Geekbench 5 - Single Crypto 6.196
Testconfiguratie
  • Platform onafhankelijke tests
Geekbench 5 - Single Integer 1.551
Testconfiguratie
  • Platform onafhankelijke tests
Geekbench 5 - Single Floating Point 1.943
Testconfiguratie
  • Platform onafhankelijke tests
Geekbench 5 - OpenCL 119.437
Testconfiguratie
  • Platform onafhankelijke tests
WiFi speedtest 2.4GHz receive 223 Mbit/s
Testconfiguratie
  • Platform onafhankelijke tests
WiFi speedtest 2.4GHz send 208 Mbit/s
Testconfiguratie
  • Platform onafhankelijke tests
WiFi speedtest 5.0GHz receive 574 Mbit/s
Testconfiguratie
  • Platform onafhankelijke tests
WiFi speedtest 5.0GHz send 664 Mbit/s
Testconfiguratie
  • Platform onafhankelijke tests

Windows benchmarks

3DMark - Fire Strike 27.516
Testconfiguratie
  • Windows benchmarks
3DMark - Fire Strike Graphics 32.390
Testconfiguratie
  • Windows benchmarks
3DMark - Fire Strike Physics 26.569
Testconfiguratie
  • Windows benchmarks
3DMark - Fire Strike Combined 13.260
Testconfiguratie
  • Windows benchmarks
3DMark - Fire Strike Extreme 14.319
Testconfiguratie
  • Windows benchmarks
3DMark - Time Spy 12.311
Testconfiguratie
  • Windows benchmarks
3DMark - Time Spy Graphics 12.521
Testconfiguratie
  • Windows benchmarks
3DMark - Time Spy CPU 11.243
Testconfiguratie
  • Windows benchmarks
3DMark - Night Raid 47.648
Testconfiguratie
  • Windows benchmarks
3DMark - Night Raid Graphics 96.594
Testconfiguratie
  • Windows benchmarks
3DMark - Night Raid CPU 12.308
Testconfiguratie
  • Windows benchmarks
Cinebench R15 - Single 270
Testconfiguratie
  • Windows benchmarks
Cinebench R15 - Multi 2.564
Testconfiguratie
  • Windows benchmarks
Cinebench R20 - Single 659
Testconfiguratie
  • Windows benchmarks
Cinebench R20 - Multi 6.301
Testconfiguratie
  • Windows benchmarks
Cinebench R23 - Single 1.712
Testconfiguratie
  • Windows benchmarks
Cinebench R23 - Multi 16.272
Testconfiguratie
  • Windows benchmarks
Blender duurtest run #1 17,43
Testconfiguratie
  • Windows benchmarks
Blender duurtest run #2 17,95
Testconfiguratie
  • Windows benchmarks
Blender duurtest run #3 17,61
Testconfiguratie
  • Windows benchmarks
Blender duurtest run #4 17,59
Testconfiguratie
  • Windows benchmarks
Blender duurtest run #5 17,59
Testconfiguratie
  • Windows benchmarks
Blender duurtest run #6 17,53
Testconfiguratie
  • Windows benchmarks
Blender duurtest run #7 17,52
Testconfiguratie
  • Windows benchmarks
Blender duurtest run #8 17,55
Testconfiguratie
  • Windows benchmarks
Blender duurtest run #9 17,47
Testconfiguratie
  • Windows benchmarks
Blender duurtest run #10 17,55
Testconfiguratie
  • Windows benchmarks
Blender duurtest run #11 17,47
Testconfiguratie
  • Windows benchmarks
Blender duurtest run #12 17,59
Testconfiguratie
  • Windows benchmarks
Blender duurtest run #13 17,48
Testconfiguratie
  • Windows benchmarks
Blender duurtest run #14 17,58
Testconfiguratie
  • Windows benchmarks
Blender duurtest run #15 17,58
Testconfiguratie
  • Windows benchmarks
Blender duurtest run #16 17,56
Testconfiguratie
  • Windows benchmarks
Blender duurtest run #17 17,5
Testconfiguratie
  • Windows benchmarks
Blender duurtest run #18 17,57
Testconfiguratie
  • Windows benchmarks
Blender duurtest run #19 17,53
Testconfiguratie
  • Windows benchmarks
Blender duurtest run #20 17,47
Testconfiguratie
  • Windows benchmarks
Blender duurtest run #21 17,47
Testconfiguratie
  • Windows benchmarks
Blender duurtest run #22 17,54
Testconfiguratie
  • Windows benchmarks
Blender duurtest run #23 17,56
Testconfiguratie
  • Windows benchmarks
Blender duurtest run #24 17,55
Testconfiguratie
  • Windows benchmarks
Blender duurtest run #25 17,55
Testconfiguratie
  • Windows benchmarks
Blender duurtest run #26 17,6
Testconfiguratie
  • Windows benchmarks
Blender duurtest run #27 17,58
Testconfiguratie
  • Windows benchmarks
Blender duurtest run #28 17,65
Testconfiguratie
  • Windows benchmarks
Blender duurtest run #29 17,53
Testconfiguratie
  • Windows benchmarks
Blender duurtest run #30 17,57
Testconfiguratie
  • Windows benchmarks
Blender duurtest run #31 17,56
Testconfiguratie
  • Windows benchmarks
Blender duurtest run #32 17,65
Testconfiguratie
  • Windows benchmarks
Blender duurtest run #33 17,6
Testconfiguratie
  • Windows benchmarks
Blender duurtest run #34 17,56
Testconfiguratie
  • Windows benchmarks
Blender duurtest run #35 17,62
Testconfiguratie
  • Windows benchmarks
Blender duurtest run #36 17,56
Testconfiguratie
  • Windows benchmarks
Blender duurtest run #37 17,55
Testconfiguratie
  • Windows benchmarks
Blender duurtest run #38 17,59
Testconfiguratie
  • Windows benchmarks
Blender duurtest run #39 17,68
Testconfiguratie
  • Windows benchmarks
Blender duurtest run #40 17,57
Testconfiguratie
  • Windows benchmarks
Blender duurtest run #41 17,52
Testconfiguratie
  • Windows benchmarks
Blender duurtest run #42 17,57
Testconfiguratie
  • Windows benchmarks
Blender duurtest run #43 17,54
Testconfiguratie
  • Windows benchmarks
Blender duurtest run #44 17,56
Testconfiguratie
  • Windows benchmarks
Blender duurtest run #45 17,55
Testconfiguratie
  • Windows benchmarks
Blender duurtest run #46 17,49
Testconfiguratie
  • Windows benchmarks
Blender duurtest run #47 17,62
Testconfiguratie
  • Windows benchmarks
Blender duurtest run #48 17,47
Testconfiguratie
  • Windows benchmarks
Blender duurtest run #49 17,54
Testconfiguratie
  • Windows benchmarks
Blender duurtest run #50 17,54
Testconfiguratie
  • Windows benchmarks
PCMark 10 Extended 9.636
Testconfiguratie
  • Windows benchmarks
PCMark 10 Essentials 10.252
Testconfiguratie
  • Windows benchmarks
PCMark 10 App Start-up 14.361
Testconfiguratie
  • Windows benchmarks
PCMark 10 Video Conferencing 8.343
Testconfiguratie
  • Windows benchmarks
PCMark 10 Web Browsing 8.995
Testconfiguratie
  • Windows benchmarks
PCMark 10 Productivity 9.709
Testconfiguratie
  • Windows benchmarks
PCMark 10 Spreadsheets 12.453
Testconfiguratie
  • Windows benchmarks
PCMark 10 Writing 7.571
Testconfiguratie
  • Windows benchmarks
PCMark 10 Digital Content Creation 10.987
Testconfiguratie
  • Windows benchmarks
PCMark 10 Photo Editing 15.188
Testconfiguratie
  • Windows benchmarks
PCMark 10 Rendering and Visualization 14.416
Testconfiguratie
  • Windows benchmarks
PCMark 10 Video Editing 6.059
Testconfiguratie
  • Windows benchmarks
PCMark 10 Gaming 21.311
Testconfiguratie
  • Windows benchmarks
PCMark 10 Graphics 30.431
Testconfiguratie
  • Windows benchmarks
PCMark 10 Physics 24.466
Testconfiguratie
  • Windows benchmarks
PCMark 10 Combined 11.966
Testconfiguratie
  • Windows benchmarks

Energieverbruik / Accu

Energieverbruik uit 0,8 W
Testconfiguratie
  • Windows benchmarks
Energieverbruik adapter (zonder laptop) 0 W
Testconfiguratie
  • Windows benchmarks
Energieverbruik idle 16 W
Testconfiguratie
  • Windows benchmarks
Browser accutest - 180 cd/m2 544 min.
Testconfiguratie
  • Windows benchmarks
PCMark 10 Accu Digital 6.313
Testconfiguratie
  • Windows benchmarks
PCMark 10 Accu Essentials 7.129
Testconfiguratie
  • Windows benchmarks
PCMark 10 Accu Productivity 5.890
Testconfiguratie
  • Windows benchmarks
PCMark 10 Accu Duration in Minuten 151
Testconfiguratie
  • Windows benchmarks
PCMark 10 Accu Aantal Runs 6
Testconfiguratie
  • Windows benchmarks

Testresultaten beeldscherm

Gemeten kleurruimte sRGB
Testconfiguratie
  • Beeldscherm test SpectraCal CALman 5.13
Kleurtemperatuur 6.300 K
Testconfiguratie
  • Beeldscherm test SpectraCal CALman 5.13
Afwijking kleurtemperatuur wit van 6504K 204 K
Testconfiguratie
  • Beeldscherm test SpectraCal CALman 5.13
Gemiddelde kleurtemperatuur 6.184 K
Testconfiguratie
  • Beeldscherm test SpectraCal CALman 5.13
Afwijking gemiddelde kleurtemperatuur van 6504K 320 K
Testconfiguratie
  • Beeldscherm test SpectraCal CALman 5.13
Helderheid wit 151 cd/m²
Testconfiguratie
  • Beeldscherm test SpectraCal CALman 5.13
Helderheid zwart 0,11 cd/m²
Testconfiguratie
  • Beeldscherm test SpectraCal CALman 5.13
Contrast 1.372,6 : 1
Testconfiguratie
  • Beeldscherm test SpectraCal CALman 5.13
Checkerboard wit 335,01 cd/m²
Testconfiguratie
  • Beeldscherm test SpectraCal CALman 5.13
Checkerboard zwart 0,239 cd/m²
Testconfiguratie
  • Beeldscherm test SpectraCal CALman 5.13
Checkerboard contrast 1.402 : 1
Testconfiguratie
  • Beeldscherm test SpectraCal CALman 5.13
Gamma 2,27
Testconfiguratie
  • Beeldscherm test SpectraCal CALman 5.13
Gamma (afwijking van 2,2) 0,07
Testconfiguratie
  • Beeldscherm test SpectraCal CALman 5.13
Gemiddelde kleurafwijking (Delta E 2000) 7,1 mΔuv
Testconfiguratie
  • Beeldscherm test SpectraCal CALman 5.13
Gemiddelde kleurafwijking ΔE ITP 25,56 Δuv
Testconfiguratie
  • Beeldscherm test SpectraCal CALman 5.13
Gemiddelde gedetailleerde kleur-afwijking ΔE 2000 5,56 Δuv
Testconfiguratie
  • Beeldscherm test SpectraCal CALman 5.13
Gemiddelde gedetailleerde kleur-afwijking ΔE ITP 17,12 Δuv
Testconfiguratie
  • Beeldscherm test SpectraCal CALman 5.13
Gemiddelde grijsafwijking (Delta E 2000) 2,3 mΔuv
Testconfiguratie
  • Beeldscherm test SpectraCal CALman 5.13
Gemiddelde grijsafwijking ΔE ITP 4,66 Δuv
Testconfiguratie
  • Beeldscherm test SpectraCal CALman 5.13
sRGB dekking 64,6 %
Testconfiguratie
  • Beeldscherm test SpectraCal CALman 5.13
DCI-P3 dekking 47,8 %
Testconfiguratie
  • Beeldscherm test SpectraCal CALman 5.13
Rec 2020 dekking 34,3 %
Testconfiguratie
  • Beeldscherm test SpectraCal CALman 5.13
0