Getest

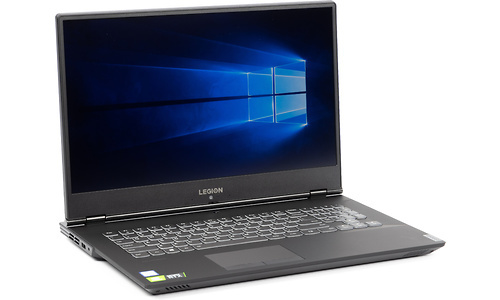
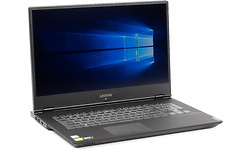
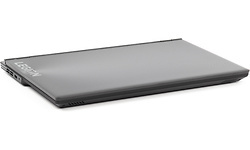
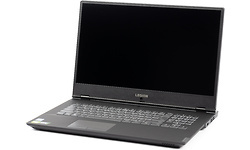
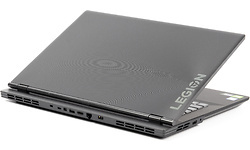
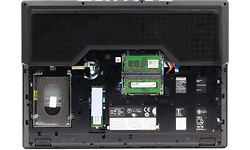
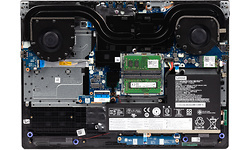
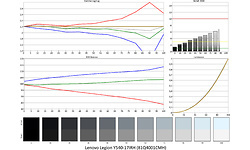
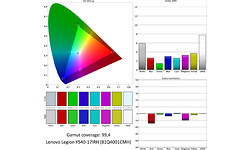
Lenovo Legion Y540-17IRH (81Q4001CMH)

Prijsverloop

Dit product is niet (meer) verkrijgbaar bij de bij Hardware Info aangesloten shops.

Specificaties

Belangrijkste specificaties

Processor type Intel Core i7 9750H
Geheugen capaciteit 16 GB
Scherm diagonaal 17,3 inch
Resolutie 1920x1080
Touchscreen
GPU type Nvidia GeForce RTX 2060
Totale opslagcapaciteit 1.024 GB
Toetsenbordindeling Qwerty
Gewicht totaal 2,75 kg
Besturingssysteem (serie) Windows

Processor / Chipset / Geheugen

Processor serie Intel Core i7
Processor type Intel Core i7 9750H
Processor klokfrequentie 2,6 GHz
Processor klokfrequentie (max. turbo) 4,5 GHz
Configureerbare TDP-down 35 W
Aantal processorcores 6
Geheugen capaciteit 16 GB
Type geheugen DDR4
Geheugen klokfrequentie 2.667 MHz
Geheugen form factor Sodimm
SODIMM sloten 2
Vrije SODIMM sloten 0
Werkgeheugen uitbreidbaar tot 16 GB

Scherm

Scherm diagonaal 17,3 inch
Resolutie 1920x1080
Verhouding 16:9
Pixeldichtheid 127 ppi
Scherm type (mat/glans) Mat
Paneeltype IPS
LED-achtergrondverlichting
Touchscreen
Geschikt voor peninvoer
Maximale verversingsfrequentie 144 Hz

Graphics

GPU type Nvidia GeForce RTX 2060
Geïntegreerde / losse GPU Losse chip
Videogeheugen 6 GB

Opslag

Totale opslagcapaciteit 1.024 GB
SSD opslagcapaciteit 1.024 GB
Beschikbaar opslaggeheugen 914,9 GB
Aantal harddisks / SSD's 1
Harddisk/SSD 1 capaciteit 1.024 GB
Harddisk/SSD 1 soort SSD/Flash
Harddisk/SSD 1 form factor M.2
Harddisk/SSD 1 merk/product Samsung MZVLW1T0HMLH-00000
DVD branden
Blu-ray lezen
Blu-ray branden

Connectiviteit / Netwerk

Netwerkaansluiting (bedraad)
Netwerkadapter (bedraad) Realtek PCIe GBE
Netwerksnelheid (bedraad) 1000 Mbit/s
WiFi standaard 802.11ac (Wi-Fi 5)
WiFi adapter Intel Wireless-AC 9560
Bluetooth
Bluetooth-versie Bluetooth 5.0
3G (HSPA/UMTS)
4G (LTE)

Aansluitingen

Smartcard
USB 3.2 - 5 Gb/s (Type-A) 3
USB 3.2 - 5 Gb/s (Type-C) 1
Cardreader - SD
Cardreader - MicroSD
DVI-uitgang
VGA-uitgang
HDMI-uitgang
Aantal HDMI-uitgangen 1
Micro HDMI-uitgang
HDMI-versie 2.0
DisplayPort-uitgang
Mini DisplayPort-uitgang
Aantal mini DisplayPort-uitgangen 1
Analoge audio aansluitingen 1
Aansluiting dockingstation
Kensingtonslot

Toetsenbord en touchpad

Toetsenbordindeling Qwerty
Numeriek toetsenbord

Camera

Webcam
Webcam resolutie 0,9 MPixel
Tweede camera
Flitser
Camera Windows Hello compatible

Sensors

Accelerometer
Vingerafdruklezer
GPS
Kompas
NFC

Overige hardware

Trusted Platform Module (TPM)
Geïntegreerde microfoon

Maten en gewichten

Accu capaciteit (Wh) 57,5 Wh
Verwisselbare accu
Gewicht totaal 2,75 kg
Afmeting - Breedte 40 cm
Afmeting - Diepte 29 cm
Afmeting - Hoogte/Dikte 2,79 cm

Software

Besturingssysteem Microsoft Windows 10 Home
Besturingssysteem (serie) Windows
Aantal bits OS 64 bit

Fabrikantsopgave eigenschappen

Garantie 2 jaar

Productcodes

SKU 81Q4001CMH
EAN 0193386574705
Toegevoegd aan Hardware Info vrijdag 12 juli 2019

Testresultaten

Dit product is door Hardware Info getest op dinsdag 13 augustus 2019.

Platform onafhankelijke tests

Opstarttijd 9,91 sec.
Testconfiguratie
  • Platform onafhankelijke tests
WiFi speedtest 2.4GHz receive 213 Mbit/s
Testconfiguratie
  • Platform onafhankelijke tests
WiFi speedtest 2.4GHz send 184 Mbit/s
Testconfiguratie
  • Platform onafhankelijke tests
WiFi speedtest 5.0GHz receive 559 Mbit/s
Testconfiguratie
  • Platform onafhankelijke tests
WiFi speedtest 5.0GHz send 651 Mbit/s
Testconfiguratie
  • Platform onafhankelijke tests

Windows benchmarks

3DMark - Ice Storm 160.073
Testconfiguratie
  • Windows benchmarks
3DMark - Cloud Gate 37.474
Testconfiguratie
  • Windows benchmarks
3DMark - Cloud Gate Graphics 98.232
Testconfiguratie
  • Windows benchmarks
3DMark - Cloud Gate Physics 11.841
Testconfiguratie
  • Windows benchmarks
3DMark - Fire Strike 13.911
Testconfiguratie
  • Windows benchmarks
3DMark - Fire Strike Graphics 14.988
Testconfiguratie
  • Windows benchmarks
3DMark - Fire Strike Physics 17.943
Testconfiguratie
  • Windows benchmarks
3DMark - Fire Strike Combined 7.417
Testconfiguratie
  • Windows benchmarks
3DMark - Fire Strike Extreme 7.023
Testconfiguratie
  • Windows benchmarks
3DMark - Time Spy 5.872
Testconfiguratie
  • Windows benchmarks
3DMark - Time Spy Graphics 6.040
Testconfiguratie
  • Windows benchmarks
3DMark - Time Spy CPU 7.213
Testconfiguratie
  • Windows benchmarks
Cinebench R15 - Single 113
Testconfiguratie
  • Windows benchmarks
Cinebench R15 - Multi 825
Testconfiguratie
  • Windows benchmarks
PCMark 8 v2 - Home 4.438
Testconfiguratie
  • Windows benchmarks
PCMark 8 v2 - Creative 5.655
Testconfiguratie
  • Windows benchmarks
PCMark 8 v2 - Work 3.921
Testconfiguratie
  • Windows benchmarks
PCMark 8 - Storage 2.0 - Storage Score 5.066
Testconfiguratie
  • Windows benchmarks
PCMark 8 - Storage 2.0 - Storage Bandwidth 523,09 MB/s
Testconfiguratie
  • Windows benchmarks
Geekbench4 - Multi 23.402
Testconfiguratie
  • Windows benchmarks
Geekbench4 - Multi crypto 15.129
Testconfiguratie
  • Windows benchmarks
Geekbench4 - Multi integer 29.301
Testconfiguratie
  • Windows benchmarks
Geekbench4 - Multi float 28.002
Testconfiguratie
  • Windows benchmarks
Geekbench4 - Multi memory 5.298
Testconfiguratie
  • Windows benchmarks
Geekbench4 - Single 5.182
Testconfiguratie
  • Windows benchmarks
Geekbench4 - Single crypto 4.981
Testconfiguratie
  • Windows benchmarks
Geekbench4 - Single integer 5.461
Testconfiguratie
  • Windows benchmarks
Geekbench4 - Single float 5.296
Testconfiguratie
  • Windows benchmarks
Geekbench4 - Single memory 4.436
Testconfiguratie
  • Windows benchmarks

Energieverbruik / Accu

Energieverbruik uit 0,3 W
Testconfiguratie
  • Windows benchmarks
Energieverbruik adapter (zonder laptop) 0,2 W
Testconfiguratie
  • Windows benchmarks
Energieverbruik idle 15,6 W
Testconfiguratie
  • Windows benchmarks
Browser accutest - 180 cd/m2 175 min.
Testconfiguratie
  • Windows benchmarks
PCMark Creative accutest - 180 cd/m2 114 min.
Testconfiguratie
  • Windows benchmarks
PCMark Creative (Accu) 3.841
Testconfiguratie
  • Windows benchmarks

Testresultaten beeldscherm

Gemeten kleurruimte sRGB
Testconfiguratie
  • Beeldscherm test SpectraCal CALman 5.13
Kleurtemperatuur 7.638 K
Testconfiguratie
  • Beeldscherm test SpectraCal CALman 5.13
Helderheid wit 333 cd/m²
Testconfiguratie
  • Beeldscherm test SpectraCal CALman 5.13
Helderheid zwart 0,24 cd/m²
Testconfiguratie
  • Beeldscherm test SpectraCal CALman 5.13
Contrast 1.386,5 : 1
Testconfiguratie
  • Beeldscherm test SpectraCal CALman 5.13
Gamma 2,14
Testconfiguratie
  • Beeldscherm test SpectraCal CALman 5.13
Gamma (afwijking van 2,2) 0,06
Testconfiguratie
  • Beeldscherm test SpectraCal CALman 5.13
Kleurafwijking rood (Delta E 1994) 3,00
Testconfiguratie
  • Beeldscherm test SpectraCal CALman 5 i.c.m. X
  • Rite i1 Display Pro colorimeter
Kleurafwijking groen (Delta E 1994) 1,57
Testconfiguratie
  • Beeldscherm test SpectraCal CALman 5 i.c.m. X
  • Rite i1 Display Pro colorimeter
Kleurafwijking blauw (Delta E 1994) 2,82
Testconfiguratie
  • Beeldscherm test SpectraCal CALman 5 i.c.m. X
  • Rite i1 Display Pro colorimeter
Kleurafwijking cyaan (Delta E 1994) 2,63
Testconfiguratie
  • Beeldscherm test SpectraCal CALman 5 i.c.m. X
  • Rite i1 Display Pro colorimeter
Kleurafwijking magenta (Delta E 1994) 3,59
Testconfiguratie
  • Beeldscherm test SpectraCal CALman 5 i.c.m. X
  • Rite i1 Display Pro colorimeter
Kleurafwijking geel (Delta E 1994) 3,53
Testconfiguratie
  • Beeldscherm test SpectraCal CALman 5 i.c.m. X
  • Rite i1 Display Pro colorimeter
Gemiddelde kleurafwijking (Delta E 1994) 2,9
Testconfiguratie
  • Beeldscherm test SpectraCal CALman 5 i.c.m. X
  • Rite i1 Display Pro colorimeter
Gemiddelde grijsafwijking (Delta E 1994) 5,0
Testconfiguratie
  • Beeldscherm test SpectraCal CALman 5 i.c.m. X
  • Rite i1 Display Pro colorimeter
Kleurafwijking 75% rood (Delta E 2000) 2,66 mΔuv
Testconfiguratie
  • Beeldscherm test SpectraCal CALman 5 i.c.m. X
  • Rite i1 Display Pro colorimeter
Kleurafwijking 75% groen (Delta E 2000) 1,46 mΔuv
Testconfiguratie
  • Beeldscherm test SpectraCal CALman 5 i.c.m. X
  • Rite i1 Display Pro colorimeter
Kleurafwijking 75% blauw (Delta E 2000) 3,02 mΔuv
Testconfiguratie
  • Beeldscherm test SpectraCal CALman 5 i.c.m. X
  • Rite i1 Display Pro colorimeter
Kleurafwijking 75% cyaan (Delta E 2000) 2,61 mΔuv
Testconfiguratie
  • Beeldscherm test SpectraCal CALman 5 i.c.m. X
  • Rite i1 Display Pro colorimeter
Kleurafwijking 75% magenta (Delta E 2000) 3,31 mΔuv
Testconfiguratie
  • Beeldscherm test SpectraCal CALman 5 i.c.m. X
  • Rite i1 Display Pro colorimeter
Kleurafwijking 75% geel (Delta E 2000) 3,72 mΔuv
Testconfiguratie
  • Beeldscherm test SpectraCal CALman 5 i.c.m. X
  • Rite i1 Display Pro colorimeter
Gemiddelde kleurafwijking excl. wit (Delta E 2000) 2,8
Testconfiguratie
  • Beeldscherm test SpectraCal CALman 5 i.c.m. X
  • Rite i1 Display Pro colorimeter
Gemiddelde grijsafwijking (Delta E 2000) 4,8 mΔuv
Testconfiguratie
  • Beeldscherm test SpectraCal CALman 5.13
Reactietijd 0%-100% 5,6 ms
Testconfiguratie
  • Beeldscherm test SpectraCal CALman 5.13
Reactietijd 100%-0% 4,5 ms
Testconfiguratie
  • Beeldscherm test SpectraCal CALman 5.13
Reactietijd 20%-80% 7,8 ms
Testconfiguratie
  • Beeldscherm test SpectraCal CALman 5.13
Reactietijd 80%-20% 6,3 ms
Testconfiguratie
  • Beeldscherm test SpectraCal CALman 5.13

Windows Game Benchmarks 2018

Far Cry 5 - 1920x1080 - Medium 105 fps
Testconfiguratie
  • Windows Game Benchmarks 2018
Far Cry 5 - 1920x1080 - Ultra 89 fps
Testconfiguratie
  • Windows Game Benchmarks 2018
Far Cry 5 - 3840x2160 - Medium 38 fps
Testconfiguratie
  • Windows Game Benchmarks 2018
Far Cry 5 - 3840x2160 - Ultra 32 fps
Testconfiguratie
  • Windows Game Benchmarks 2018
GTA V - 1920x1080 - Medium 104 fps
Testconfiguratie
  • Windows Game Benchmarks 2018
GTA V - 1920x1080 - Ultra 83 fps
Testconfiguratie
  • Windows Game Benchmarks 2018
GTA V - 3840x2160 - Medium 63 fps
Testconfiguratie
  • Windows Game Benchmarks 2018
GTA V - 3840x2160 - Ultra 32 fps
Testconfiguratie
  • Windows Game Benchmarks 2018
Rise of the Tomb Raider - 1920x1080 - Medium 136 fps
Testconfiguratie
  • Windows Game Benchmarks 2018
Rise of the Tomb Raider - 1920x1080 - Ultra 86,8 fps
Testconfiguratie
  • Windows Game Benchmarks 2018
Rise of the Tomb Raider - 3840x2160 - Medium 47,07 fps
Testconfiguratie
  • Windows Game Benchmarks 2018
Rise of the Tomb Raider - 3840x2160 - Ultra 31,03 fps
Testconfiguratie
  • Windows Game Benchmarks 2018
0