

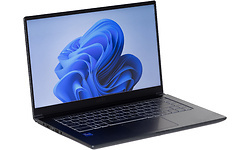
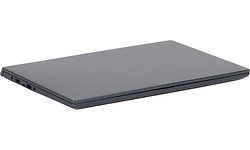
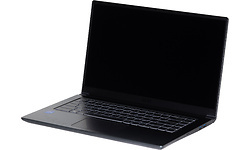
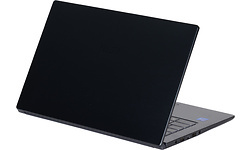
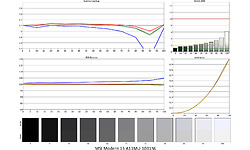
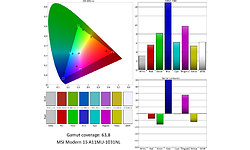
MSI Modern 15 A11MU-1031NL


Dit product is niet (meer) verkrijgbaar bij de bij Hardware Info aangesloten shops.
| Processor serie | Intel Core i7 |
| Processor type | Intel Core i7 1195G7 |
| Processor klokfrequentie | 2,9 GHz |
| Processor klokfrequentie (max. turbo) | 5 GHz |
| Configureerbare TDP-down | 12 W |
| Configureerbare TDP-up | 28 W |
| Configureerbare TDP-downfrequentie | 1 GHz |
| Configureerbare TDP-upfrequentie | 3 GHz |
| Aantal processorcores | 4 |
| Geheugen capaciteit | 16 GB |
| Type geheugen | DDR4 |
| Geheugen klokfrequentie | 3.200 MHz |
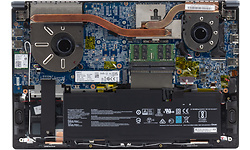
| Geheugen form factor | On-board + Sodimm |
| SODIMM sloten | 2 |
| Vrije SODIMM sloten | 1 |
| Werkgeheugen uitbreidbaar tot | 64 GB |
| Scherm diagonaal | 15,6 inch |
| Resolutie | 1920x1080 |
| Verhouding | 16:9 |
| Pixeldichtheid | 141 ppi |
| Scherm type (mat/glans) | Mat |
| Paneeltype | IPS |
| Touchscreen | |
| Maximale verversingsfrequentie | 60 Hz |
| GPU type | Intel Iris Xe Graphics G7 (Tiger Lake 96 EU) |
| Geïntegreerde / losse GPU | Geïntegreerd |
| Totale opslagcapaciteit | 512 GB |
| SSD opslagcapaciteit | 512 GB |
| Beschikbaar opslaggeheugen | 384,6 GB |
| Harddisk/SSD 1 capaciteit | 384,6 GB |
| Harddisk/SSD 1 soort | SSD/Flash |
| Harddisk/SSD 1 form factor | M.2 |
| Harddisk/SSD 1 merk/product | Kingston OM8PDP3512B-AI1 |
| DVD branden | |
| Blu-ray lezen | |
| Blu-ray branden |
| Netwerkaansluiting (bedraad) | |
| WiFi standaard | 802.11ax (Wi-Fi 6) |
| WiFi adapter | Intel(R) Wi-Fi 6 AX201 160Mhz |
| Bluetooth | |
| Bluetooth-versie | Bluetooth 5.2 |
| 4G (LTE) | |
| 5G |
| Smartcard | |
| USB 2.0 (Type-A) | 1 |
| USB 3.2 - 5 Gb/s (Type-C) | 1 |
| USB 3.2 - 10 Gb/s (Type-A) | 2 |
| Cardreader - SD | |
| Cardreader - MicroSD | |
| DVI-uitgang | |
| VGA-uitgang | |
| HDMI-uitgang | |
| Aantal HDMI-uitgangen | 1 |
| Micro HDMI-uitgang | |
| HDMI-versie | 2.1 |
| DisplayPort-uitgang | |
| Mini DisplayPort-uitgang | |
| Analoge audio aansluitingen | 1 |
| Aansluiting dockingstation | |
| Kensingtonslot |
| Toetsenbordindeling | Qwerty |
| Numeriek toetsenbord | |
| Toetsenbordverlichting helderheidsniveaus | 3 |
| Toetsenbordverlichting kleur | Wit |
| Touchpad afzonderlijke muistoetsen |
| Webcam | |
| Webcam resolutie | 0,9 MPixel |
| Tweede camera | |
| Flitser | |
| Camera Windows Hello compatible | |
| Webcamschuifje |
| Accelerometer | |
| Vingerafdruklezer | |
| NFC |
| Geïntegreerde microfoon |
| Accu capaciteit (Wh) | 52 Wh |
| Verwisselbare accu | |
| Gewicht totaal | 1,61 kg |
| Afmeting - Breedte | 35,68 cm |
| Afmeting - Diepte | 23,38 cm |
| Afmeting - Hoogte/Dikte | 1,9 cm |
| Passief gekoeld |
| Besturingssysteem | Microsoft Windows 11 Home |
| Besturingssysteem (serie) | Windows |
| Windows versie | 22H2 |
| Windows OS Build | 22.621,126 |
| Aantal bits OS | 64 bit |
| Garantie | 2 jaar |
| SKU | MODERN 15 A11MU-1031NL, 9S7-155266-1031, 15A11MU1031NL | |
| EAN | 4719072950859 | |
| Toegevoegd aan Hardware Info | woensdag 3 augustus 2022 |
| PCMark 10 - Gebruiken Adobe Photoshop Heavy | 331 |
Testconfiguratie
|
|
| PCMark 10 - Storage - Totaalscore - Toegangstijd | 161 |
Testconfiguratie
|
|
| PCMark 10 - Storage - Totaalscore - Bandbreedte | 171,23 |
|
|
| PCMark 10 - Storage - Totaalscore | 1.056 |
Testconfiguratie
|
|
| PCMark 10 - 2.37GB_(399_JPEGs)_leestest | 180 |
|
|
| PCMark 10 - 2.37GB_(399_JPEGs)_kopieertest | 190 |
Testconfiguratie
|
|
| PCMark 10 - 2.37GB_(399_JPEGs)_schrijftest | 125 |
Testconfiguratie
|
|
| PCMark 10 - 2GB_(4_ISOs)_leestest | 1.404 |
Testconfiguratie
|
|
| PCMark 10 - 2GB_(4_ISOs)_kopieertest | 375 |
Testconfiguratie
|
|
| PCMark 10 - 2GB_(4_ISOs)_schrijftest | 493 |
Testconfiguratie
|
|
| PCMark 10 - Gebruiken Microsoft PowerPoint | 110 |
Testconfiguratie
|
|
| PCMark 10 - Gebruiken Microsoft Excel | 69 |
Testconfiguratie
|
|
| PCMark 10 - Gebruiken Adobe Photoshop Light | 136 |
Testconfiguratie
|
|
| PCMark 10 - Starten Windows 10 | 168 |
Testconfiguratie
|
|
| PCMark 10 - Gebruiken Adobe InDesign | 137 |
Testconfiguratie
|
|
| PCMark 10 - Gebruiken Adobe Illustrator | 102 |
|
|
| PCMark 10 - Gebruiken Adobe After Effects | 197 |
Testconfiguratie
|
|
| PCMark 10 - Starten Overwatch | 177 |
Testconfiguratie
|
|
| PCMark 10 - Starten Call of Duty: Black Ops 4 | 255 |
Testconfiguratie
|
|
| PCMark 10 - Starten Battlefield V | 333 |
Testconfiguratie
|
|
| PCMark 10 - Starten Adobe Photoshop | 102 |
Testconfiguratie
|
|
| PCMark 10 - Starten Adobe Lightroom | 72 |
Testconfiguratie
|
|
| PCMark 10 - Starten Adobe Premiere_Pro | 118 |
Testconfiguratie
|
|
| PCMark 10 - Starten Adobe Illustrator | 84 |
Testconfiguratie
|
|
| PCMark 10 - Starten Adobe After Effects | 105 |
Testconfiguratie
|
|
| PCMark 10 - Starten Adobe Acrobat | 108 |
Testconfiguratie
|
|
| PCMark 10 - Quick Storage - Totaalscore | 1.336 |
Testconfiguratie
|
|
| PCMark 10 - Quick Storage - Totaalscore - Bandbreedte | 165,08 |
Testconfiguratie
|
|
| PCMark 10 - Quick Storage - Totaalscore - Toegangstijd | 97 |
Testconfiguratie
|

