Getest

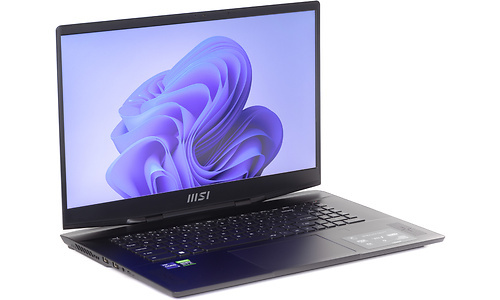
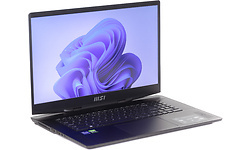
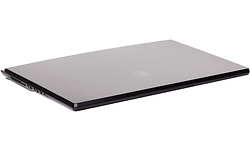
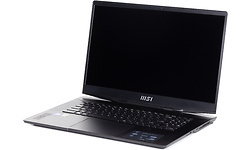
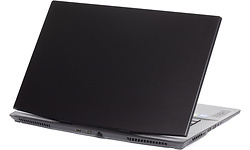
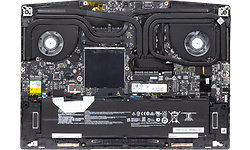
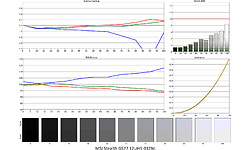
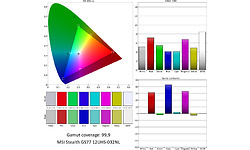
MSI Stealth GS77 12UHS-032NL

Prijsverloop

Dit product is niet (meer) verkrijgbaar bij de bij Hardware Info aangesloten shops.

Specificaties

Belangrijkste specificaties

Processor type Intel Core i9 12900H
Geheugen capaciteit 64 GB
Scherm diagonaal 17,3 inch
Resolutie 3840x2160
Touchscreen
GPU type Nvidia GeForce RTX 3080 Ti
Totale opslagcapaciteit 2.048 GB
Toetsenbordindeling Qwerty
Gewicht totaal 2,91 kg
Besturingssysteem (serie) Windows Pro

Processor / Chipset / Geheugen

Processor serie Intel Core i9
Processor type Intel Core i9 12900H
Processor klokfrequentie 2,5 GHz
Processor klokfrequentie (max. turbo) 3,8 GHz
Configureerbare TDP-down 35 W
Aantal processorcores 14
Geheugen capaciteit 64 GB
Type geheugen DDR5
Geheugen klokfrequentie 4.800 MHz
Geheugen form factor Sodimm
SODIMM sloten 2
Vrije SODIMM sloten 0
Werkgeheugen uitbreidbaar tot 64 GB

Scherm

Scherm diagonaal 17,3 inch
Resolutie 3840x2160
Verhouding 16:9
Pixeldichtheid 255 ppi
Scherm type (mat/glans) Mat
Paneeltype IPS
Touchscreen
Maximale verversingsfrequentie 120 Hz

Graphics

GPU type Nvidia GeForce RTX 3080 Ti
Geïntegreerde / losse GPU Losse chip
Videogeheugen 16 GB

Opslag

Totale opslagcapaciteit 2.048 GB
SSD opslagcapaciteit 2.048 GB
Beschikbaar opslaggeheugen 1.794,6 GB
Aantal harddisks / SSD's 1
Harddisk/SSD 1 capaciteit 2.048 GB
Harddisk/SSD 1 soort SSD/Flash
Harddisk/SSD 1 form factor M.2
Harddisk/SSD 1 merk/product Samsung MZVL22T0HBLB-00B00
DVD branden
Blu-ray lezen
Blu-ray branden

Connectiviteit / Netwerk

Netwerkaansluiting (bedraad)
Netwerkadapter (bedraad) Killer E3100G 2.5 Gigabit Ethernet Controller
Netwerksnelheid (bedraad) 2500 Mbit/s
WiFi standaard 802.11ax (Wi-Fi 6E)
WiFi adapter Killer(R) Wi-Fi 6E AX1675i 160MHz Wireless Network Adapter (211NGW)
Bluetooth
Bluetooth-versie Bluetooth 5.2
4G (LTE)
5G

Aansluitingen

Smartcard
USB 3.2 - 5 Gb/s (Type-A) 2
USB 3.2 - 5 Gb/s (Type-C) 1
Thunderbolt 4 (Type-C) 1
Cardreader - SD
Cardreader - MicroSD
DVI-uitgang
VGA-uitgang
HDMI-uitgang
Aantal HDMI-uitgangen 1
Micro HDMI-uitgang
HDMI-versie 2.1
DisplayPort-uitgang
Mini DisplayPort-uitgang
Analoge audio aansluitingen 1
Aansluiting dockingstation
Kensingtonslot

Toetsenbord en touchpad

Toetsenbordindeling Qwerty
Numeriek toetsenbord
Toetsenbordverlichting helderheidsniveaus 4
Toetsenbordverlichting kleur RGB
Touchpad MS Precision compatible
Touchpad afzonderlijke muistoetsen

Camera

Webcam
Tweede camera
Flitser
Camera Windows Hello compatible
Webcamschuifje

Sensors

Accelerometer
Vingerafdruklezer
NFC

Overige hardware

Geïntegreerde microfoon

Maten en gewichten

Accu capaciteit (Wh) 99 Wh
Verwisselbare accu
Gewicht totaal 2,91 kg
Afmeting - Breedte 39,7 cm
Afmeting - Diepte 28,3 cm
Afmeting - Hoogte/Dikte 2,95 cm
Passief gekoeld

Software

Besturingssysteem Microsoft Windows 11 Pro
Besturingssysteem (serie) Windows Pro
Windows versie 21H2
Windows OS Build 22.000,556
Aantal bits OS 64 bit

Fabrikantsopgave eigenschappen

Garantie 2 jaar

Productcodes

SKU STEALTH GS77 12UHS-032NL, 9S7-17P112-032, GS77 12UHS-032NL
EAN 4719072933944
Toegevoegd aan Hardware Info vrijdag 25 februari 2022

Testresultaten

Dit product is door Hardware Info getest op vrijdag 8 april 2022.

Metro Exodus

Metro Exodus - 1920x1080 - Medium 113,2 fps
Testconfiguratie
  • Game benchmarks 2022
Metro Exodus - 1920x1080 - Medium (99p) 17,26 ms
Testconfiguratie
  • Game benchmarks 2022
Metro Exodus - 1920x1080 - Medium (99.9p) 20,23 ms
Testconfiguratie
  • Game benchmarks 2022
Metro Exodus - 1920x1080 - Ultra 70,8 fps
Testconfiguratie
  • Game benchmarks 2022
Metro Exodus - 1920x1080 - Ultra (99p) 30,22 ms
Testconfiguratie
  • Game benchmarks 2022
Metro Exodus - 1920x1080 - Ultra (99.9p) 34,46 ms
Testconfiguratie
  • Game benchmarks 2022
Metro Exodus - 2560x1440 - Medium 80,1 fps
Testconfiguratie
  • Game benchmarks 2022
Metro Exodus - 2560x1440 - Medium (99p) 20,88 ms
Testconfiguratie
  • Game benchmarks 2022
Metro Exodus - 2560x1440 - Medium (99.9p) 23,62 ms
Testconfiguratie
  • Game benchmarks 2022
Metro Exodus - 2560x1440 - Ultra 54,4 fps
Testconfiguratie
  • Game benchmarks 2022
Metro Exodus - 2560x1440 - Ultra (99p) 30,22 ms
Testconfiguratie
  • Game benchmarks 2022
Metro Exodus - 2560x1440 - Ultra (99.9p) 34,46 ms
Testconfiguratie
  • Game benchmarks 2022
Metro Exodus - 3840x2160 - Medium 46,6 fps
Testconfiguratie
  • Game benchmarks 2022
Metro Exodus - 3840x2160 - Medium (99p) 33,3 ms
Testconfiguratie
  • Game benchmarks 2022
Metro Exodus - 3840x2160 - Medium (99.9p) 36,82 ms
Testconfiguratie
  • Game benchmarks 2022
Metro Exodus - 3840x2160 - Ultra 33,3 fps
Testconfiguratie
  • Game benchmarks 2022
Metro Exodus - 3840x2160 - Ultra (99p) 45,09 ms
Testconfiguratie
  • Game benchmarks 2022
Metro Exodus - 3840x2160 - Ultra (99.9p) 54,54 ms
Testconfiguratie
  • Game benchmarks 2022
Metro Exodus - 1920x1080 - Ultra (DXR - High) 59 fps
Testconfiguratie
  • Game benchmarks 2022
Metro Exodus - 1920x1080 - Ultra (DXR - High) (99p) 28,78 ms
Testconfiguratie
  • Game benchmarks 2022
Metro Exodus - 1920x1080 - Ultra (DXR - High) (99.9p) 37,99 ms
Testconfiguratie
  • Game benchmarks 2022
Metro Exodus - 2560x1440 - Ultra (DXR - High) 58,1 fps
Testconfiguratie
  • Game benchmarks 2022
Metro Exodus - 2560x1440 - Ultra (DXR - High) (99p) 29,34 ms
Testconfiguratie
  • Game benchmarks 2022
Metro Exodus - 2560x1440 - Ultra (DXR - High) (99.9p) 33,63 ms
Testconfiguratie
  • Game benchmarks 2022

Total War: Troy

Total War: Troy - 1920x1080 - Medium 205,9 fps
Testconfiguratie
  • Game benchmarks 2022
Total War: Troy - 1920x1080 - Medium (99p) 6,16 ms
Testconfiguratie
  • Game benchmarks 2022
Total War: Troy - 1920x1080 - Medium (99.9p) 7,12 ms
Testconfiguratie
  • Game benchmarks 2022
Total War: Troy - 1920x1080 - Ultra 99,6 fps
Testconfiguratie
  • Game benchmarks 2022
Total War: Troy - 1920x1080 - Ultra (99p) 13,93 ms
Testconfiguratie
  • Game benchmarks 2022
Total War: Troy - 1920x1080 - Ultra (99.9p) 21,89 ms
Testconfiguratie
  • Game benchmarks 2022
Total War: Troy - 2560x1440 - Medium 142,9 fps
Testconfiguratie
  • Game benchmarks 2022
Total War: Troy - 2560x1440 - Medium (99p) 8,74 ms
Testconfiguratie
  • Game benchmarks 2022
Total War: Troy - 2560x1440 - Medium (99.9p) 9,74 ms
Testconfiguratie
  • Game benchmarks 2022
Total War: Troy - 2560x1440 - Ultra 72,8 fps
Testconfiguratie
  • Game benchmarks 2022
Total War: Troy - 2560x1440 - Ultra (99p) 19,75 ms
Testconfiguratie
  • Game benchmarks 2022
Total War: Troy - 2560x1440 - Ultra (99.9p) 24,02 ms
Testconfiguratie
  • Game benchmarks 2022
Total War: Troy - 3840x2160 - Medium 81,9 fps
Testconfiguratie
  • Game benchmarks 2022
Total War: Troy - 3840x2160 - Medium (99p) 15,47 ms
Testconfiguratie
  • Game benchmarks 2022
Total War: Troy - 3840x2160 - Medium (99.9p) 16,77 ms
Testconfiguratie
  • Game benchmarks 2022
Total War: Troy - 3840x2160 - Ultra 42,8 fps
Testconfiguratie
  • Game benchmarks 2022
Total War: Troy - 3840x2160 - Ultra (99p) 28,93 ms
Testconfiguratie
  • Game benchmarks 2022
Total War: Troy - 3840x2160 - Ultra (99.9p) 40,92 ms
Testconfiguratie
  • Game benchmarks 2022

Far Cry: New Dawn

Far Cry: New Dawn - 1920x1080 - Medium 141 fps
Testconfiguratie
  • Game benchmarks 2022
Far Cry: New Dawn - 1920x1080 - Medium (99p) 9,5 ms
Testconfiguratie
  • Game benchmarks 2022
Far Cry: New Dawn - 1920x1080 - Medium (99.9p) 13,82 ms
Testconfiguratie
  • Game benchmarks 2022
Far Cry: New Dawn - 1920x1080 - Ultra 114,7 fps
Testconfiguratie
  • Game benchmarks 2022
Far Cry: New Dawn - 1920x1080 - Ultra (99p) 11,86 ms
Testconfiguratie
  • Game benchmarks 2022
Far Cry: New Dawn - 1920x1080 - Ultra (99.9p) 14,18 ms
Testconfiguratie
  • Game benchmarks 2022
Far Cry: New Dawn - 2560x1440 - Medium 112,7 fps
Testconfiguratie
  • Game benchmarks 2022
Far Cry: New Dawn - 2560x1440 - Medium (99p) 11,58 ms
Testconfiguratie
  • Game benchmarks 2022
Far Cry: New Dawn - 2560x1440 - Medium (99.9p) 20,72 ms
Testconfiguratie
  • Game benchmarks 2022
Far Cry: New Dawn - 2560x1440 - Ultra 94,7 fps
Testconfiguratie
  • Game benchmarks 2022
Far Cry: New Dawn - 2560x1440 - Ultra (99p) 14,58 ms
Testconfiguratie
  • Game benchmarks 2022
Far Cry: New Dawn - 2560x1440 - Ultra (99.9p) 25,2 ms
Testconfiguratie
  • Game benchmarks 2022
Far Cry: New Dawn - 3840x2160 - Medium 61,4 fps
Testconfiguratie
  • Game benchmarks 2022
Far Cry: New Dawn - 3840x2160 - Medium (99p) 20,9 ms
Testconfiguratie
  • Game benchmarks 2022
Far Cry: New Dawn - 3840x2160 - Medium (99.9p) 30,02 ms
Testconfiguratie
  • Game benchmarks 2022
Far Cry: New Dawn - 3840x2160 - Ultra 53,2 fps
Testconfiguratie
  • Game benchmarks 2022
Far Cry: New Dawn - 3840x2160 - Ultra (99p) 24,94 ms
Testconfiguratie
  • Game benchmarks 2022
Far Cry: New Dawn - 3840x2160 - Ultra (99.9p) 31,5 ms
Testconfiguratie
  • Game benchmarks 2022

F1 2020

F1 2020 (DX12) - 1920x1080 - Medium 242,7 fps
Testconfiguratie
  • Game benchmarks 2022
F1 2020 (DX12) - 1920x1080 - Medium (99p) 5,6 ms
Testconfiguratie
  • Game benchmarks 2022
F1 2020 (DX12) - 1920x1080 - Medium (99.9p) 7,5 ms
Testconfiguratie
  • Game benchmarks 2022
F1 2020 (DX12) - 1920x1080 - Ultra 166,2 fps
Testconfiguratie
  • Game benchmarks 2022
F1 2020 (DX12) - 1920x1080 - Ultra (99p) 7,7 ms
Testconfiguratie
  • Game benchmarks 2022
F1 2020 (DX12) - 1920x1080 - Ultra (99.9p) 9,3 ms
Testconfiguratie
  • Game benchmarks 2022
F1 2020 (DX12) - 2560x1440 - Medium 181,9 fps
Testconfiguratie
  • Game benchmarks 2022
F1 2020 (DX12) - 2560x1440 - Medium (99p) 6,7 ms
Testconfiguratie
  • Game benchmarks 2022
F1 2020 (DX12) - 2560x1440 - Medium (99.9p) 8,4 ms
Testconfiguratie
  • Game benchmarks 2022
F1 2020 (DX12) - 2560x1440 - Ultra 122,1 fps
Testconfiguratie
  • Game benchmarks 2022
F1 2020 (DX12) - 2560x1440 - Ultra (99p) 10,2 ms
Testconfiguratie
  • Game benchmarks 2022
F1 2020 (DX12) - 2560x1440 - Ultra (99.9p) 13,7 ms
Testconfiguratie
  • Game benchmarks 2022
F1 2020 (DX12) - 3840x2160 - Medium 118,2 fps
Testconfiguratie
  • Game benchmarks 2022
F1 2020 (DX12) - 3840x2160 - Medium (99p) 10 ms
Testconfiguratie
  • Game benchmarks 2022
F1 2020 (DX12) - 3840x2160 - Medium (99.9p) 12,8 ms
Testconfiguratie
  • Game benchmarks 2022
F1 2020 (DX12) - 3840x2160 - Ultra 78 fps
Testconfiguratie
  • Game benchmarks 2022
F1 2020 (DX12) - 3840x2160 - Ultra (99p) 16,4 ms
Testconfiguratie
  • Game benchmarks 2022
F1 2020 (DX12) - 3840x2160 - Ultra (99.9p) 30 ms
Testconfiguratie
  • Game benchmarks 2022

Geluidstest

Noise floor 14 dB(A)
Testconfiguratie
  • Geluidsdichte ruimte 2021
  • Larson Davis SoundAdvisor Model 831C
Afstand geluidsmeting 50 cm
Testconfiguratie
  • Geluidsdichte ruimte 2021
  • Larson Davis SoundAdvisor Model 831C
WebXPRT 3 - LAeq 24,5 dB
Testconfiguratie
  • Geluidsdichte ruimte 2021
  • Larson Davis SoundAdvisor Model 831C
PCMark 10 Express - LAeq 31,2 dB
Testconfiguratie
  • Geluidsdichte ruimte 2021
  • Larson Davis SoundAdvisor Model 831C
Blender - LAeq 42,9 dB
Testconfiguratie
  • Geluidsdichte ruimte 2021
  • Larson Davis SoundAdvisor Model 831C
F1 2020 - LAeq 46 dB
Testconfiguratie
  • Geluidsdichte ruimte 2021
  • Larson Davis SoundAdvisor Model 831C

PCMark 10 Storage

PCMark 10 - Gebruiken Adobe Photoshop Heavy 914
Testconfiguratie
  • Windows benchmarks
PCMark 10 - Storage - Totaalscore - Toegangstijd 60
Testconfiguratie
  • Windows benchmarks
PCMark 10 - Storage - Totaalscore - Bandbreedte 436,98
PCMark 10 - Storage - Totaalscore 2.763
Testconfiguratie
  • Windows benchmarks
PCMark 10 - 2.37GB_(399_JPEGs)_leestest 576
PCMark 10 - 2.37GB_(399_JPEGs)_kopieertest 840
Testconfiguratie
  • Windows benchmarks
PCMark 10 - 2.37GB_(399_JPEGs)_schrijftest 590
Testconfiguratie
  • Windows benchmarks
PCMark 10 - 2GB_(4_ISOs)_leestest 3.861
Testconfiguratie
  • Windows benchmarks
PCMark 10 - 2GB_(4_ISOs)_kopieertest 3.361
Testconfiguratie
  • Windows benchmarks
PCMark 10 - 2GB_(4_ISOs)_schrijftest 2.894
Testconfiguratie
  • Windows benchmarks
PCMark 10 - Gebruiken Microsoft PowerPoint 142
Testconfiguratie
  • Windows benchmarks
PCMark 10 - Gebruiken Microsoft Excel 163
Testconfiguratie
  • Windows benchmarks
PCMark 10 - Gebruiken Adobe Photoshop Light 271
Testconfiguratie
  • Windows benchmarks
PCMark 10 - Starten Windows 10 374
Testconfiguratie
  • Windows benchmarks
PCMark 10 - Gebruiken Adobe InDesign 236
Testconfiguratie
  • Windows benchmarks
PCMark 10 - Gebruiken Adobe Illustrator 180
PCMark 10 - Gebruiken Adobe After Effects 390
Testconfiguratie
  • Windows benchmarks
PCMark 10 - Starten Overwatch 386
Testconfiguratie
  • Windows benchmarks
PCMark 10 - Starten Call of Duty: Black Ops 4 869
Testconfiguratie
  • Windows benchmarks
PCMark 10 - Starten Battlefield V 867
Testconfiguratie
  • Windows benchmarks
PCMark 10 - Starten Adobe Photoshop 207
Testconfiguratie
  • Windows benchmarks
PCMark 10 - Starten Adobe Lightroom 134
Testconfiguratie
  • Windows benchmarks
PCMark 10 - Starten Adobe Premiere_Pro 227
Testconfiguratie
  • Windows benchmarks
PCMark 10 - Starten Adobe Illustrator 144
Testconfiguratie
  • Windows benchmarks
PCMark 10 - Starten Adobe After Effects 208
Testconfiguratie
  • Windows benchmarks
PCMark 10 - Starten Adobe Acrobat 249
Testconfiguratie
  • Windows benchmarks
PCMark 10 - Quick Storage - Totaalscore 3.086
Testconfiguratie
  • Windows benchmarks
PCMark 10 - Quick Storage - Totaalscore - Bandbreedte 372,4
Testconfiguratie
  • Windows benchmarks
PCMark 10 - Quick Storage - Totaalscore - Toegangstijd 41
Testconfiguratie
  • Windows benchmarks

Platform onafhankelijke tests

Opstarttijd 31 sec.
Testconfiguratie
  • Platform onafhankelijke tests
JetStream 2 258,956
Testconfiguratie
  • Platform onafhankelijke tests
webXPRT 3 359
Testconfiguratie
  • Platform onafhankelijke tests
webXPRT 3 - Photo Enhancement 196 ms
Testconfiguratie
  • Platform onafhankelijke tests
webXPRT 3 - Organize Album using AI 1.556 ms
Testconfiguratie
  • Platform onafhankelijke tests
webXPRT 3 - Stock Option Pricing 92 ms
Testconfiguratie
  • Platform onafhankelijke tests
webXPRT 3 - Encrypt Notes and OCR Scan 1.346 ms
Testconfiguratie
  • Platform onafhankelijke tests
webXPRT 3 - Sales Graphs 243 ms
Testconfiguratie
  • Platform onafhankelijke tests
webXPRT 3 - Online Homework 657 ms
Testconfiguratie
  • Platform onafhankelijke tests
Geekbench 5 - Multi 14.439
Testconfiguratie
  • Platform onafhankelijke tests
Geekbench 5 - Multi Crypto 12.445
Testconfiguratie
  • Platform onafhankelijke tests
Geekbench 5 - Multi Integer 14.055
Testconfiguratie
  • Platform onafhankelijke tests
Geekbench 5 - Multi Floating Point 15.602
Testconfiguratie
  • Platform onafhankelijke tests
Geekbench 5 - Single 1.880
Testconfiguratie
  • Platform onafhankelijke tests
Geekbench 5 - Single Crypto 4.061
Testconfiguratie
  • Platform onafhankelijke tests
Geekbench 5 - Single Integer 1.673
Testconfiguratie
  • Platform onafhankelijke tests
Geekbench 5 - Single Floating Point 1.966
Testconfiguratie
  • Platform onafhankelijke tests
Geekbench 5 - OpenCL 130.437
Testconfiguratie
  • Platform onafhankelijke tests
WiFi speedtest 2.4GHz receive 207 Mbit/s
Testconfiguratie
  • Platform onafhankelijke tests
WiFi speedtest 2.4GHz send 171 Mbit/s
Testconfiguratie
  • Platform onafhankelijke tests
WiFi speedtest 5.0GHz receive 558 Mbit/s
Testconfiguratie
  • Platform onafhankelijke tests
WiFi speedtest 5.0GHz send 626 Mbit/s
Testconfiguratie
  • Platform onafhankelijke tests

Windows benchmarks

3DMark - Fire Strike 23.305
Testconfiguratie
  • Windows benchmarks
3DMark - Fire Strike Graphics 25.450
Testconfiguratie
  • Windows benchmarks
3DMark - Fire Strike Physics 29.751
Testconfiguratie
  • Windows benchmarks
3DMark - Fire Strike Combined 11.908
Testconfiguratie
  • Windows benchmarks
3DMark - Fire Strike Extreme 12.437
Testconfiguratie
  • Windows benchmarks
3DMark - Time Spy 10.391
Testconfiguratie
  • Windows benchmarks
3DMark - Time Spy Graphics 9.995
Testconfiguratie
  • Windows benchmarks
3DMark - Time Spy CPU 13.400
Testconfiguratie
  • Windows benchmarks
3DMark - Night Raid 39.026
Testconfiguratie
  • Windows benchmarks
3DMark - Night Raid Graphics 55.132
Testconfiguratie
  • Windows benchmarks
3DMark - Night Raid CPU 14.697
Testconfiguratie
  • Windows benchmarks
Cinebench R15 - Single 273
Testconfiguratie
  • Windows benchmarks
Cinebench R15 - Multi 2.932
Testconfiguratie
  • Windows benchmarks
Cinebench R20 - Single 730
Testconfiguratie
  • Windows benchmarks
Cinebench R20 - Multi 6.976
Testconfiguratie
  • Windows benchmarks
Cinebench R23 - Single 1.894
Testconfiguratie
  • Windows benchmarks
Cinebench R23 - Multi 18.176
Testconfiguratie
  • Windows benchmarks
Blender duurtest run #1 15,11
Testconfiguratie
  • Windows benchmarks
Blender duurtest run #2 15,58
Testconfiguratie
  • Windows benchmarks
Blender duurtest run #3 15,99
Testconfiguratie
  • Windows benchmarks
Blender duurtest run #4 17,72
Testconfiguratie
  • Windows benchmarks
Blender duurtest run #5 18,76
Testconfiguratie
  • Windows benchmarks
Blender duurtest run #6 18,53
Testconfiguratie
  • Windows benchmarks
Blender duurtest run #7 18,52
Testconfiguratie
  • Windows benchmarks
Blender duurtest run #8 18,56
Testconfiguratie
  • Windows benchmarks
Blender duurtest run #9 18,52
Testconfiguratie
  • Windows benchmarks
Blender duurtest run #10 18,66
Testconfiguratie
  • Windows benchmarks
Blender duurtest run #11 18,57
Testconfiguratie
  • Windows benchmarks
Blender duurtest run #12 18,56
Testconfiguratie
  • Windows benchmarks
Blender duurtest run #13 18,61
Testconfiguratie
  • Windows benchmarks
Blender duurtest run #14 18,56
Testconfiguratie
  • Windows benchmarks
Blender duurtest run #15 18,59
Testconfiguratie
  • Windows benchmarks
Blender duurtest run #16 18,74
Testconfiguratie
  • Windows benchmarks
Blender duurtest run #17 18,55
Testconfiguratie
  • Windows benchmarks
Blender duurtest run #18 18,58
Testconfiguratie
  • Windows benchmarks
Blender duurtest run #19 18,61
Testconfiguratie
  • Windows benchmarks
Blender duurtest run #20 18,6
Testconfiguratie
  • Windows benchmarks
Blender duurtest run #21 18,63
Testconfiguratie
  • Windows benchmarks
Blender duurtest run #22 18,66
Testconfiguratie
  • Windows benchmarks
Blender duurtest run #23 18,58
Testconfiguratie
  • Windows benchmarks
Blender duurtest run #24 18,58
Testconfiguratie
  • Windows benchmarks
Blender duurtest run #25 18,61
Testconfiguratie
  • Windows benchmarks
Blender duurtest run #26 18,6
Testconfiguratie
  • Windows benchmarks
Blender duurtest run #27 18,63
Testconfiguratie
  • Windows benchmarks
Blender duurtest run #28 18,58
Testconfiguratie
  • Windows benchmarks
Blender duurtest run #29 18,66
Testconfiguratie
  • Windows benchmarks
Blender duurtest run #30 18,64
Testconfiguratie
  • Windows benchmarks
Blender duurtest run #31 18,54
Testconfiguratie
  • Windows benchmarks
Blender duurtest run #32 18,58
Testconfiguratie
  • Windows benchmarks
Blender duurtest run #33 18,65
Testconfiguratie
  • Windows benchmarks
Blender duurtest run #34 18,58
Testconfiguratie
  • Windows benchmarks
Blender duurtest run #35 18,54
Testconfiguratie
  • Windows benchmarks
Blender duurtest run #36 18,6
Testconfiguratie
  • Windows benchmarks
Blender duurtest run #37 18,55
Testconfiguratie
  • Windows benchmarks
Blender duurtest run #38 18,54
Testconfiguratie
  • Windows benchmarks
Blender duurtest run #39 18,66
Testconfiguratie
  • Windows benchmarks
Blender duurtest run #40 18,65
Testconfiguratie
  • Windows benchmarks
Blender duurtest run #41 18,55
Testconfiguratie
  • Windows benchmarks
Blender duurtest run #42 18,6
Testconfiguratie
  • Windows benchmarks
Blender duurtest run #43 18,55
Testconfiguratie
  • Windows benchmarks
Blender duurtest run #44 18,68
Testconfiguratie
  • Windows benchmarks
Blender duurtest run #45 18,62
Testconfiguratie
  • Windows benchmarks
Blender duurtest run #46 18,67
Testconfiguratie
  • Windows benchmarks
Blender duurtest run #47 18,51
Testconfiguratie
  • Windows benchmarks
Blender duurtest run #48 18,57
Testconfiguratie
  • Windows benchmarks
Blender duurtest run #49 18,71
Testconfiguratie
  • Windows benchmarks
Blender duurtest run #50 18,64
Testconfiguratie
  • Windows benchmarks
PCMark 10 Extended 9.654
Testconfiguratie
  • Windows benchmarks
PCMark 10 Essentials 10.761
Testconfiguratie
  • Windows benchmarks
PCMark 10 App Start-up 15.632
Testconfiguratie
  • Windows benchmarks
PCMark 10 Video Conferencing 8.003
Testconfiguratie
  • Windows benchmarks
PCMark 10 Web Browsing 9.963
Testconfiguratie
  • Windows benchmarks
PCMark 10 Productivity 10.001
Testconfiguratie
  • Windows benchmarks
PCMark 10 Spreadsheets 12.366
Testconfiguratie
  • Windows benchmarks
PCMark 10 Writing 8.089
Testconfiguratie
  • Windows benchmarks
PCMark 10 Digital Content Creation 11.689
Testconfiguratie
  • Windows benchmarks
PCMark 10 Photo Editing 15.107
Testconfiguratie
  • Windows benchmarks
PCMark 10 Rendering and Visualization 14.911
Testconfiguratie
  • Windows benchmarks
PCMark 10 Video Editing 7.091
Testconfiguratie
  • Windows benchmarks
PCMark 10 Gaming 18.666
Testconfiguratie
  • Windows benchmarks
PCMark 10 Graphics 24.088
Testconfiguratie
  • Windows benchmarks
PCMark 10 Physics 28.668
Testconfiguratie
  • Windows benchmarks
PCMark 10 Combined 12.035
Testconfiguratie
  • Windows benchmarks

Energieverbruik / Accu

Energieverbruik uit 1,1 W
Testconfiguratie
  • Windows benchmarks
Energieverbruik adapter (zonder laptop) 0 W
Testconfiguratie
  • Windows benchmarks
Energieverbruik idle 33,9 W
Testconfiguratie
  • Windows benchmarks
Browser accutest - 180 cd/m2 359 min.
Testconfiguratie
  • Windows benchmarks
PCMark 10 Accu Digital 5.115
Testconfiguratie
  • Windows benchmarks
PCMark 10 Accu Essentials 7.213
Testconfiguratie
  • Windows benchmarks
PCMark 10 Accu Productivity 6.625
Testconfiguratie
  • Windows benchmarks
PCMark 10 Accu Duration in Minuten 152
Testconfiguratie
  • Windows benchmarks
PCMark 10 Accu Aantal Runs 5
Testconfiguratie
  • Windows benchmarks

Testresultaten beeldscherm

Gemeten kleurruimte sRGB
Testconfiguratie
  • Beeldscherm test SpectraCal CALman 5.13
Kleurtemperatuur 7.441 K
Testconfiguratie
  • Beeldscherm test SpectraCal CALman 5.13
Helderheid wit 446 cd/m²
Testconfiguratie
  • Beeldscherm test SpectraCal CALman 5.13
Helderheid zwart 0,48 cd/m²
Testconfiguratie
  • Beeldscherm test SpectraCal CALman 5.13
Contrast 929,1 : 1
Testconfiguratie
  • Beeldscherm test SpectraCal CALman 5.13
Checkerboard wit 446,12 cd/m²
Testconfiguratie
  • Beeldscherm test SpectraCal CALman 5.13
Checkerboard zwart 0,485 cd/m²
Testconfiguratie
  • Beeldscherm test SpectraCal CALman 5.13
Checkerboard contrast 920 : 1
Testconfiguratie
  • Beeldscherm test SpectraCal CALman 5.13
Gamma 2,13
Testconfiguratie
  • Beeldscherm test SpectraCal CALman 5.13
Gamma (afwijking van 2,2) 0,07
Testconfiguratie
  • Beeldscherm test SpectraCal CALman 5.13
Kleurafwijking rood (Delta E 1994) 1,12
Testconfiguratie
  • Beeldscherm test SpectraCal CALman 5 i.c.m. X
  • Rite i1 Display Pro colorimeter
Kleurafwijking groen (Delta E 1994) 1,30
Testconfiguratie
  • Beeldscherm test SpectraCal CALman 5 i.c.m. X
  • Rite i1 Display Pro colorimeter
Kleurafwijking blauw (Delta E 1994) 2,55
Testconfiguratie
  • Beeldscherm test SpectraCal CALman 5 i.c.m. X
  • Rite i1 Display Pro colorimeter
Kleurafwijking cyaan (Delta E 1994) 4,55
Testconfiguratie
  • Beeldscherm test SpectraCal CALman 5 i.c.m. X
  • Rite i1 Display Pro colorimeter
Kleurafwijking magenta (Delta E 1994) 1,84
Testconfiguratie
  • Beeldscherm test SpectraCal CALman 5 i.c.m. X
  • Rite i1 Display Pro colorimeter
Kleurafwijking geel (Delta E 1994) 1,57
Testconfiguratie
  • Beeldscherm test SpectraCal CALman 5 i.c.m. X
  • Rite i1 Display Pro colorimeter
Gemiddelde kleurafwijking (Delta E 1994) 2,2
Testconfiguratie
  • Beeldscherm test SpectraCal CALman 5 i.c.m. X
  • Rite i1 Display Pro colorimeter
Gemiddelde grijsafwijking (Delta E 1994) 5,2
Testconfiguratie
  • Beeldscherm test SpectraCal CALman 5 i.c.m. X
  • Rite i1 Display Pro colorimeter
Kleurafwijking 75% wit (Delta E 2000) 5,56 mΔuv
Testconfiguratie
  • Beeldscherm test SpectraCal CALman 5 i.c.m. X
  • Rite i1 Display Pro colorimeter
Kleurafwijking 75% rood (Delta E 2000) 1,1 mΔuv
Testconfiguratie
  • Beeldscherm test SpectraCal CALman 5 i.c.m. X
  • Rite i1 Display Pro colorimeter
Kleurafwijking 75% groen (Delta E 2000) 1,16 mΔuv
Testconfiguratie
  • Beeldscherm test SpectraCal CALman 5 i.c.m. X
  • Rite i1 Display Pro colorimeter
Kleurafwijking 75% blauw (Delta E 2000) 1,97 mΔuv
Testconfiguratie
  • Beeldscherm test SpectraCal CALman 5 i.c.m. X
  • Rite i1 Display Pro colorimeter
Kleurafwijking 75% cyaan (Delta E 2000) 4,53 mΔuv
Testconfiguratie
  • Beeldscherm test SpectraCal CALman 5 i.c.m. X
  • Rite i1 Display Pro colorimeter
Kleurafwijking 75% magenta (Delta E 2000) 1,71 mΔuv
Testconfiguratie
  • Beeldscherm test SpectraCal CALman 5 i.c.m. X
  • Rite i1 Display Pro colorimeter
Kleurafwijking 75% geel (Delta E 2000) 1,74 mΔuv
Testconfiguratie
  • Beeldscherm test SpectraCal CALman 5 i.c.m. X
  • Rite i1 Display Pro colorimeter
Gemiddelde kleurafwijking (Delta E 2000) 3,3 mΔuv
Testconfiguratie
  • Beeldscherm test SpectraCal CALman 5.13
Kleurafwijking 100% wit (Delta E 2000) 8,97 mΔuv
Testconfiguratie
  • Beeldscherm test SpectraCal CALman 5 i.c.m. X
  • Rite i1 Display Pro colorimeter
Gemiddelde kleurafwijking excl. wit (Delta E 2000) 2,0
Testconfiguratie
  • Beeldscherm test SpectraCal CALman 5 i.c.m. X
  • Rite i1 Display Pro colorimeter
Gemiddelde grijsafwijking (Delta E 2000) 4,7 mΔuv
Testconfiguratie
  • Beeldscherm test SpectraCal CALman 5.13
sRGB dekking 93,3 %
Testconfiguratie
  • Beeldscherm test SpectraCal CALman 5.13
DCI-P3 dekking 68,8 %
Testconfiguratie
  • Beeldscherm test SpectraCal CALman 5.13
Rec 2020 dekking 49,4 %
Testconfiguratie
  • Beeldscherm test SpectraCal CALman 5.13
0