Getest

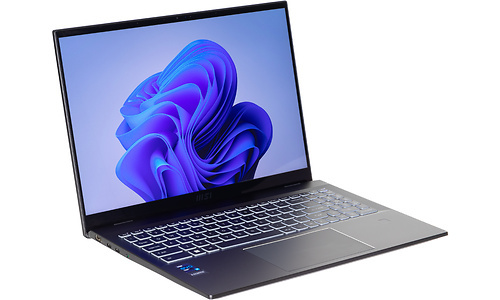
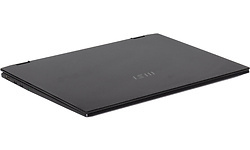
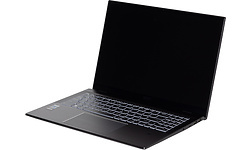
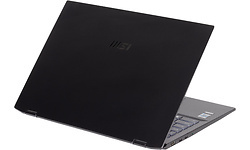
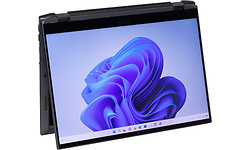
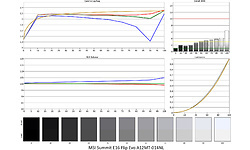
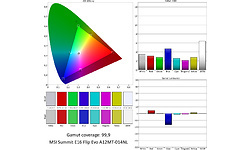
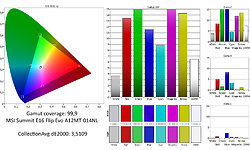
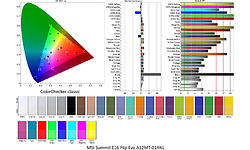
MSI Summit E16 Flip Evo A12MT-014NL

Prijsverloop

Specificaties

Belangrijkste specificaties

Processor type Intel Core i7 1280P
Geheugen capaciteit 16 GB
Scherm diagonaal 16 inch
Resolutie 1920x1200
Touchscreen
GPU type Intel Iris Xe Graphics G7 (Tiger Lake 96 EU)
Totale opslagcapaciteit 1.024 GB
Toetsenbordindeling Qwerty
Gewicht totaal 2,12 kg
Besturingssysteem (serie) Windows Pro

Processor / Chipset / Geheugen

Processor serie Intel Core i7
Processor type Intel Core i7 1280P
Processor klokfrequentie 2 GHz
Processor klokfrequentie (max. turbo) 4,8 GHz
Configureerbare TDP-down 20 W
Configureerbare TDP-up 64 W
Configureerbare TDP-downfrequentie 1 GHz
Aantal processorcores 14
Geheugen capaciteit 16 GB
Type geheugen LPDDR5
Geheugen klokfrequentie 4.800 MHz
Geheugen form factor On-board
Werkgeheugen uitbreidbaar tot 32 GB

Scherm

Scherm diagonaal 16 inch
Resolutie 1920x1200
Verhouding 16:10
Pixeldichtheid 142 ppi
Scherm type (mat/glans) Glanzend
Paneeltype IPS
Touchscreen
Aanraakpunten touchscreen 100 aanraakpunten
Touchscreen type Capacitief
Maximale verversingsfrequentie 165 Hz

Graphics

GPU type Intel Iris Xe Graphics G7 (Tiger Lake 96 EU)
Geïntegreerde / losse GPU Geïntegreerd

Opslag

Totale opslagcapaciteit 1.024 GB
SSD opslagcapaciteit 1.024 GB
Beschikbaar opslaggeheugen 870,3 GB
Aantal harddisks / SSD's 1
Harddisk/SSD 1 capaciteit 870,3 GB
Harddisk/SSD 1 soort SSD/Flash
Harddisk/SSD 1 form factor M.2
Harddisk/SSD 1 merk/product Samsung MZVL21T0HCLR-00B00
DVD branden
Blu-ray lezen
Blu-ray branden

Connectiviteit / Netwerk

Netwerkaansluiting (bedraad)
WiFi standaard 802.11ax (Wi-Fi 6E)
WiFi adapter Killer(R) Wi-Fi 6E AX1675i 160MHz Wireless Network Adapter (211NGW)
Bluetooth
Bluetooth-versie Bluetooth 5.3
4G (LTE)
5G

Aansluitingen

Smartcard
USB 3.2 - 10 Gb/s (Type-A) 2
Thunderbolt 4 (Type-C) 2
Cardreader - SD
Cardreader - MicroSD
DVI-uitgang
VGA-uitgang
HDMI-uitgang
Aantal HDMI-uitgangen 1
Micro HDMI-uitgang
HDMI-versie 2.1
DisplayPort-uitgang
Mini DisplayPort-uitgang
Analoge audio aansluitingen 1
Aansluiting dockingstation
Kensingtonslot

Toetsenbord en touchpad

Toetsenbordindeling Qwerty
Numeriek toetsenbord
Toetsenbordverlichting helderheidsniveaus 3
Toetsenbordverlichting kleur Wit
Touchpad afzonderlijke muistoetsen

Camera

Webcam
Webcam resolutie 2,1 MPixel
Tweede camera
Flitser
Camera Windows Hello compatible
Webcamschuifje

Sensors

Accelerometer
Vingerafdruklezer
NFC

Overige hardware

Geïntegreerde microfoon

Maten en gewichten

Accu capaciteit (Wh) 76,7 Wh
Verwisselbare accu
Gewicht totaal 2,12 kg
Afmeting - Breedte 35,8 cm
Afmeting - Diepte 25,8 cm
Afmeting - Hoogte/Dikte 1,79 cm
Passief gekoeld

Software

Besturingssysteem Microsoft Windows 11 Pro
Besturingssysteem (serie) Windows Pro
Windows versie 22H2
Windows OS Build 22.621,141
Aantal bits OS 64 bit

Fabrikantsopgave eigenschappen

Garantie 2 jaar

Productcodes

SKU E16FLIPEVO A12MT-014NL, E16FLIPA12MT014NL, SUMMIT E16FLIPEVO A12MT-014NL, 9S7-159231-014
EAN 4719072927219
Toegevoegd aan Hardware Info woensdag 30 maart 2022

Testresultaten

Dit product is door Hardware Info getest op maandag 27 maart 2023.

Geluidstest

Noise floor 14 dB(A)
Testconfiguratie
  • Geluidsdichte ruimte 2021
  • Larson Davis SoundAdvisor Model 831C
Afstand geluidsmeting 50 cm
Testconfiguratie
  • Geluidsdichte ruimte 2021
  • Larson Davis SoundAdvisor Model 831C
WebXPRT 3 - LAeq 14 dB
Testconfiguratie
  • Geluidsdichte ruimte 2021
  • Larson Davis SoundAdvisor Model 831C
PCMark 10 Express - LAeq 18,6 dB
Testconfiguratie
  • Geluidsdichte ruimte 2021
  • Larson Davis SoundAdvisor Model 831C
Blender - LAeq 38,8 dB
Testconfiguratie
  • Geluidsdichte ruimte 2021
  • Larson Davis SoundAdvisor Model 831C

PCMark 10 Storage

PCMark 10 - Gebruiken Adobe Photoshop Heavy 847
Testconfiguratie
  • Windows benchmarks
PCMark 10 - Storage - Totaalscore - Toegangstijd 62
Testconfiguratie
  • Windows benchmarks
PCMark 10 - Storage - Totaalscore - Bandbreedte 419,54
PCMark 10 - Storage - Totaalscore 2.663
Testconfiguratie
  • Windows benchmarks
PCMark 10 - 2.37GB_(399_JPEGs)_leestest 496
PCMark 10 - 2.37GB_(399_JPEGs)_kopieertest 711
Testconfiguratie
  • Windows benchmarks
PCMark 10 - 2.37GB_(399_JPEGs)_schrijftest 477
Testconfiguratie
  • Windows benchmarks
PCMark 10 - 2GB_(4_ISOs)_leestest 3.479
Testconfiguratie
  • Windows benchmarks
PCMark 10 - 2GB_(4_ISOs)_kopieertest 3.215
Testconfiguratie
  • Windows benchmarks
PCMark 10 - 2GB_(4_ISOs)_schrijftest 2.863
Testconfiguratie
  • Windows benchmarks
PCMark 10 - Gebruiken Microsoft PowerPoint 115
Testconfiguratie
  • Windows benchmarks
PCMark 10 - Gebruiken Microsoft Excel 154
Testconfiguratie
  • Windows benchmarks
PCMark 10 - Gebruiken Adobe Photoshop Light 262
Testconfiguratie
  • Windows benchmarks
PCMark 10 - Starten Windows 10 359
Testconfiguratie
  • Windows benchmarks
PCMark 10 - Gebruiken Adobe InDesign 204
Testconfiguratie
  • Windows benchmarks
PCMark 10 - Gebruiken Adobe Illustrator 214
PCMark 10 - Gebruiken Adobe After Effects 449
Testconfiguratie
  • Windows benchmarks
PCMark 10 - Starten Overwatch 344
Testconfiguratie
  • Windows benchmarks
PCMark 10 - Starten Call of Duty: Black Ops 4 855
Testconfiguratie
  • Windows benchmarks
PCMark 10 - Starten Battlefield V 770
Testconfiguratie
  • Windows benchmarks
PCMark 10 - Starten Adobe Photoshop 202
Testconfiguratie
  • Windows benchmarks
PCMark 10 - Starten Adobe Lightroom 147
Testconfiguratie
  • Windows benchmarks
PCMark 10 - Starten Adobe Premiere_Pro 253
Testconfiguratie
  • Windows benchmarks
PCMark 10 - Starten Adobe Illustrator 158
Testconfiguratie
  • Windows benchmarks
PCMark 10 - Starten Adobe After Effects 213
Testconfiguratie
  • Windows benchmarks
PCMark 10 - Starten Adobe Acrobat 237
Testconfiguratie
  • Windows benchmarks
PCMark 10 - Quick Storage - Totaalscore 2.753
Testconfiguratie
  • Windows benchmarks
PCMark 10 - Quick Storage - Totaalscore - Bandbreedte 332,54
Testconfiguratie
  • Windows benchmarks
PCMark 10 - Quick Storage - Totaalscore - Toegangstijd 46
Testconfiguratie
  • Windows benchmarks

Platform onafhankelijke tests

Opstarttijd 17,44 sec.
Testconfiguratie
  • Platform onafhankelijke tests
JetStream 2 256,834
Testconfiguratie
  • Platform onafhankelijke tests
webXPRT 3 395
Testconfiguratie
  • Platform onafhankelijke tests
webXPRT 3 - Photo Enhancement 203 ms
Testconfiguratie
  • Platform onafhankelijke tests
webXPRT 3 - Organize Album using AI 1.648 ms
Testconfiguratie
  • Platform onafhankelijke tests
webXPRT 3 - Stock Option Pricing 74 ms
Testconfiguratie
  • Platform onafhankelijke tests
webXPRT 3 - Encrypt Notes and OCR Scan 893 ms
Testconfiguratie
  • Platform onafhankelijke tests
webXPRT 3 - Sales Graphs 233 ms
Testconfiguratie
  • Platform onafhankelijke tests
webXPRT 3 - Online Homework 655 ms
Testconfiguratie
  • Platform onafhankelijke tests
WiFi speedtest 2.4GHz receive 230 Mbit/s
Testconfiguratie
  • Platform onafhankelijke tests
WiFi speedtest 2.4GHz send 161 Mbit/s
Testconfiguratie
  • Platform onafhankelijke tests
WiFi speedtest 5.0GHz receive 604 Mbit/s
Testconfiguratie
  • Platform onafhankelijke tests
WiFi speedtest 5.0GHz send 639 Mbit/s
Testconfiguratie
  • Platform onafhankelijke tests

Windows benchmarks

3DMark - Fire Strike 5.573
Testconfiguratie
  • Windows benchmarks
3DMark - Fire Strike Graphics 5.858
Testconfiguratie
  • Windows benchmarks
3DMark - Fire Strike Physics 25.135
Testconfiguratie
  • Windows benchmarks
3DMark - Fire Strike Combined 2.202
Testconfiguratie
  • Windows benchmarks
3DMark - Time Spy 2.079
Testconfiguratie
  • Windows benchmarks
3DMark - Time Spy Graphics 1.833
Testconfiguratie
  • Windows benchmarks
3DMark - Time Spy CPU 8.781
Testconfiguratie
  • Windows benchmarks
3DMark - Night Raid 19.714
Testconfiguratie
  • Windows benchmarks
3DMark - Night Raid Graphics 23.359
Testconfiguratie
  • Windows benchmarks
3DMark - Night Raid CPU 10.463
Testconfiguratie
  • Windows benchmarks
Cinebench R15 - Single 255
Testconfiguratie
  • Windows benchmarks
Cinebench R15 - Multi 2.359
Testconfiguratie
  • Windows benchmarks
Cinebench R20 - Single 606
Testconfiguratie
  • Windows benchmarks
Cinebench R20 - Multi 4.469
Testconfiguratie
  • Windows benchmarks
Cinebench R23 - Single 1.560
Testconfiguratie
  • Windows benchmarks
Cinebench R23 - Multi 11.578
Testconfiguratie
  • Windows benchmarks
Blender duurtest run #1 17,77
Testconfiguratie
  • Windows benchmarks
Blender duurtest run #2 17,75
Testconfiguratie
  • Windows benchmarks
Blender duurtest run #3 17,9
Testconfiguratie
  • Windows benchmarks
Blender duurtest run #4 20,84
Testconfiguratie
  • Windows benchmarks
Blender duurtest run #5 23,91
Testconfiguratie
  • Windows benchmarks
Blender duurtest run #6 23,97
Testconfiguratie
  • Windows benchmarks
Blender duurtest run #7 23,78
Testconfiguratie
  • Windows benchmarks
Blender duurtest run #8 23,65
Testconfiguratie
  • Windows benchmarks
Blender duurtest run #9 23,66
Testconfiguratie
  • Windows benchmarks
Blender duurtest run #10 23,74
Testconfiguratie
  • Windows benchmarks
Blender duurtest run #11 23,84
Testconfiguratie
  • Windows benchmarks
Blender duurtest run #12 23,78
Testconfiguratie
  • Windows benchmarks
Blender duurtest run #13 23,84
Testconfiguratie
  • Windows benchmarks
Blender duurtest run #14 23,86
Testconfiguratie
  • Windows benchmarks
Blender duurtest run #15 23,7
Testconfiguratie
  • Windows benchmarks
Blender duurtest run #16 23,79
Testconfiguratie
  • Windows benchmarks
Blender duurtest run #17 23,87
Testconfiguratie
  • Windows benchmarks
Blender duurtest run #18 23,71
Testconfiguratie
  • Windows benchmarks
Blender duurtest run #19 23,76
Testconfiguratie
  • Windows benchmarks
Blender duurtest run #20 23,87
Testconfiguratie
  • Windows benchmarks
Blender duurtest run #21 23,92
Testconfiguratie
  • Windows benchmarks
Blender duurtest run #22 23,85
Testconfiguratie
  • Windows benchmarks
Blender duurtest run #23 23,78
Testconfiguratie
  • Windows benchmarks
Blender duurtest run #24 23,91
Testconfiguratie
  • Windows benchmarks
Blender duurtest run #25 23,78
Testconfiguratie
  • Windows benchmarks
Blender duurtest run #26 23,88
Testconfiguratie
  • Windows benchmarks
Blender duurtest run #27 23,77
Testconfiguratie
  • Windows benchmarks
Blender duurtest run #28 23,83
Testconfiguratie
  • Windows benchmarks
Blender duurtest run #29 23,81
Testconfiguratie
  • Windows benchmarks
Blender duurtest run #30 23,86
Testconfiguratie
  • Windows benchmarks
Blender duurtest run #31 23,92
Testconfiguratie
  • Windows benchmarks
Blender duurtest run #32 23,9
Testconfiguratie
  • Windows benchmarks
Blender duurtest run #33 23,86
Testconfiguratie
  • Windows benchmarks
Blender duurtest run #34 23,92
Testconfiguratie
  • Windows benchmarks
Blender duurtest run #35 23,89
Testconfiguratie
  • Windows benchmarks
Blender duurtest run #36 23,91
Testconfiguratie
  • Windows benchmarks
Blender duurtest run #37 23,85
Testconfiguratie
  • Windows benchmarks
Blender duurtest run #38 23,96
Testconfiguratie
  • Windows benchmarks
Blender duurtest run #39 23,9
Testconfiguratie
  • Windows benchmarks
Blender duurtest run #40 24,05
Testconfiguratie
  • Windows benchmarks
Blender duurtest run #41 23,91
Testconfiguratie
  • Windows benchmarks
Blender duurtest run #42 23,93
Testconfiguratie
  • Windows benchmarks
Blender duurtest run #43 23,96
Testconfiguratie
  • Windows benchmarks
Blender duurtest run #44 23,99
Testconfiguratie
  • Windows benchmarks
Blender duurtest run #45 23,97
Testconfiguratie
  • Windows benchmarks
Blender duurtest run #46 24
Testconfiguratie
  • Windows benchmarks
Blender duurtest run #47 23,94
Testconfiguratie
  • Windows benchmarks
Blender duurtest run #48 23,9
Testconfiguratie
  • Windows benchmarks
Blender duurtest run #49 23,87
Testconfiguratie
  • Windows benchmarks
Blender duurtest run #50 23,89
Testconfiguratie
  • Windows benchmarks
PCMark 10 Extended 5.545
Testconfiguratie
  • Windows benchmarks
PCMark 10 Essentials 10.993
Testconfiguratie
  • Windows benchmarks
PCMark 10 App Start-up 15.857
Testconfiguratie
  • Windows benchmarks
PCMark 10 Video Conferencing 8.774
Testconfiguratie
  • Windows benchmarks
PCMark 10 Web Browsing 9.549
Testconfiguratie
  • Windows benchmarks
PCMark 10 Productivity 7.187
Testconfiguratie
  • Windows benchmarks
PCMark 10 Spreadsheets 6.756
Testconfiguratie
  • Windows benchmarks
PCMark 10 Writing 7.646
Testconfiguratie
  • Windows benchmarks
PCMark 10 Digital Content Creation 6.821
Testconfiguratie
  • Windows benchmarks
PCMark 10 Photo Editing 11.200
Testconfiguratie
  • Windows benchmarks
PCMark 10 Rendering and Visualization 4.938
Testconfiguratie
  • Windows benchmarks
PCMark 10 Video Editing 5.739
Testconfiguratie
  • Windows benchmarks
PCMark 10 Gaming 4.743
Testconfiguratie
  • Windows benchmarks
PCMark 10 Graphics 5.980
Testconfiguratie
  • Windows benchmarks
PCMark 10 Physics 23.826
Testconfiguratie
  • Windows benchmarks
PCMark 10 Combined 2.269
Testconfiguratie
  • Windows benchmarks

Energieverbruik / Accu

Energieverbruik uit 0,6 W
Testconfiguratie
  • Windows benchmarks
Energieverbruik adapter (zonder laptop) 0 W
Testconfiguratie
  • Windows benchmarks
Energieverbruik idle 10,2 W
Testconfiguratie
  • Windows benchmarks
Browser accutest - 180 cd/m2 655 min.
Testconfiguratie
  • Windows benchmarks
PCMark 10 Accu Digital 4.474
Testconfiguratie
  • Windows benchmarks
PCMark 10 Accu Essentials 7.772
Testconfiguratie
  • Windows benchmarks
PCMark 10 Accu Productivity 4.741
Testconfiguratie
  • Windows benchmarks
PCMark 10 Accu Duration in Minuten 327
Testconfiguratie
  • Windows benchmarks
PCMark 10 Accu Aantal Runs 9
Testconfiguratie
  • Windows benchmarks

Testresultaten beeldscherm

Gemeten kleurruimte sRGB
Testconfiguratie
  • Beeldscherm test SpectraCal CALman 5.13
Kleurtemperatuur 7.240 K
Testconfiguratie
  • Beeldscherm test SpectraCal CALman 5.13
Afwijking kleurtemperatuur wit van 6504K 736 K
Testconfiguratie
  • Beeldscherm test SpectraCal CALman 5.13
Gemiddelde kleurtemperatuur 6.981 K
Testconfiguratie
  • Beeldscherm test SpectraCal CALman 5.13
Afwijking gemiddelde kleurtemperatuur van 6504K 477 K
Testconfiguratie
  • Beeldscherm test SpectraCal CALman 5.13
Helderheid wit 150 cd/m²
Testconfiguratie
  • Beeldscherm test SpectraCal CALman 5.13
Helderheid zwart 0,15 cd/m²
Testconfiguratie
  • Beeldscherm test SpectraCal CALman 5.13
Contrast 1.000,3 : 1
Testconfiguratie
  • Beeldscherm test SpectraCal CALman 5.13
Checkerboard wit 317,98 cd/m²
Testconfiguratie
  • Beeldscherm test SpectraCal CALman 5.13
Checkerboard zwart 0,315 cd/m²
Testconfiguratie
  • Beeldscherm test SpectraCal CALman 5.13
Checkerboard contrast 1.009 : 1
Testconfiguratie
  • Beeldscherm test SpectraCal CALman 5.13
Gamma 2,05
Testconfiguratie
  • Beeldscherm test SpectraCal CALman 5.13
Gamma (afwijking van 2,2) 0,15
Testconfiguratie
  • Beeldscherm test SpectraCal CALman 5.13
Gemiddelde kleurafwijking (Delta E 2000) 3,5 mΔuv
Testconfiguratie
  • Beeldscherm test SpectraCal CALman 5.13
Gemiddelde kleurafwijking ΔE ITP 11,16 Δuv
Testconfiguratie
  • Beeldscherm test SpectraCal CALman 5.13
Gemiddelde gedetailleerde kleur-afwijking ΔE 2000 3,25 Δuv
Testconfiguratie
  • Beeldscherm test SpectraCal CALman 5.13
Gemiddelde gedetailleerde kleur-afwijking ΔE ITP 9,8 Δuv
Testconfiguratie
  • Beeldscherm test SpectraCal CALman 5.13
Gemiddelde grijsafwijking (Delta E 2000) 3,3 mΔuv
Testconfiguratie
  • Beeldscherm test SpectraCal CALman 5.13
Gemiddelde grijsafwijking ΔE ITP 5,71 Δuv
Testconfiguratie
  • Beeldscherm test SpectraCal CALman 5.13
sRGB dekking 99,9 %
Testconfiguratie
  • Beeldscherm test SpectraCal CALman 5.13
DCI-P3 dekking 86,3 %
Testconfiguratie
  • Beeldscherm test SpectraCal CALman 5.13
Rec 2020 dekking 62,5 %
Testconfiguratie
  • Beeldscherm test SpectraCal CALman 5.13
0