Getest

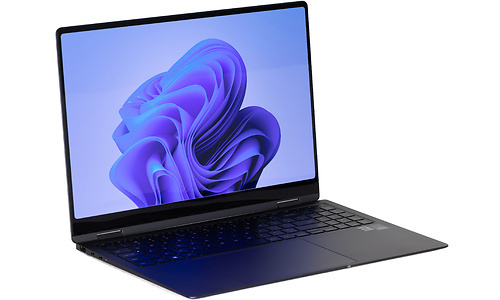
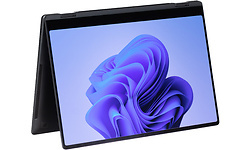
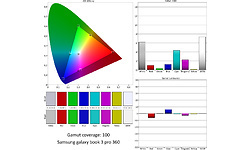
Samsung Galaxy Book3 Pro 360 (NP960QFG-KA1NL)

Prijsverloop

Specificaties

Belangrijkste specificaties

Processor type Intel Core i7 1360P
Geheugen capaciteit 16 GB
Scherm diagonaal 16 inch
Resolutie 2880x1800
Touchscreen
GPU type Intel Iris Xe Graphics G7 (Tiger Lake 96 EU)
Totale opslagcapaciteit 1.024 GB
Toetsenbordindeling Qwerty
Gewicht totaal 1,65 kg
Besturingssysteem (serie) Windows

Processor / Chipset / Geheugen

Processor serie Intel Core i7
Processor type Intel Core i7 1360P
Processor klokfrequentie 2,2 GHz
Processor klokfrequentie (max. turbo) 5 GHz
Configureerbare TDP-down 20 W
Configureerbare TDP-up 64 W
Configureerbare TDP-downfrequentie 2 GHz
Configureerbare TDP-upfrequentie 5 GHz
Aantal processorcores 12
Geheugen capaciteit 16 GB
Type geheugen LPDDR5
Geheugen klokfrequentie 6.000 MHz
Geheugen form factor On-board
Werkgeheugen uitbreidbaar tot 16 GB

Scherm

Scherm diagonaal 16 inch
Resolutie 2880x1800
Verhouding 16:10
Pixeldichtheid 212 ppi
Scherm type (mat/glans) Glanzend
Paneeltype OLED
Touchscreen
Aanraakpunten touchscreen 10 aanraakpunten
Touchscreen type Capacitief
Maximale verversingsfrequentie 120 Hz

Graphics

GPU type Intel Iris Xe Graphics G7 (Tiger Lake 96 EU)
Geïntegreerde / losse GPU Geïntegreerd

Opslag

Totale opslagcapaciteit 1.024 GB
SSD opslagcapaciteit 1.024 GB
Beschikbaar opslaggeheugen 881,1 GB
Harddisk/SSD 1 capaciteit 881,1 GB
Harddisk/SSD 1 soort SSD/Flash
Harddisk/SSD 1 form factor M.2
Harddisk/SSD 1 merk/product WDSN740-SDDPNQD-1T00-1004
DVD branden
Blu-ray lezen
Blu-ray branden

Connectiviteit / Netwerk

Netwerkaansluiting (bedraad)
WiFi standaard 802.11ax (Wi-Fi 6E)
WiFi adapter Intel(R) Wi-Fi 6E AX211 160Mhz
Bluetooth
Bluetooth-versie Bluetooth 5.3
4G (LTE)
5G

Aansluitingen

Smartcard
USB 3.2 - 5 Gb/s (Type-A) 1
Thunderbolt 4 (Type-C) 2
Cardreader - SD
Cardreader - MicroSD
DVI-uitgang
VGA-uitgang
HDMI-uitgang
Aantal HDMI-uitgangen 1
Micro HDMI-uitgang
HDMI-versie 2.0
DisplayPort-uitgang
Mini DisplayPort-uitgang
Analoge audio aansluitingen 1
Aansluiting dockingstation
Kensingtonslot

Toetsenbord en touchpad

Toetsenbordindeling Qwerty
Numeriek toetsenbord
Toetsenbordverlichting helderheidsniveaus 3
Toetsenbordverlichting kleur Wit
Touchpad afzonderlijke muistoetsen

Camera

Webcam
Webcam resolutie 2,1 MPixel
Tweede camera
Flitser
Camera Windows Hello compatible
Webcamschuifje

Sensors

Accelerometer
Vingerafdruklezer
NFC

Overige hardware

Trusted Platform Module (TPM)
Geïntegreerde microfoon
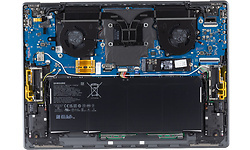
Maten en gewichten

Accu capaciteit (Wh) 76 Wh
Verwisselbare accu
Gewicht totaal 1,65 kg
Afmeting - Breedte 35,1 cm
Afmeting - Diepte 25,2 cm
Afmeting - Hoogte/Dikte 1,26 cm
Passief gekoeld

Software

Besturingssysteem Microsoft Windows 11 Home
Besturingssysteem (serie) Windows
Windows versie 22H2
Windows OS Build 22.621,126
Aantal bits OS 64 bit

Fabrikantsopgave eigenschappen

Garantie 2 jaar

Productcodes

SKU NP960QFG-KA1NL
EAN 8806094881493
Toegevoegd aan Hardware Info donderdag 9 februari 2023

Testresultaten

Dit product is door Hardware Info getest op dinsdag 28 februari 2023.

Geluidstest

Noise floor 14 dB(A)
Testconfiguratie
  • Geluidsdichte ruimte 2021
  • Larson Davis SoundAdvisor Model 831C
Afstand geluidsmeting 50 cm
Testconfiguratie
  • Geluidsdichte ruimte 2021
  • Larson Davis SoundAdvisor Model 831C
WebXPRT 3 - LAeq 13,5 dB
Testconfiguratie
  • Geluidsdichte ruimte 2021
  • Larson Davis SoundAdvisor Model 831C
PCMark 10 Express - LAeq 25,4 dB
Testconfiguratie
  • Geluidsdichte ruimte 2021
  • Larson Davis SoundAdvisor Model 831C
Blender - LAeq 34,3 dB
Testconfiguratie
  • Geluidsdichte ruimte 2021
  • Larson Davis SoundAdvisor Model 831C

PCMark 10 Storage

PCMark 10 - Gebruiken Adobe Photoshop Heavy 759
Testconfiguratie
  • Windows benchmarks
PCMark 10 - Storage - Totaalscore - Toegangstijd 63
Testconfiguratie
  • Windows benchmarks
PCMark 10 - Storage - Totaalscore - Bandbreedte 409,13
PCMark 10 - Storage - Totaalscore 2.609
Testconfiguratie
  • Windows benchmarks
PCMark 10 - 2.37GB_(399_JPEGs)_leestest 643
PCMark 10 - 2.37GB_(399_JPEGs)_kopieertest 973
Testconfiguratie
  • Windows benchmarks
PCMark 10 - 2.37GB_(399_JPEGs)_schrijftest 599
Testconfiguratie
  • Windows benchmarks
PCMark 10 - 2GB_(4_ISOs)_leestest 3.174
Testconfiguratie
  • Windows benchmarks
PCMark 10 - 2GB_(4_ISOs)_kopieertest 3.174
Testconfiguratie
  • Windows benchmarks
PCMark 10 - 2GB_(4_ISOs)_schrijftest 3.252
Testconfiguratie
  • Windows benchmarks
PCMark 10 - Gebruiken Microsoft PowerPoint 150
Testconfiguratie
  • Windows benchmarks
PCMark 10 - Gebruiken Microsoft Excel 148
Testconfiguratie
  • Windows benchmarks
PCMark 10 - Gebruiken Adobe Photoshop Light 234
Testconfiguratie
  • Windows benchmarks
PCMark 10 - Starten Windows 10 330
Testconfiguratie
  • Windows benchmarks
PCMark 10 - Gebruiken Adobe InDesign 184
Testconfiguratie
  • Windows benchmarks
PCMark 10 - Gebruiken Adobe Illustrator 234
PCMark 10 - Gebruiken Adobe After Effects 409
Testconfiguratie
  • Windows benchmarks
PCMark 10 - Starten Overwatch 341
Testconfiguratie
  • Windows benchmarks
PCMark 10 - Starten Call of Duty: Black Ops 4 660
Testconfiguratie
  • Windows benchmarks
PCMark 10 - Starten Battlefield V 701
Testconfiguratie
  • Windows benchmarks
PCMark 10 - Starten Adobe Photoshop 172
Testconfiguratie
  • Windows benchmarks
PCMark 10 - Starten Adobe Lightroom 138
Testconfiguratie
  • Windows benchmarks
PCMark 10 - Starten Adobe Premiere_Pro 199
Testconfiguratie
  • Windows benchmarks
PCMark 10 - Starten Adobe Illustrator 170
Testconfiguratie
  • Windows benchmarks
PCMark 10 - Starten Adobe After Effects 173
Testconfiguratie
  • Windows benchmarks
PCMark 10 - Starten Adobe Acrobat 183
Testconfiguratie
  • Windows benchmarks
PCMark 10 - Quick Storage - Totaalscore 3.143
Testconfiguratie
  • Windows benchmarks
PCMark 10 - Quick Storage - Totaalscore - Bandbreedte 376,9
Testconfiguratie
  • Windows benchmarks
PCMark 10 - Quick Storage - Totaalscore - Toegangstijd 40
Testconfiguratie
  • Windows benchmarks

Platform onafhankelijke tests

Opstarttijd 15,34 sec.
Testconfiguratie
  • Platform onafhankelijke tests
JetStream 2 254,029
Testconfiguratie
  • Platform onafhankelijke tests
webXPRT 3 341
Testconfiguratie
  • Platform onafhankelijke tests
webXPRT 3 - Photo Enhancement 301 ms
Testconfiguratie
  • Platform onafhankelijke tests
webXPRT 3 - Organize Album using AI 2.100 ms
Testconfiguratie
  • Platform onafhankelijke tests
webXPRT 3 - Stock Option Pricing 83 ms
Testconfiguratie
  • Platform onafhankelijke tests
webXPRT 3 - Encrypt Notes and OCR Scan 801 ms
Testconfiguratie
  • Platform onafhankelijke tests
webXPRT 3 - Sales Graphs 242 ms
Testconfiguratie
  • Platform onafhankelijke tests
webXPRT 3 - Online Homework 804 ms
Testconfiguratie
  • Platform onafhankelijke tests
Geekbench 5 - Multi 8.754
Testconfiguratie
  • Platform onafhankelijke tests
Geekbench 5 - Multi Crypto 10.065
Testconfiguratie
  • Platform onafhankelijke tests
Geekbench 5 - Multi Integer 8.232
Testconfiguratie
  • Platform onafhankelijke tests
Geekbench 5 - Multi Floating Point 9.667
Testconfiguratie
  • Platform onafhankelijke tests
Geekbench 5 - Single 1.805
Testconfiguratie
  • Platform onafhankelijke tests
Geekbench 5 - Single Crypto 3.917
Testconfiguratie
  • Platform onafhankelijke tests
Geekbench 5 - Single Integer 1.592
Testconfiguratie
  • Platform onafhankelijke tests
Geekbench 5 - Single Floating Point 1.913
Testconfiguratie
  • Platform onafhankelijke tests
Geekbench 5 - OpenCL 21.257
Testconfiguratie
  • Platform onafhankelijke tests
WiFi speedtest 2.4GHz receive 223 Mbit/s
Testconfiguratie
  • Platform onafhankelijke tests
WiFi speedtest 2.4GHz send 295 Mbit/s
Testconfiguratie
  • Platform onafhankelijke tests
WiFi speedtest 5.0GHz receive 608 Mbit/s
Testconfiguratie
  • Platform onafhankelijke tests
WiFi speedtest 5.0GHz send 666 Mbit/s
Testconfiguratie
  • Platform onafhankelijke tests

Windows benchmarks

3DMark - Fire Strike 5.104
Testconfiguratie
  • Windows benchmarks
3DMark - Fire Strike Graphics 5.295
Testconfiguratie
  • Windows benchmarks
3DMark - Fire Strike Physics 20.226
Testconfiguratie
  • Windows benchmarks
3DMark - Fire Strike Combined 2.135
Testconfiguratie
  • Windows benchmarks
3DMark - Time Spy 1.880
Testconfiguratie
  • Windows benchmarks
3DMark - Time Spy Graphics 1.653
Testconfiguratie
  • Windows benchmarks
3DMark - Time Spy CPU 8.502
Testconfiguratie
  • Windows benchmarks
3DMark - Night Raid 17.966
Testconfiguratie
  • Windows benchmarks
3DMark - Night Raid Graphics 20.676
Testconfiguratie
  • Windows benchmarks
3DMark - Night Raid CPU 10.311
Testconfiguratie
  • Windows benchmarks
Cinebench R15 - Single 254
Testconfiguratie
  • Windows benchmarks
Cinebench R15 - Multi 1.775
Testconfiguratie
  • Windows benchmarks
Cinebench R20 - Single 691
Testconfiguratie
  • Windows benchmarks
Cinebench R20 - Multi 4.240
Testconfiguratie
  • Windows benchmarks
Cinebench R23 - Single 1.799
Testconfiguratie
  • Windows benchmarks
Cinebench R23 - Multi 11.049
Testconfiguratie
  • Windows benchmarks
Blender duurtest run #1 24,6
Testconfiguratie
  • Windows benchmarks
Blender duurtest run #2 25,98
Testconfiguratie
  • Windows benchmarks
Blender duurtest run #3 26
Testconfiguratie
  • Windows benchmarks
Blender duurtest run #4 26
Testconfiguratie
  • Windows benchmarks
Blender duurtest run #5 26,13
Testconfiguratie
  • Windows benchmarks
Blender duurtest run #6 25,93
Testconfiguratie
  • Windows benchmarks
Blender duurtest run #7 25,99
Testconfiguratie
  • Windows benchmarks
Blender duurtest run #8 26,11
Testconfiguratie
  • Windows benchmarks
Blender duurtest run #9 26,29
Testconfiguratie
  • Windows benchmarks
Blender duurtest run #10 26,27
Testconfiguratie
  • Windows benchmarks
Blender duurtest run #11 26,29
Testconfiguratie
  • Windows benchmarks
Blender duurtest run #12 26,41
Testconfiguratie
  • Windows benchmarks
Blender duurtest run #13 26,41
Testconfiguratie
  • Windows benchmarks
Blender duurtest run #14 26,44
Testconfiguratie
  • Windows benchmarks
Blender duurtest run #15 26,48
Testconfiguratie
  • Windows benchmarks
Blender duurtest run #16 26,59
Testconfiguratie
  • Windows benchmarks
Blender duurtest run #17 26,56
Testconfiguratie
  • Windows benchmarks
Blender duurtest run #18 26,66
Testconfiguratie
  • Windows benchmarks
Blender duurtest run #19 26,69
Testconfiguratie
  • Windows benchmarks
Blender duurtest run #20 26,94
Testconfiguratie
  • Windows benchmarks
Blender duurtest run #21 26,67
Testconfiguratie
  • Windows benchmarks
Blender duurtest run #22 26,85
Testconfiguratie
  • Windows benchmarks
Blender duurtest run #23 26,79
Testconfiguratie
  • Windows benchmarks
Blender duurtest run #24 27,09
Testconfiguratie
  • Windows benchmarks
Blender duurtest run #25 27,02
Testconfiguratie
  • Windows benchmarks
Blender duurtest run #26 26,75
Testconfiguratie
  • Windows benchmarks
Blender duurtest run #27 26,81
Testconfiguratie
  • Windows benchmarks
Blender duurtest run #28 26,89
Testconfiguratie
  • Windows benchmarks
Blender duurtest run #29 26,75
Testconfiguratie
  • Windows benchmarks
Blender duurtest run #30 26,85
Testconfiguratie
  • Windows benchmarks
Blender duurtest run #31 27,12
Testconfiguratie
  • Windows benchmarks
Blender duurtest run #32 26,95
Testconfiguratie
  • Windows benchmarks
Blender duurtest run #33 26,95
Testconfiguratie
  • Windows benchmarks
Blender duurtest run #34 27,04
Testconfiguratie
  • Windows benchmarks
Blender duurtest run #35 27,07
Testconfiguratie
  • Windows benchmarks
Blender duurtest run #36 27,15
Testconfiguratie
  • Windows benchmarks
Blender duurtest run #37 27,02
Testconfiguratie
  • Windows benchmarks
Blender duurtest run #38 27,09
Testconfiguratie
  • Windows benchmarks
Blender duurtest run #39 27,02
Testconfiguratie
  • Windows benchmarks
Blender duurtest run #40 27,15
Testconfiguratie
  • Windows benchmarks
Blender duurtest run #41 27,01
Testconfiguratie
  • Windows benchmarks
Blender duurtest run #42 27,01
Testconfiguratie
  • Windows benchmarks
Blender duurtest run #43 27
Testconfiguratie
  • Windows benchmarks
Blender duurtest run #44 27,06
Testconfiguratie
  • Windows benchmarks
PCMark 10 Extended 5.403
Testconfiguratie
  • Windows benchmarks
PCMark 10 Essentials 9.623
Testconfiguratie
  • Windows benchmarks
PCMark 10 App Start-up 10.789
Testconfiguratie
  • Windows benchmarks
PCMark 10 Video Conferencing 8.568
Testconfiguratie
  • Windows benchmarks
PCMark 10 Web Browsing 9.642
Testconfiguratie
  • Windows benchmarks
PCMark 10 Productivity 7.370
Testconfiguratie
  • Windows benchmarks
PCMark 10 Spreadsheets 7.250
Testconfiguratie
  • Windows benchmarks
PCMark 10 Writing 7.494
Testconfiguratie
  • Windows benchmarks
PCMark 10 Digital Content Creation 6.979
Testconfiguratie
  • Windows benchmarks
PCMark 10 Photo Editing 10.835
Testconfiguratie
  • Windows benchmarks
PCMark 10 Rendering and Visualization 4.952
Testconfiguratie
  • Windows benchmarks
PCMark 10 Video Editing 6.337
Testconfiguratie
  • Windows benchmarks
PCMark 10 Gaming 4.655
Testconfiguratie
  • Windows benchmarks
PCMark 10 Graphics 5.931
Testconfiguratie
  • Windows benchmarks
PCMark 10 Physics 20.438
Testconfiguratie
  • Windows benchmarks
PCMark 10 Combined 2.205
Testconfiguratie
  • Windows benchmarks

Energieverbruik / Accu

Energieverbruik uit 0,3 W
Testconfiguratie
  • Windows benchmarks
Energieverbruik adapter (zonder laptop) 0 W
Testconfiguratie
  • Windows benchmarks
Energieverbruik idle 9,4 W
Testconfiguratie
  • Windows benchmarks
Browser accutest - 180 cd/m2 601 min.
Testconfiguratie
  • Windows benchmarks
PCMark 10 Accu Digital 3.646
Testconfiguratie
  • Windows benchmarks
PCMark 10 Accu Essentials 5.251
Testconfiguratie
  • Windows benchmarks
PCMark 10 Accu Productivity 3.552
Testconfiguratie
  • Windows benchmarks
PCMark 10 Accu Duration in Minuten 315
Testconfiguratie
  • Windows benchmarks
PCMark 10 Accu Aantal Runs 12
Testconfiguratie
  • Windows benchmarks

Testresultaten beeldscherm

Gemeten kleurruimte sRGB
Testconfiguratie
  • Beeldscherm test SpectraCal CALman 5.13
Kleurtemperatuur 7.265 K
Testconfiguratie
  • Beeldscherm test SpectraCal CALman 5.13
Helderheid wit 152 cd/m²
Testconfiguratie
  • Beeldscherm test SpectraCal CALman 5.13
Helderheid zwart 0,00 cd/m²
Testconfiguratie
  • Beeldscherm test SpectraCal CALman 5.13
Checkerboard wit 386,218 cd/m²
Testconfiguratie
  • Beeldscherm test SpectraCal CALman 5.13
Checkerboard zwart 0 cd/m²
Testconfiguratie
  • Beeldscherm test SpectraCal CALman 5.13
Gamma 2,26
Testconfiguratie
  • Beeldscherm test SpectraCal CALman 5.13
Gamma (afwijking van 2,2) 0,06
Testconfiguratie
  • Beeldscherm test SpectraCal CALman 5.13
Kleurafwijking 75% wit (Delta E 2000) 6,19 mΔuv
Testconfiguratie
  • Beeldscherm test SpectraCal CALman 5 i.c.m. X
  • Rite i1 Display Pro colorimeter
Kleurafwijking 75% rood (Delta E 2000) 1,05 mΔuv
Testconfiguratie
  • Beeldscherm test SpectraCal CALman 5 i.c.m. X
  • Rite i1 Display Pro colorimeter
Kleurafwijking 75% groen (Delta E 2000) 0,33 mΔuv
Testconfiguratie
  • Beeldscherm test SpectraCal CALman 5 i.c.m. X
  • Rite i1 Display Pro colorimeter
Kleurafwijking 75% blauw (Delta E 2000) 1,25 mΔuv
Testconfiguratie
  • Beeldscherm test SpectraCal CALman 5 i.c.m. X
  • Rite i1 Display Pro colorimeter
Kleurafwijking 75% cyaan (Delta E 2000) 4,38 mΔuv
Testconfiguratie
  • Beeldscherm test SpectraCal CALman 5 i.c.m. X
  • Rite i1 Display Pro colorimeter
Kleurafwijking 75% magenta (Delta E 2000) 2,27 mΔuv
Testconfiguratie
  • Beeldscherm test SpectraCal CALman 5 i.c.m. X
  • Rite i1 Display Pro colorimeter
Kleurafwijking 75% geel (Delta E 2000) 0,16 mΔuv
Testconfiguratie
  • Beeldscherm test SpectraCal CALman 5 i.c.m. X
  • Rite i1 Display Pro colorimeter
Gemiddelde kleurafwijking (Delta E 2000) 2,9 mΔuv
Testconfiguratie
  • Beeldscherm test SpectraCal CALman 5.13
Kleurafwijking 100% wit (Delta E 2000) 7,36 mΔuv
Testconfiguratie
  • Beeldscherm test SpectraCal CALman 5 i.c.m. X
  • Rite i1 Display Pro colorimeter
Gemiddelde kleurafwijking excl. wit (Delta E 2000) 1,6
Testconfiguratie
  • Beeldscherm test SpectraCal CALman 5 i.c.m. X
  • Rite i1 Display Pro colorimeter
Gemiddelde grijsafwijking (Delta E 2000) 5,0 mΔuv
Testconfiguratie
  • Beeldscherm test SpectraCal CALman 5.13
sRGB dekking 100 %
Testconfiguratie
  • Beeldscherm test SpectraCal CALman 5.13
DCI-P3 dekking 75,7 %
Testconfiguratie
  • Beeldscherm test SpectraCal CALman 5.13
Rec 2020 dekking 54,4 %
Testconfiguratie
  • Beeldscherm test SpectraCal CALman 5.13
0