Getest

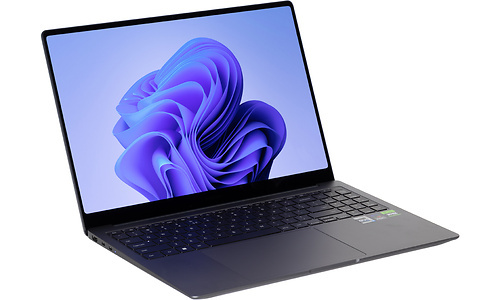
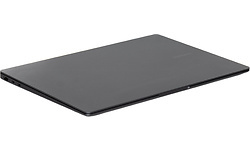
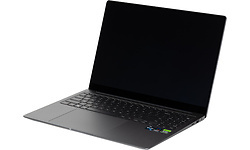
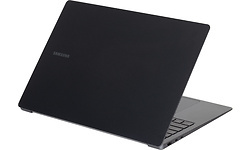
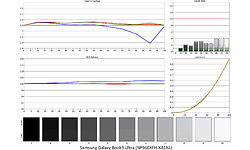
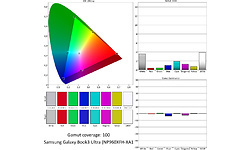
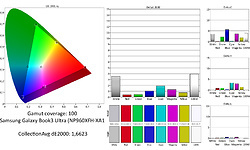
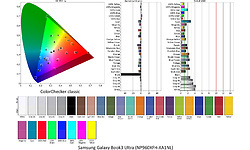
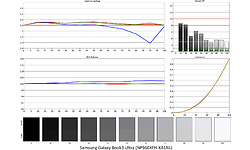
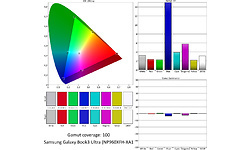
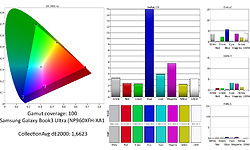
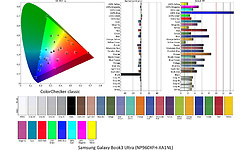
Samsung Galaxy Book3 Ultra (NP960XFH-XA1NL)

Prijsverloop

Specificaties

Belangrijkste specificaties

Processor type Intel Core i7 13700H
Geheugen capaciteit 16 GB
Scherm diagonaal 16 inch
Resolutie 2880x1800
Touchscreen
GPU type Nvidia GeForce RTX 4050
Totale opslagcapaciteit 1.024 GB
Toetsenbordindeling Qwerty
Gewicht totaal 1,81 kg
Besturingssysteem (serie) Windows

Processor / Chipset / Geheugen

Processor serie Intel Core i7
Processor type Intel Core i7 13700H
Processor klokfrequentie 2,4 GHz
Processor klokfrequentie (max. turbo) 5 GHz
Configureerbare TDP-down 35 W
Configureerbare TDP-up 115 W
Aantal processorcores 14
Geheugen capaciteit 16 GB
Type geheugen LPDDR5
Geheugen klokfrequentie 6.000 MHz
Geheugen form factor On-board
SODIMM sloten 0
Vrije SODIMM sloten 0
Werkgeheugen uitbreidbaar tot 16 GB

Scherm

Scherm diagonaal 16 inch
Resolutie 2880x1800
Verhouding 16:10
Pixeldichtheid 212 ppi
Scherm type (mat/glans) Glanzend
Paneeltype Dynamic AMOLED
Touchscreen
Maximale verversingsfrequentie 120 Hz

Graphics

GPU type Nvidia GeForce RTX 4050
Geïntegreerde / losse GPU Losse chip
Videogeheugen 6 GB

Opslag

Totale opslagcapaciteit 1.024 GB
SSD opslagcapaciteit 1.024 GB
Beschikbaar opslaggeheugen 876,8 GB
Aantal harddisks / SSD's 1
Harddisk/SSD 1 capaciteit 876,8 GB
Harddisk/SSD 1 soort SSD/Flash
Harddisk/SSD 1 form factor M.2
Harddisk/SSD 1 merk/product Samsung MZVL21T0HCLR-00B
DVD branden
Blu-ray lezen
Blu-ray branden

Connectiviteit / Netwerk

Netwerkaansluiting (bedraad)
WiFi standaard 802.11ax (Wi-Fi 6E)
WiFi adapter Intel(R) Wi-Fi 6E AX211 160Mhz
Bluetooth
Bluetooth-versie Bluetooth 5.3
4G (LTE)
5G

Aansluitingen

Smartcard
USB 3.2 - 10 Gb/s (Type-A) 1
Thunderbolt 4 (Type-C) 2
Cardreader - SD
Cardreader - MicroSD
DVI-uitgang
VGA-uitgang
HDMI-uitgang
Aantal HDMI-uitgangen 1
Micro HDMI-uitgang
HDMI-versie 2.0
DisplayPort-uitgang
Mini DisplayPort-uitgang
Analoge audio aansluitingen 1
Aansluiting dockingstation
Kensingtonslot

Toetsenbord en touchpad

Toetsenbordindeling Qwerty
Numeriek toetsenbord
Toetsenbordverlichting helderheidsniveaus 3
Toetsenbordverlichting kleur Wit
Touchpad afzonderlijke muistoetsen

Camera

Webcam
Webcam resolutie 2,1 MPixel
Tweede camera
Flitser
Camera Windows Hello compatible
Webcamschuifje

Sensors

Accelerometer
Vingerafdruklezer
NFC

Overige hardware

Trusted Platform Module (TPM)
Geïntegreerde microfoon
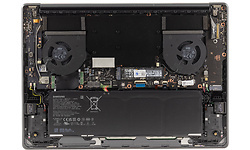
Maten en gewichten

Accu capaciteit (Wh) 74,5 Wh
Verwisselbare accu
Gewicht totaal 1,81 kg
Afmeting - Breedte 35,6 cm
Afmeting - Diepte 25 cm
Afmeting - Hoogte/Dikte 1,66 cm
Passief gekoeld

Software

Besturingssysteem Microsoft Windows 11 Home
Besturingssysteem (serie) Windows
Windows versie 22H2
Windows OS Build 22.621,155
Aantal bits OS 64 bit

Fabrikantsopgave eigenschappen

Garantie 2 jaar

Productcodes

SKU NP960XFH-XA1NL
EAN 8806094881509
Toegevoegd aan Hardware Info woensdag 15 februari 2023

Testresultaten

Dit product is door Hardware Info getest op dinsdag 2 mei 2023.

Metro Exodus

Metro Exodus - 1920x1080 - Medium 88 fps
Testconfiguratie
  • Game benchmarks 2022
Metro Exodus - 1920x1080 - Medium (99p) 23,06 ms
Testconfiguratie
  • Game benchmarks 2022
Metro Exodus - 1920x1080 - Medium (99.9p) 26,95 ms
Testconfiguratie
  • Game benchmarks 2022
Metro Exodus - 1920x1080 - Ultra 55,9 fps
Testconfiguratie
  • Game benchmarks 2022
Metro Exodus - 1920x1080 - Ultra (99p) 33,44 ms
Testconfiguratie
  • Game benchmarks 2022
Metro Exodus - 1920x1080 - Ultra (99.9p) 37,89 ms
Testconfiguratie
  • Game benchmarks 2022
Metro Exodus - 2560x1440 - Medium 65,8 fps
Testconfiguratie
  • Game benchmarks 2022
Metro Exodus - 2560x1440 - Medium (99p) 27,19 ms
Testconfiguratie
  • Game benchmarks 2022
Metro Exodus - 2560x1440 - Medium (99.9p) 31,63 ms
Testconfiguratie
  • Game benchmarks 2022
Metro Exodus - 2560x1440 - Ultra 42,9 fps
Testconfiguratie
  • Game benchmarks 2022
Metro Exodus - 2560x1440 - Ultra (99p) 39,62 ms
Testconfiguratie
  • Game benchmarks 2022
Metro Exodus - 2560x1440 - Ultra (99.9p) 45,86 ms
Testconfiguratie
  • Game benchmarks 2022
Metro Exodus - 3840x2160 - Medium 36,1 fps
Testconfiguratie
  • Game benchmarks 2022
Metro Exodus - 3840x2160 - Medium (99p) 44,69 ms
Testconfiguratie
  • Game benchmarks 2022
Metro Exodus - 3840x2160 - Medium (99.9p) 48,46 ms
Testconfiguratie
  • Game benchmarks 2022
Metro Exodus - 3840x2160 - Ultra 24,6 fps
Testconfiguratie
  • Game benchmarks 2022
Metro Exodus - 3840x2160 - Ultra (99p) 59,55 ms
Testconfiguratie
  • Game benchmarks 2022
Metro Exodus - 3840x2160 - Ultra (99.9p) 64,47 ms
Testconfiguratie
  • Game benchmarks 2022
Metro Exodus - 1920x1080 - Ultra (DXR - High) 46 fps
Testconfiguratie
  • Game benchmarks 2022
Metro Exodus - 1920x1080 - Ultra (DXR - High) (99p) 37,8 ms
Testconfiguratie
  • Game benchmarks 2022
Metro Exodus - 1920x1080 - Ultra (DXR - High) (99.9p) 63,06 ms
Testconfiguratie
  • Game benchmarks 2022
Metro Exodus - 2560x1440 - Ultra (DXR - High) 28,7 fps
Testconfiguratie
  • Game benchmarks 2022
Metro Exodus - 2560x1440 - Ultra (DXR - High) (99p) 50,46 ms
Testconfiguratie
  • Game benchmarks 2022
Metro Exodus - 2560x1440 - Ultra (DXR - High) (99.9p) 68,31 ms
Testconfiguratie
  • Game benchmarks 2022

Total War: Troy

Total War: Troy - 1920x1080 - Medium 154,3 fps
Testconfiguratie
  • Game benchmarks 2022
Total War: Troy - 1920x1080 - Medium (99p) 7,72 ms
Testconfiguratie
  • Game benchmarks 2022
Total War: Troy - 1920x1080 - Medium (99.9p) 8,56 ms
Testconfiguratie
  • Game benchmarks 2022
Total War: Troy - 1920x1080 - Ultra 75,2 fps
Testconfiguratie
  • Game benchmarks 2022
Total War: Troy - 1920x1080 - Ultra (99p) 16,18 ms
Testconfiguratie
  • Game benchmarks 2022
Total War: Troy - 1920x1080 - Ultra (99.9p) 17,54 ms
Testconfiguratie
  • Game benchmarks 2022
Total War: Troy - 2560x1440 - Medium 103,4 fps
Testconfiguratie
  • Game benchmarks 2022
Total War: Troy - 2560x1440 - Medium (99p) 11,24 ms
Testconfiguratie
  • Game benchmarks 2022
Total War: Troy - 2560x1440 - Medium (99.9p) 11,74 ms
Testconfiguratie
  • Game benchmarks 2022
Total War: Troy - 2560x1440 - Ultra 54,5 fps
Testconfiguratie
  • Game benchmarks 2022
Total War: Troy - 2560x1440 - Ultra (99p) 21,58 ms
Testconfiguratie
  • Game benchmarks 2022
Total War: Troy - 2560x1440 - Ultra (99.9p) 22,96 ms
Testconfiguratie
  • Game benchmarks 2022
Total War: Troy - 3840x2160 - Medium 53,4 fps
Testconfiguratie
  • Game benchmarks 2022
Total War: Troy - 3840x2160 - Medium (99p) 21,23 ms
Testconfiguratie
  • Game benchmarks 2022
Total War: Troy - 3840x2160 - Medium (99.9p) 21,83 ms
Testconfiguratie
  • Game benchmarks 2022
Total War: Troy - 3840x2160 - Ultra 29,9 fps
Testconfiguratie
  • Game benchmarks 2022
Total War: Troy - 3840x2160 - Ultra (99p) 39,41 ms
Testconfiguratie
  • Game benchmarks 2022
Total War: Troy - 3840x2160 - Ultra (99.9p) 40,89 ms
Testconfiguratie
  • Game benchmarks 2022

Far Cry: New Dawn

Far Cry: New Dawn - 1920x1080 - Medium 105,4 fps
Testconfiguratie
  • Game benchmarks 2022
Far Cry: New Dawn - 1920x1080 - Medium (99p) 14,56 ms
Testconfiguratie
  • Game benchmarks 2022
Far Cry: New Dawn - 1920x1080 - Medium (99.9p) 31,61 ms
Testconfiguratie
  • Game benchmarks 2022
Far Cry: New Dawn - 1920x1080 - Ultra 85,4 fps
Testconfiguratie
  • Game benchmarks 2022
Far Cry: New Dawn - 1920x1080 - Ultra (99p) 15,4 ms
Testconfiguratie
  • Game benchmarks 2022
Far Cry: New Dawn - 1920x1080 - Ultra (99.9p) 18,57 ms
Testconfiguratie
  • Game benchmarks 2022
Far Cry: New Dawn - 2560x1440 - Medium 84 fps
Testconfiguratie
  • Game benchmarks 2022
Far Cry: New Dawn - 2560x1440 - Medium (99p) 16,38 ms
Testconfiguratie
  • Game benchmarks 2022
Far Cry: New Dawn - 2560x1440 - Medium (99.9p) 34,95 ms
Testconfiguratie
  • Game benchmarks 2022
Far Cry: New Dawn - 2560x1440 - Ultra 71,8 fps
Testconfiguratie
  • Game benchmarks 2022
Far Cry: New Dawn - 2560x1440 - Ultra (99p) 18,68 ms
Testconfiguratie
  • Game benchmarks 2022
Far Cry: New Dawn - 2560x1440 - Ultra (99.9p) 29,9 ms
Testconfiguratie
  • Game benchmarks 2022
Far Cry: New Dawn - 3840x2160 - Medium 45 fps
Testconfiguratie
  • Game benchmarks 2022
Far Cry: New Dawn - 3840x2160 - Medium (99p) 28,82 ms
Testconfiguratie
  • Game benchmarks 2022
Far Cry: New Dawn - 3840x2160 - Medium (99.9p) 37,44 ms
Testconfiguratie
  • Game benchmarks 2022
Far Cry: New Dawn - 3840x2160 - Ultra 38,3 fps
Testconfiguratie
  • Game benchmarks 2022
Far Cry: New Dawn - 3840x2160 - Ultra (99p) 33,94 ms
Testconfiguratie
  • Game benchmarks 2022
Far Cry: New Dawn - 3840x2160 - Ultra (99.9p) 37,61 ms
Testconfiguratie
  • Game benchmarks 2022

F1 2020

F1 2020 (DX12) - 1920x1080 - Medium 168,6 fps
Testconfiguratie
  • Game benchmarks 2022
F1 2020 (DX12) - 1920x1080 - Medium (99p) 8,6 ms
Testconfiguratie
  • Game benchmarks 2022
F1 2020 (DX12) - 1920x1080 - Medium (99.9p) 18,2 ms
Testconfiguratie
  • Game benchmarks 2022
F1 2020 (DX12) - 1920x1080 - Ultra 124,9 fps
Testconfiguratie
  • Game benchmarks 2022
F1 2020 (DX12) - 1920x1080 - Ultra (99p) 11,7 ms
Testconfiguratie
  • Game benchmarks 2022
F1 2020 (DX12) - 1920x1080 - Ultra (99.9p) 22,3 ms
Testconfiguratie
  • Game benchmarks 2022
F1 2020 (DX12) - 2560x1440 - Medium 135,7 fps
Testconfiguratie
  • Game benchmarks 2022
F1 2020 (DX12) - 2560x1440 - Medium (99p) 10,9 ms
Testconfiguratie
  • Game benchmarks 2022
F1 2020 (DX12) - 2560x1440 - Medium (99.9p) 20,6 ms
Testconfiguratie
  • Game benchmarks 2022
F1 2020 (DX12) - 2560x1440 - Ultra 93,1 fps
Testconfiguratie
  • Game benchmarks 2022
F1 2020 (DX12) - 2560x1440 - Ultra (99p) 16,3 ms
Testconfiguratie
  • Game benchmarks 2022
F1 2020 (DX12) - 2560x1440 - Ultra (99.9p) 23,4 ms
Testconfiguratie
  • Game benchmarks 2022
F1 2020 (DX12) - 3840x2160 - Medium 80,3 fps
Testconfiguratie
  • Game benchmarks 2022
F1 2020 (DX12) - 3840x2160 - Medium (99p) 16,3 ms
Testconfiguratie
  • Game benchmarks 2022
F1 2020 (DX12) - 3840x2160 - Medium (99.9p) 20,9 ms
Testconfiguratie
  • Game benchmarks 2022
F1 2020 (DX12) - 3840x2160 - Ultra 52,3 fps
Testconfiguratie
  • Game benchmarks 2022
F1 2020 (DX12) - 3840x2160 - Ultra (99p) 25 ms
Testconfiguratie
  • Game benchmarks 2022
F1 2020 (DX12) - 3840x2160 - Ultra (99.9p) 29,5 ms
Testconfiguratie
  • Game benchmarks 2022

Geluidstest

Noise floor 14 dB(A)
Testconfiguratie
  • Geluidsdichte ruimte 2021
  • Larson Davis SoundAdvisor Model 831C
Afstand geluidsmeting 50 cm
Testconfiguratie
  • Geluidsdichte ruimte 2021
  • Larson Davis SoundAdvisor Model 831C
WebXPRT 3 - LAeq 14,6 dB
Testconfiguratie
  • Geluidsdichte ruimte 2021
  • Larson Davis SoundAdvisor Model 831C
PCMark 10 Express - LAeq 26,1 dB
Testconfiguratie
  • Geluidsdichte ruimte 2021
  • Larson Davis SoundAdvisor Model 831C
Blender - LAeq 40,8 dB
Testconfiguratie
  • Geluidsdichte ruimte 2021
  • Larson Davis SoundAdvisor Model 831C
F1 2020 - LAeq 40,4 dB
Testconfiguratie
  • Geluidsdichte ruimte 2021
  • Larson Davis SoundAdvisor Model 831C

PCMark 10 Storage

PCMark 10 - Gebruiken Adobe Photoshop Heavy 680
Testconfiguratie
  • Windows benchmarks
PCMark 10 - Storage - Totaalscore - Toegangstijd 74
Testconfiguratie
  • Windows benchmarks
PCMark 10 - Storage - Totaalscore - Bandbreedte 352,24
PCMark 10 - Storage - Totaalscore 2.234
Testconfiguratie
  • Windows benchmarks
PCMark 10 - 2.37GB_(399_JPEGs)_leestest 482
PCMark 10 - 2.37GB_(399_JPEGs)_kopieertest 722
Testconfiguratie
  • Windows benchmarks
PCMark 10 - 2.37GB_(399_JPEGs)_schrijftest 486
Testconfiguratie
  • Windows benchmarks
PCMark 10 - 2GB_(4_ISOs)_leestest 3.610
Testconfiguratie
  • Windows benchmarks
PCMark 10 - 2GB_(4_ISOs)_kopieertest 3.236
Testconfiguratie
  • Windows benchmarks
PCMark 10 - 2GB_(4_ISOs)_schrijftest 2.824
Testconfiguratie
  • Windows benchmarks
PCMark 10 - Gebruiken Microsoft PowerPoint 115
Testconfiguratie
  • Windows benchmarks
PCMark 10 - Gebruiken Microsoft Excel 122
Testconfiguratie
  • Windows benchmarks
PCMark 10 - Gebruiken Adobe Photoshop Light 190
Testconfiguratie
  • Windows benchmarks
PCMark 10 - Starten Windows 10 306
Testconfiguratie
  • Windows benchmarks
PCMark 10 - Gebruiken Adobe InDesign 161
Testconfiguratie
  • Windows benchmarks
PCMark 10 - Gebruiken Adobe Illustrator 174
PCMark 10 - Gebruiken Adobe After Effects 374
Testconfiguratie
  • Windows benchmarks
PCMark 10 - Starten Overwatch 253
Testconfiguratie
  • Windows benchmarks
PCMark 10 - Starten Call of Duty: Black Ops 4 700
Testconfiguratie
  • Windows benchmarks
PCMark 10 - Starten Battlefield V 620
Testconfiguratie
  • Windows benchmarks
PCMark 10 - Starten Adobe Photoshop 147
Testconfiguratie
  • Windows benchmarks
PCMark 10 - Starten Adobe Lightroom 113
Testconfiguratie
  • Windows benchmarks
PCMark 10 - Starten Adobe Premiere_Pro 187
Testconfiguratie
  • Windows benchmarks
PCMark 10 - Starten Adobe Illustrator 117
Testconfiguratie
  • Windows benchmarks
PCMark 10 - Starten Adobe After Effects 160
Testconfiguratie
  • Windows benchmarks
PCMark 10 - Starten Adobe Acrobat 173
Testconfiguratie
  • Windows benchmarks
PCMark 10 - Quick Storage - Totaalscore 2.441
Testconfiguratie
  • Windows benchmarks
PCMark 10 - Quick Storage - Totaalscore - Bandbreedte 295,58
Testconfiguratie
  • Windows benchmarks
PCMark 10 - Quick Storage - Totaalscore - Toegangstijd 52
Testconfiguratie
  • Windows benchmarks

Platform onafhankelijke tests

Opstarttijd 16,33 sec.
Testconfiguratie
  • Platform onafhankelijke tests
JetStream 2 284,232
Testconfiguratie
  • Platform onafhankelijke tests
webXPRT 3 430
Testconfiguratie
  • Platform onafhankelijke tests
webXPRT 3 - Photo Enhancement 212 ms
Testconfiguratie
  • Platform onafhankelijke tests
webXPRT 3 - Organize Album using AI 1.630 ms
Testconfiguratie
  • Platform onafhankelijke tests
webXPRT 3 - Stock Option Pricing 66 ms
Testconfiguratie
  • Platform onafhankelijke tests
webXPRT 3 - Encrypt Notes and OCR Scan 780 ms
Testconfiguratie
  • Platform onafhankelijke tests
webXPRT 3 - Sales Graphs 202 ms
Testconfiguratie
  • Platform onafhankelijke tests
webXPRT 3 - Online Homework 568 ms
Testconfiguratie
  • Platform onafhankelijke tests
Geekbench 5 - Multi 12.682
Testconfiguratie
  • Platform onafhankelijke tests
Geekbench 5 - Multi Crypto 11.735
Testconfiguratie
  • Platform onafhankelijke tests
Geekbench 5 - Multi Integer 12.228
Testconfiguratie
  • Platform onafhankelijke tests
Geekbench 5 - Multi Floating Point 13.825
Testconfiguratie
  • Platform onafhankelijke tests
Geekbench 5 - Single 1.863
Testconfiguratie
  • Platform onafhankelijke tests
Geekbench 5 - Single Crypto 4.666
Testconfiguratie
  • Platform onafhankelijke tests
Geekbench 5 - Single Integer 1.630
Testconfiguratie
  • Platform onafhankelijke tests
Geekbench 5 - Single Floating Point 1.901
Testconfiguratie
  • Platform onafhankelijke tests
Geekbench 5 - OpenCL 83.625
Testconfiguratie
  • Platform onafhankelijke tests
WiFi speedtest 2.4GHz receive 228 Mbit/s
Testconfiguratie
  • Platform onafhankelijke tests
WiFi speedtest 2.4GHz send 117 Mbit/s
Testconfiguratie
  • Platform onafhankelijke tests
WiFi speedtest 5.0GHz receive 638 Mbit/s
Testconfiguratie
  • Platform onafhankelijke tests
WiFi speedtest 5.0GHz send 671 Mbit/s
Testconfiguratie
  • Platform onafhankelijke tests
Geekbench 6 - Multi 12.398
Testconfiguratie
  • Platform onafhankelijke tests
Geekbench 6 - Multi Integer 11.744
Testconfiguratie
  • Platform onafhankelijke tests
Geekbench 6 - Multi Floating Point 13.710
Testconfiguratie
  • Platform onafhankelijke tests
Geekbench 6 - Single 2.367
Testconfiguratie
  • Platform onafhankelijke tests
Geekbench 6 - Single Integer 2.353
Testconfiguratie
  • Platform onafhankelijke tests
Geekbench 6 - Single Floating Point 2.392
Testconfiguratie
  • Platform onafhankelijke tests
Geekbench 6 - OpenCL 73.275
Testconfiguratie
  • Platform onafhankelijke tests

Windows benchmarks

3DMark - Fire Strike 17.577
Testconfiguratie
  • Windows benchmarks
3DMark - Fire Strike Graphics 19.592
Testconfiguratie
  • Windows benchmarks
3DMark - Fire Strike Physics 26.210
Testconfiguratie
  • Windows benchmarks
3DMark - Fire Strike Combined 7.760
Testconfiguratie
  • Windows benchmarks
3DMark - Fire Strike Extreme 8.377
Testconfiguratie
  • Windows benchmarks
3DMark - Time Spy 7.554
Testconfiguratie
  • Windows benchmarks
3DMark - Time Spy Graphics 7.129
Testconfiguratie
  • Windows benchmarks
3DMark - Time Spy CPU 11.408
Testconfiguratie
  • Windows benchmarks
3DMark - Night Raid 31.718
Testconfiguratie
  • Windows benchmarks
3DMark - Night Raid Graphics 45.309
Testconfiguratie
  • Windows benchmarks
3DMark - Night Raid CPU 11.749
Testconfiguratie
  • Windows benchmarks
Cinebench R15 - Single 268
Testconfiguratie
  • Windows benchmarks
Cinebench R15 - Multi 2.500
Testconfiguratie
  • Windows benchmarks
Cinebench R20 - Single 725
Testconfiguratie
  • Windows benchmarks
Cinebench R20 - Multi 6.056
Testconfiguratie
  • Windows benchmarks
Cinebench R23 - Single 1.890
Testconfiguratie
  • Windows benchmarks
Cinebench R23 - Multi 16.150
Testconfiguratie
  • Windows benchmarks
Blender duurtest run #1 17,5
Testconfiguratie
  • Windows benchmarks
Blender duurtest run #2 18,08
Testconfiguratie
  • Windows benchmarks
Blender duurtest run #3 18,27
Testconfiguratie
  • Windows benchmarks
Blender duurtest run #4 18,22
Testconfiguratie
  • Windows benchmarks
Blender duurtest run #5 18,36
Testconfiguratie
  • Windows benchmarks
Blender duurtest run #6 18,29
Testconfiguratie
  • Windows benchmarks
Blender duurtest run #7 18,36
Testconfiguratie
  • Windows benchmarks
Blender duurtest run #8 18,33
Testconfiguratie
  • Windows benchmarks
Blender duurtest run #9 19,57
Testconfiguratie
  • Windows benchmarks
Blender duurtest run #10 19,6
Testconfiguratie
  • Windows benchmarks
Blender duurtest run #11 19,62
Testconfiguratie
  • Windows benchmarks
Blender duurtest run #12 19,41
Testconfiguratie
  • Windows benchmarks
Blender duurtest run #13 19,34
Testconfiguratie
  • Windows benchmarks
Blender duurtest run #14 19,29
Testconfiguratie
  • Windows benchmarks
Blender duurtest run #15 19,26
Testconfiguratie
  • Windows benchmarks
Blender duurtest run #16 19,21
Testconfiguratie
  • Windows benchmarks
Blender duurtest run #17 19,1
Testconfiguratie
  • Windows benchmarks
Blender duurtest run #18 18,86
Testconfiguratie
  • Windows benchmarks
Blender duurtest run #19 19,01
Testconfiguratie
  • Windows benchmarks
Blender duurtest run #20 18,93
Testconfiguratie
  • Windows benchmarks
Blender duurtest run #21 18,88
Testconfiguratie
  • Windows benchmarks
Blender duurtest run #22 18,87
Testconfiguratie
  • Windows benchmarks
Blender duurtest run #23 18,66
Testconfiguratie
  • Windows benchmarks
Blender duurtest run #24 18,69
Testconfiguratie
  • Windows benchmarks
Blender duurtest run #25 18,77
Testconfiguratie
  • Windows benchmarks
Blender duurtest run #26 18,85
Testconfiguratie
  • Windows benchmarks
Blender duurtest run #27 18,85
Testconfiguratie
  • Windows benchmarks
Blender duurtest run #28 18,91
Testconfiguratie
  • Windows benchmarks
Blender duurtest run #29 18,93
Testconfiguratie
  • Windows benchmarks
Blender duurtest run #30 19,01
Testconfiguratie
  • Windows benchmarks
Blender duurtest run #31 18,91
Testconfiguratie
  • Windows benchmarks
Blender duurtest run #32 18,92
Testconfiguratie
  • Windows benchmarks
Blender duurtest run #33 18,97
Testconfiguratie
  • Windows benchmarks
Blender duurtest run #34 19
Testconfiguratie
  • Windows benchmarks
Blender duurtest run #35 18,99
Testconfiguratie
  • Windows benchmarks
Blender duurtest run #36 19,07
Testconfiguratie
  • Windows benchmarks
Blender duurtest run #37 18,95
Testconfiguratie
  • Windows benchmarks
Blender duurtest run #38 18,87
Testconfiguratie
  • Windows benchmarks
Blender duurtest run #39 18,84
Testconfiguratie
  • Windows benchmarks
Blender duurtest run #40 18,88
Testconfiguratie
  • Windows benchmarks
Blender duurtest run #41 18,88
Testconfiguratie
  • Windows benchmarks
Blender duurtest run #42 18,94
Testconfiguratie
  • Windows benchmarks
Blender duurtest run #43 18,98
Testconfiguratie
  • Windows benchmarks
Blender duurtest run #44 19,12
Testconfiguratie
  • Windows benchmarks
Blender duurtest run #45 19,13
Testconfiguratie
  • Windows benchmarks
Blender duurtest run #46 19,01
Testconfiguratie
  • Windows benchmarks
Blender duurtest run #47 18,81
Testconfiguratie
  • Windows benchmarks
Blender duurtest run #48 18,8
Testconfiguratie
  • Windows benchmarks
Blender duurtest run #49 18,94
Testconfiguratie
  • Windows benchmarks
Blender duurtest run #50 18,96
Testconfiguratie
  • Windows benchmarks
PCMark 10 Extended 8.971
Testconfiguratie
  • Windows benchmarks
PCMark 10 Essentials 11.244
Testconfiguratie
  • Windows benchmarks
PCMark 10 App Start-up 15.910
Testconfiguratie
  • Windows benchmarks
PCMark 10 Video Conferencing 8.790
Testconfiguratie
  • Windows benchmarks
PCMark 10 Web Browsing 10.167
Testconfiguratie
  • Windows benchmarks
PCMark 10 Productivity 10.619
Testconfiguratie
  • Windows benchmarks
PCMark 10 Spreadsheets 13.927
Testconfiguratie
  • Windows benchmarks
PCMark 10 Writing 8.098
Testconfiguratie
  • Windows benchmarks
PCMark 10 Digital Content Creation 10.076
Testconfiguratie
  • Windows benchmarks
PCMark 10 Photo Editing 11.587
Testconfiguratie
  • Windows benchmarks
PCMark 10 Rendering and Visualization 12.603
Testconfiguratie
  • Windows benchmarks
PCMark 10 Video Editing 7.007
Testconfiguratie
  • Windows benchmarks
PCMark 10 Gaming 14.549
Testconfiguratie
  • Windows benchmarks
PCMark 10 Graphics 19.517
Testconfiguratie
  • Windows benchmarks
PCMark 10 Physics 24.759
Testconfiguratie
  • Windows benchmarks
PCMark 10 Combined 7.792
Testconfiguratie
  • Windows benchmarks

Energieverbruik / Accu

Energieverbruik uit 0,3 W
Testconfiguratie
  • Windows benchmarks
Energieverbruik adapter (zonder laptop) 0 W
Testconfiguratie
  • Windows benchmarks
Energieverbruik idle 15,6 W
Testconfiguratie
  • Windows benchmarks
Browser accutest - 180 cd/m2 601 min.
Testconfiguratie
  • Windows benchmarks
PCMark 10 Accu Digital 4.314
Testconfiguratie
  • Windows benchmarks
PCMark 10 Accu Essentials 5.349
Testconfiguratie
  • Windows benchmarks
PCMark 10 Accu Productivity 4.493
Testconfiguratie
  • Windows benchmarks
PCMark 10 Accu Duration in Minuten 179
Testconfiguratie
  • Windows benchmarks
PCMark 10 Accu Aantal Runs 9
Testconfiguratie
  • Windows benchmarks

Testresultaten beeldscherm

Gemeten kleurruimte DCI-P3
Testconfiguratie
  • Beeldscherm test SpectraCal CALman 5.13
Kleurtemperatuur 6.817 K
Testconfiguratie
  • Beeldscherm test SpectraCal CALman 5.13
Afwijking kleurtemperatuur wit van 6504K 313 K
Testconfiguratie
  • Beeldscherm test SpectraCal CALman 5.13
Gemiddelde kleurtemperatuur 6.768 K
Testconfiguratie
  • Beeldscherm test SpectraCal CALman 5.13
Afwijking gemiddelde kleurtemperatuur van 6504K 264 K
Testconfiguratie
  • Beeldscherm test SpectraCal CALman 5.13
Helderheid wit 151 cd/m²
Testconfiguratie
  • Beeldscherm test SpectraCal CALman 5.13
Helderheid zwart 0,00 cd/m²
Testconfiguratie
  • Beeldscherm test SpectraCal CALman 5.13
Contrast 0,0 : 1
Testconfiguratie
  • Beeldscherm test SpectraCal CALman 5.13
Checkerboard wit 397,56 cd/m²
Testconfiguratie
  • Beeldscherm test SpectraCal CALman 5.13
Checkerboard zwart 0 cd/m²
Testconfiguratie
  • Beeldscherm test SpectraCal CALman 5.13
Gamma 2,25
Testconfiguratie
  • Beeldscherm test SpectraCal CALman 5.13
Gamma (afwijking van 2,2) 0,05
Testconfiguratie
  • Beeldscherm test SpectraCal CALman 5.13
Gemiddelde kleurafwijking (Delta E 2000) 1,7 mΔuv
Testconfiguratie
  • Beeldscherm test SpectraCal CALman 5.13
Gemiddelde kleurafwijking ΔE ITP 4,91 Δuv
Testconfiguratie
  • Beeldscherm test SpectraCal CALman 5.13
Gemiddelde gedetailleerde kleur-afwijking ΔE 2000 4,87 Δuv
Testconfiguratie
  • Beeldscherm test SpectraCal CALman 5.13
Gemiddelde gedetailleerde kleur-afwijking ΔE ITP 1,86 Δuv
Testconfiguratie
  • Beeldscherm test SpectraCal CALman 5.13
Gemiddelde grijsafwijking ΔE ITP 4,96 Δuv
Testconfiguratie
  • Beeldscherm test SpectraCal CALman 5.13
Reactietijd 0%-100% 8,8 ms
Testconfiguratie
  • Beeldscherm test SpectraCal CALman 5.13
Reactietijd 100%-0% 256 ms
Testconfiguratie
  • Beeldscherm test SpectraCal CALman 5.13
Reactietijd 20%-80% 8,83 ms
Testconfiguratie
  • Beeldscherm test SpectraCal CALman 5.13
Reactietijd 80%-20% 317,6 ms
Testconfiguratie
  • Beeldscherm test SpectraCal CALman 5.13
sRGB dekking 139,2 %
Testconfiguratie
  • Beeldscherm test SpectraCal CALman 5.13
DCI-P3 dekking 100 %
Testconfiguratie
  • Beeldscherm test SpectraCal CALman 5.13
Rec 2020 dekking 73,6 %
Testconfiguratie
  • Beeldscherm test SpectraCal CALman 5.13
0