Prijsverloop

Dit product is niet (meer) verkrijgbaar bij de bij Hardware Info aangesloten shops.

Specificaties

Belangrijkste specificaties

CPU-socket Socket AM4
Klokfrequentie 3,9 GHz
Aantal cores totaal 8 cores
Thermal design power 105 W
Geïntegreerde GPU

Processor

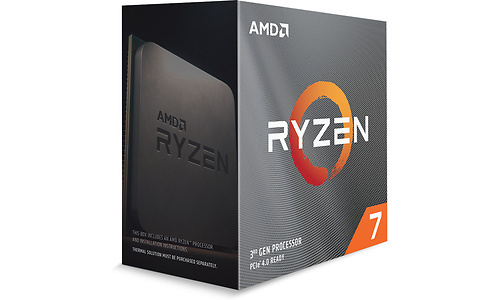
Processorserie Ryzen 7
CPU-core Matisse
CPU-socket Socket AM4
Klokfrequentie 3,9 GHz
Max. turbo klokfrequentie 4,7 GHz
Aantal cores totaal 8 cores
Aantal threads 16
HyperThreading / SMT
Multiplier 39 x
Multiplier unlocked
Bussnelheid / bClk 100 MHz
Thermal design power 105 W
Productie-procedé 7 nm
Aantal PCIe lanes 24
Uitvoering Boxed
Koeler meegeleverd

Geheugencontroller

Geïntegreerde geheugencontroller
Geheugentype DDR4
Geheugensnelheid 3.200 MHz
Geheugenkanalen 2

Video

Geïntegreerde GPU

Cache

L2-cache 4.096 kB
L3-cache 32 MB

Instructieset

IA-64
MMX
SSE
SSE2
SSE3
SSE4A
SSE4.1
SSE4.2
x86-64
XD-bit
AVX
AVX2
AVX-512
AES-NI

Productcodes

SKU 100-100000279WOF
EAN 0730143312264
Toegevoegd aan Hardware Info dinsdag 16 juni 2020

Testresultaten

Dit product is door Hardware Info getest op dinsdag 10 november 2020.

Stroomverbruik processors met TinkerForge

Stroomverbruik idle - ATX 12V 9,381 W
Testconfiguratie
  • Stroomverbruik processors TinkerForge (2021)
Stroomverbruik idle - EPS 12V2 2,661 W
Testconfiguratie
  • Stroomverbruik processors TinkerForge (2021)
Stroomverbruik idle - EPS 12V1 2,949 W
Testconfiguratie
  • Stroomverbruik processors TinkerForge (2021)
Stroomverbruik idle - CPU - Mediaan 5 min. 5,61 W
Testconfiguratie
  • Stroomverbruik processors TinkerForge (2021)
Stroomverbruik idle - CPU + moederbord - Mediaan 5 min. 14,991 W
Testconfiguratie
  • Stroomverbruik processors TinkerForge (2021)
Stroomverbruik Cinebench R20 - ATX 12V 13,872 W
Testconfiguratie
  • Stroomverbruik processors TinkerForge (2020)
Stroomverbruik Cinebench R20 - ATX 12V - Max 23,268 W
Testconfiguratie
  • Stroomverbruik processors TinkerForge (2020)
Stroomverbruik Cinebench R20 - EPS 12V1 60,681 W
Testconfiguratie
  • Stroomverbruik processors TinkerForge (2020)
Stroomverbruik Cinebench R20 - EPS 12V1 - Max 64,675 W
Testconfiguratie
  • Stroomverbruik processors TinkerForge (2020)
Stroomverbruik Cinebench R20 - EPS 12V2 54,908 W
Testconfiguratie
  • Stroomverbruik processors TinkerForge (2020)
Stroomverbruik Cinebench R20 - EPS 12V2 - Max 59,478 W
Testconfiguratie
  • Stroomverbruik processors TinkerForge (2020)
Stroomverbruik Cinebench R20 - CPU - Mediaan 115,589 W
Testconfiguratie
  • Stroomverbruik processors TinkerForge (2020)
Stroomverbruik Cinebench R20 - CPU + moederbord - Mediaan 129,461 W
Testconfiguratie
  • Stroomverbruik processors TinkerForge (2020)
Stroomverbruik Premiere Pro - ATX 12V 26,388 W
Testconfiguratie
  • Stroomverbruik processors TinkerForge (2021)
Stroomverbruik Premiere Pro - ATX 12V - Max 36,499 W
Testconfiguratie
  • Stroomverbruik processors TinkerForge (2021)
Stroomverbruik Premiere Pro - EPS 12V1 45,093 W
Testconfiguratie
  • Stroomverbruik processors TinkerForge (2021)
Stroomverbruik Premiere Pro - EPS 12V1 - Max 62,869 W
Testconfiguratie
  • Stroomverbruik processors TinkerForge (2021)
Stroomverbruik Premiere Pro - EPS 12V2 40,727 W
Testconfiguratie
  • Stroomverbruik processors TinkerForge (2021)
Stroomverbruik Premiere Pro - EPS 12V2 - Max 56,007 W
Testconfiguratie
  • Stroomverbruik processors TinkerForge (2021)
Stroomverbruik Premiere Pro - CPU - Mediaan 85,82 W
Testconfiguratie
  • Stroomverbruik processors TinkerForge (2021)
Stroomverbruik Premiere Pro - CPU + moederbord - Mediaan 112,208 W
Testconfiguratie
  • Stroomverbruik processors TinkerForge (2021)

Testresultaten 2020-2 (Win 10 2004) RTX 3080

Red Dead 2 - 1920x1080 - Medium - Vulkan 142,5 fps
Testconfiguratie
  • CPU Test 2020
  • 2
Red Dead 2 - 1920x1080 - Medium - Vulkan (99p) 9,35 ms
Testconfiguratie
  • CPU Test 2020
  • 2
Red Dead 2 - 1920x1080 - Medium - Vulkan (99.9p) 10,3 ms
Testconfiguratie
  • CPU Test 2020
  • 2
Red Dead 2 - 1920x1080 - Ultra - Vulkan 129,9 fps
Testconfiguratie
  • CPU Test 2020
  • 2
Red Dead 2 - 1920x1080 - Ultra - Vulkan (99p) 10,13 ms
Testconfiguratie
  • CPU Test 2020
  • 2
Red Dead 2 - 1920x1080 - Ultra - Vulkan (99.9p) 11,04 ms
Testconfiguratie
  • CPU Test 2020
  • 2
Red Dead 2 - 3840x2160 - Medium - Vulkan 86,6 fps
Testconfiguratie
  • CPU Test 2020
  • 2
Red Dead 2 - 3840x2160 - Medium - Vulkan (99p) 14,41 ms
Testconfiguratie
  • CPU Test 2020
  • 2
Red Dead 2 - 3840x2160 - Medium - Vulkan (99.9p) 17,77 ms
Testconfiguratie
  • CPU Test 2020
  • 2
Red Dead 2 - 3840x2160 - Ultra - Vulkan 71,9 fps
Testconfiguratie
  • CPU Test 2020
  • 2
Red Dead 2 - 3840x2160 - Ultra - Vulkan (99p) 17,12 ms
Testconfiguratie
  • CPU Test 2020
  • 2
Red Dead 2 - 3840x2160 - Ultra - Vulkan (99.9p) 22,61 ms
Testconfiguratie
  • CPU Test 2020
  • 2
Metro Exodus - 1920x1080 - Medium 143,8 fps
Testconfiguratie
  • CPU Test 2020
  • 2
Metro Exodus - 1920x1080 - Medium (99p) 12,59 ms
Testconfiguratie
  • CPU Test 2020
  • 2
Metro Exodus - 1920x1080 - Medium (99.9p) 13,55 ms
Testconfiguratie
  • CPU Test 2020
  • 2
Metro Exodus - 1920x1080 - Ultra 115 fps
Testconfiguratie
  • CPU Test 2020
  • 2
Metro Exodus - 1920x1080 - Ultra (99p) 14,49 ms
Testconfiguratie
  • CPU Test 2020
  • 2
Metro Exodus - 1920x1080 - Ultra (99.9p) 17,88 ms
Testconfiguratie
  • CPU Test 2020
  • 2
Metro Exodus - 3840x2160 - Medium 94,1 fps
Testconfiguratie
  • CPU Test 2020
  • 2
Metro Exodus - 3840x2160 - Medium (99p) 19,48 ms
Testconfiguratie
  • CPU Test 2020
  • 2
Metro Exodus - 3840x2160 - Medium (99.9p) 23,54 ms
Testconfiguratie
  • CPU Test 2020
  • 2
Metro Exodus - 3840x2160 - Ultra 66,3 fps
Testconfiguratie
  • CPU Test 2020
  • 2
Metro Exodus - 3840x2160 - Ultra (99p) 24,1 ms
Testconfiguratie
  • CPU Test 2020
  • 2
Metro Exodus - 3840x2160 - Ultra (99.9p) 26,74 ms
Testconfiguratie
  • CPU Test 2020
  • 2
Total War: Troy - 1920x1080 - Medium 285,6 fps
Testconfiguratie
  • CPU Test 2020
  • 2
Total War: Troy - 1920x1080 - Medium (99p) 4,87 ms
Testconfiguratie
  • CPU Test 2020
  • 2
Total War: Troy - 1920x1080 - Medium (99.9p) 6,3 ms
Testconfiguratie
  • CPU Test 2020
  • 2
Total War: Troy - 1920x1080 - Ultra 125,1 fps
Testconfiguratie
  • CPU Test 2020
  • 2
Total War: Troy - 1920x1080 - Ultra (99p) 11,05 ms
Testconfiguratie
  • CPU Test 2020
  • 2
Total War: Troy - 1920x1080 - Ultra (99.9p) 12,75 ms
Testconfiguratie
  • CPU Test 2020
  • 2
F1 2020 - 1920x1080 - Medium 231,5 fps
Testconfiguratie
  • CPU Test 2020
  • 2
F1 2020 - 1920x1080 - Medium (99p) 6,3 ms
Testconfiguratie
  • CPU Test 2020
  • 2
F1 2020 - 1920x1080 - Medium (99.9p) 7,3 ms
Testconfiguratie
  • CPU Test 2020
  • 2
F1 2020 - 1920x1080 - Ultra 178,4 fps
Testconfiguratie
  • CPU Test 2020
  • 2
F1 2020 - 1920x1080 - Ultra (99p) 8,3 ms
Testconfiguratie
  • CPU Test 2020
  • 2
F1 2020 - 1920x1080 - Ultra (99.9p) 9,7 ms
Testconfiguratie
  • CPU Test 2020
  • 2
Far Cry: New Dawn - 1920x1080 - Medium 124,9 fps
Testconfiguratie
  • CPU Test 2020
  • 2
Far Cry: New Dawn - 1920x1080 - Medium (99p) 10,66 ms
Testconfiguratie
  • CPU Test 2020
  • 2
Far Cry: New Dawn - 1920x1080 - Medium (99.9p) 11,8 ms
Testconfiguratie
  • CPU Test 2020
  • 2
Far Cry: New Dawn - 1920x1080 - Ultra 110,2 fps
Testconfiguratie
  • CPU Test 2020
  • 2
Far Cry: New Dawn - 1920x1080 - Ultra (99p) 13,39 ms
Testconfiguratie
  • CPU Test 2020
  • 2
Far Cry: New Dawn - 1920x1080 - Ultra (99.9p) 14,52 ms
Testconfiguratie
  • CPU Test 2020
  • 2
Streaming (x264 6Mbit + F1 2020 1080p ultra 60fps) - gemid. 169,82 fps
Testconfiguratie
  • CPU Test 2020
  • 2

Testresultaten 2020-2 (Win 10 2004) Geïnt. GPU of GTX 1650

Cinebench R20 - Single 539,64
Testconfiguratie
  • CPU Test 2020
  • 2
Cinebench R20 - Multi 5.156,4
Testconfiguratie
  • CPU Test 2020
  • 2
Blender 2.90.1 Pavillion CPU Render 467 sec.
Testconfiguratie
  • CPU Test 2020
  • 2
Corona Render 1.3 102 sec.
Testconfiguratie
  • CPU Test 2020
  • 2
Fusion 360 - Raspberry Pi 4 B Render 4K 244 sec.
Testconfiguratie
  • CPU Test 2020
  • 2
Adobe Photoshop bewerking 120 sec.
Testconfiguratie
  • CPU Test 2020
  • 2
Adobe Premiere Pro HWI TV 4K 633 sec.
Testconfiguratie
  • CPU Test 2020
  • 2
Da Vinci Resolve - 4K Video 346 sec.
Testconfiguratie
  • CPU Test 2020
  • 2
StaxRip x264 r3018 218,45 fps
Testconfiguratie
  • CPU Test 2020
  • 2
StaxRip x265 3.4.0.26 80,14 fps
Testconfiguratie
  • CPU Test 2020
  • 2
Flac 1.3.3 - 1 uur WAV naar Flac 162 sec.
Testconfiguratie
  • CPU Test 2020
  • 2
7-Zip 20.02 - 4GB inpakken 99 sec.
Testconfiguratie
  • CPU Test 2020
  • 2
Chrome 86: Jetstream 2 166,099
Testconfiguratie
  • CPU Test 2020
  • 2
AIDA64 (6.25.5490) - Zlib 863 MB/s
Testconfiguratie
  • CPU Test 2020
  • 2
AIDA64 (6.25.5490) - AES 77.334 MB/s
Testconfiguratie
  • CPU Test 2020
  • 2
AIDA64 (6.25.5490) - Hash 26.495 MB/s
Testconfiguratie
  • CPU Test 2020
  • 2
AIDA64 (6.25.5490) - SHA3 2.611 MB/s
Testconfiguratie
  • CPU Test 2020
  • 2
AIDA64 (6.25.5490) - Julia 79.864
Testconfiguratie
  • CPU Test 2020
  • 2
AIDA64 (6.25.5490) - Mandel 42.162
Testconfiguratie
  • CPU Test 2020
  • 2
AIDA64 (6.25.5490) - FP32 Raytrace 15.912 KRay/s
Testconfiguratie
  • CPU Test 2020
  • 2
AIDA64 (6.25.5490) - FP64 Raytrace 8.929 KRay/s
Testconfiguratie
  • CPU Test 2020
  • 2
Systeemverbruik Cinebench 20 188 W
Testconfiguratie
  • CPU Test 2020
  • 2

Testresultaten 2020 (Win 10 1909) Geïnt. GPU of GTX 1650

Cinebench 10 (32 bit) - MultiThread 42.957
Testconfiguratie
  • CPU Test 2020
  • Geïnt. gpu (GTX 1650 bij CPU's zonder iGPU)
  • Windows 10 1909
  • High performance energie profiel (tenzij anders aangegeven)
Cinebench 20 - SingleThread 543
Testconfiguratie
  • CPU Test 2020
  • Geïnt. gpu (GTX 1650 bij CPU's zonder iGPU)
  • Windows 10 1909
  • High performance energie profiel (tenzij anders aangegeven)
Cinebench 20 - MultiThread 5.176
Testconfiguratie
  • CPU Test 2020
  • Geïnt. gpu (GTX 1650 bij CPU's zonder iGPU)
  • Windows 10 1909
  • High performance energie profiel (tenzij anders aangegeven)
Blender 2.81a - Pavillion CPU render 486 sec.
Testconfiguratie
  • CPU Test 2020
  • Geïnt. gpu (GTX 1650 bij CPU's zonder iGPU)
  • Windows 10 1909
  • High performance energie profiel (tenzij anders aangegeven)
Corona Renderer 1.3 102 sec.
Testconfiguratie
  • CPU Test 2020
  • Geïnt. gpu (GTX 1650 bij CPU's zonder iGPU)
  • Windows 10 1909
  • High performance energie profiel (tenzij anders aangegeven)
POV-Ray 3.7 55,34 sec.
Testconfiguratie
  • CPU Test 2020
  • Geïnt. gpu (GTX 1650 bij CPU's zonder iGPU)
  • Windows 10 1909
  • High performance energie profiel (tenzij anders aangegeven)
Adobe Lightroom 9.0 - Export 100 foto's 172 sec.
Testconfiguratie
  • CPU Test 2020
  • Geïnt. gpu (GTX 1650 bij CPU's zonder iGPU)
  • Windows 10 1909
  • High performance energie profiel (tenzij anders aangegeven)
Adobe Photoshop 21 - Panorama 132 sec.
Testconfiguratie
  • CPU Test 2020
  • Geïnt. gpu (GTX 1650 bij CPU's zonder iGPU)
  • Windows 10 1909
  • High performance energie profiel (tenzij anders aangegeven)
Adobe Photoshop 21 - Bewerkingen 129 sec.
Testconfiguratie
  • CPU Test 2020
  • Geïnt. gpu (GTX 1650 bij CPU's zonder iGPU)
  • Windows 10 1909
  • High performance energie profiel (tenzij anders aangegeven)
Adobe Premiere Pro 14 - HWI TV 4K 860 sec.
Testconfiguratie
  • CPU Test 2020
  • Geïnt. gpu (GTX 1650 bij CPU's zonder iGPU)
  • Windows 10 1909
  • High performance energie profiel (tenzij anders aangegeven)
Da Vinci Resolve - 4K Video 343 sec.
Testconfiguratie
  • CPU Test 2020
  • Geïnt. gpu (GTX 1650 bij CPU's zonder iGPU)
  • Windows 10 1909
  • High performance energie profiel (tenzij anders aangegeven)
Staxrip - x264 (r2969) 185,88 fps
Testconfiguratie
  • CPU Test 2020
  • Geïnt. gpu (GTX 1650 bij CPU's zonder iGPU)
  • Windows 10 1909
  • High performance energie profiel (tenzij anders aangegeven)
Staxrip - x265 (3.2.0.5) 58,68 fps
Testconfiguratie
  • CPU Test 2020
  • Geïnt. gpu (GTX 1650 bij CPU's zonder iGPU)
  • Windows 10 1909
  • High performance energie profiel (tenzij anders aangegeven)
Flac - 1 uur WAV naar Flac 164 sec.
Testconfiguratie
  • CPU Test 2020
  • Geïnt. gpu (GTX 1650 bij CPU's zonder iGPU)
  • Windows 10 1909
  • High performance energie profiel (tenzij anders aangegeven)
Microsoft Word 2019 - 1000 Pagina's naar PDF 56 sec.
Testconfiguratie
  • CPU Test 2020
  • Geïnt. gpu (GTX 1650 bij CPU's zonder iGPU)
  • Windows 10 1909
  • High performance energie profiel (tenzij anders aangegeven)
Microsoft Excel 2019 - Monte Carlo 3,093 sec.
Testconfiguratie
  • CPU Test 2020
  • Geïnt. gpu (GTX 1650 bij CPU's zonder iGPU)
  • Windows 10 1909
  • High performance energie profiel (tenzij anders aangegeven)
7-Zip v19.00 - 4GB inpakken 124 sec.
Testconfiguratie
  • CPU Test 2020
  • Geïnt. gpu (GTX 1650 bij CPU's zonder iGPU)
  • Windows 10 1909
  • High performance energie profiel (tenzij anders aangegeven)
Chrome 79 - Jetstream 2 156,419
Testconfiguratie
  • CPU Test 2020
  • Geïnt. gpu (GTX 1650 bij CPU's zonder iGPU)
  • Windows 10 1909
  • High performance energie profiel (tenzij anders aangegeven)
MozillaBuild - Firefox compile 1.033 sec.
Testconfiguratie
  • CPU Test 2020
  • Geïnt. gpu (GTX 1650 bij CPU's zonder iGPU)
  • Windows 10 1909
  • High performance energie profiel (tenzij anders aangegeven)
AIDA64 (6.20.5300) - Zlib 874 MB/s
Testconfiguratie
  • CPU Test 2020
  • Geïnt. gpu (GTX 1650 bij CPU's zonder iGPU)
  • Windows 10 1909
  • High performance energie profiel (tenzij anders aangegeven)
AIDA64 (6.20.5300) - AES 77.798 MB/s
Testconfiguratie
  • CPU Test 2020
  • Geïnt. gpu (GTX 1650 bij CPU's zonder iGPU)
  • Windows 10 1909
  • High performance energie profiel (tenzij anders aangegeven)
AIDA64 (6.20.5300) - SHA3 2.626 MB/s
Testconfiguratie
  • CPU Test 2020
  • Geïnt. gpu (GTX 1650 bij CPU's zonder iGPU)
  • Windows 10 1909
  • High performance energie profiel (tenzij anders aangegeven)
AIDA64 (6.20.5300) - Hash 26.632 MB/s
Testconfiguratie
  • CPU Test 2020
  • Geïnt. gpu (GTX 1650 bij CPU's zonder iGPU)
  • Windows 10 1909
  • High performance energie profiel (tenzij anders aangegeven)
AIDA64 (6.20.5300) - Julia 80.155
Testconfiguratie
  • CPU Test 2020
  • Geïnt. gpu (GTX 1650 bij CPU's zonder iGPU)
  • Windows 10 1909
  • High performance energie profiel (tenzij anders aangegeven)
AIDA64 (6.20.5300) - Mandel 42.505
Testconfiguratie
  • CPU Test 2020
  • Geïnt. gpu (GTX 1650 bij CPU's zonder iGPU)
  • Windows 10 1909
  • High performance energie profiel (tenzij anders aangegeven)
AIDA64 (6.20.5300) - FP32 Raytrace 15.962 KRay/s
Testconfiguratie
  • CPU Test 2020
  • Geïnt. gpu (GTX 1650 bij CPU's zonder iGPU)
  • Windows 10 1909
  • High performance energie profiel (tenzij anders aangegeven)
AIDA64 (6.20.5300) - FP64 Raytrace 8.958 KRay/s
Testconfiguratie
  • CPU Test 2020
  • Geïnt. gpu (GTX 1650 bij CPU's zonder iGPU)
  • Windows 10 1909
  • High performance energie profiel (tenzij anders aangegeven)
Systeemverbruik Cinebench 20 177 W
Testconfiguratie
  • CPU Test 2020
  • Geïnt. gpu (GTX 1650 bij CPU's zonder iGPU)
  • Windows 10 1909
  • High performance energie profiel (tenzij anders aangegeven)

Testresultaten 2020 (Win 10 1909) - RTX 2080 Ti

Battlefield V (DX12) - 1920x1080 - Medium 162,5 fps
Testconfiguratie
  • CPU Test 2020
  • Icm. RTX 2080 Ti
  • Windows 10 1909
  • High performance energie profiel
Battlefield V (DX12) - 1920x1080 - Ultra 149,8 fps
Testconfiguratie
  • CPU Test 2020
  • Icm. RTX 2080 Ti
  • Windows 10 1909
  • High performance energie profiel
Dirt Rally 2.0 - 1920x1080 - Medium 285 fps
Testconfiguratie
  • CPU Test 2020
  • Icm. RTX 2080 Ti
  • Windows 10 1909
  • High performance energie profiel
Dirt Rally 2.0 - 1920x1080 - Ultra 147,1 fps
Testconfiguratie
  • CPU Test 2020
  • Icm. RTX 2080 Ti
  • Windows 10 1909
  • High performance energie profiel
GTA V - 1920x1080 - Medium 145,6 fps
Testconfiguratie
  • CPU Test 2020
  • Icm. RTX 2080 Ti
  • Windows 10 1909
  • High performance energie profiel
GTA V - 1920x1080 - Ultra 109,3 fps
Testconfiguratie
  • CPU Test 2020
  • Icm. RTX 2080 Ti
  • Windows 10 1909
  • High performance energie profiel
The Division 2 (DX12) - 1920x1080 - Medium 198,1 fps
Testconfiguratie
  • CPU Test 2020
  • Icm. RTX 2080 Ti
  • Windows 10 1909
  • High performance energie profiel
The Division 2 (DX12) - 1920x1080 - Ultra 139,8 fps
Testconfiguratie
  • CPU Test 2020
  • Icm. RTX 2080 Ti
  • Windows 10 1909
  • High performance energie profiel
Total War: Three Kingdoms - 1920x1080 - Medium 160,3 fps
Testconfiguratie
  • CPU Test 2020
  • Icm. RTX 2080 Ti
  • Windows 10 1909
  • High performance energie profiel
Total War: Three Kingdoms - 1920x1080 - Ultra 105 fps
Testconfiguratie
  • CPU Test 2020
  • Icm. RTX 2080 Ti
  • Windows 10 1909
  • High performance energie profiel
Factorio (0.17.79) 10K SPM Base (Headless) - 10.000 ticks 111,43 UPS
Testconfiguratie
  • CPU Test 2020
  • Icm. RTX 2080 Ti
  • Windows 10 1909
  • High performance energie profiel
Streaming (x264 6Mbit + F1 2019) - gem. over 3 runs 132,0 fps
Testconfiguratie
  • CPU Test 2020
  • Icm. RTX 2080 Ti
  • Windows 10 1909
  • High performance energie profiel
Hardware Info CPU Gaming Prestatiescore 2020 155,8
Testconfiguratie
  • CPU Test 2020
  • Icm. RTX 2080 Ti
  • Windows 10 1909
  • High performance energie profiel
Shadow of the Tomb Raider - 1080p medium 141 fps
Testconfiguratie
  • CPU Test 2020
  • Icm. RTX 2080 Ti
  • Windows 10 1909
  • High performance energie profiel
Assassin's Creed Odyssey - 1080p medium 115 fps
Testconfiguratie
  • CPU Test 2020
  • Icm. RTX 2080 Ti
  • Windows 10 1909
  • High performance energie profiel

Testresultaten 2020 (Win 10 1909) - RTX 2080 Ti - Frametimes

Battlefield V (DX12) - 1920x1080 - Medium (99p) 11,83 ms
Testconfiguratie
  • CPU Test 2020
  • Icm. RTX 2080 Ti
  • Windows 10 1909
  • High performance energie profiel
Battlefield V (DX12) - 1920x1080 - Ultra (99p) 11,88 ms
Testconfiguratie
  • CPU Test 2020
  • Icm. RTX 2080 Ti
  • Windows 10 1909
  • High performance energie profiel
GTA V - 1920x1080 - Medium (99p) 11 ms
Testconfiguratie
  • CPU Test 2020
  • Icm. RTX 2080 Ti
  • Windows 10 1909
  • High performance energie profiel
GTA V - 1920x1080 - Ultra (99p) 13 ms
Testconfiguratie
  • CPU Test 2020
  • Icm. RTX 2080 Ti
  • Windows 10 1909
  • High performance energie profiel
The Division 2 (DX12) - 1920x1080 - Medium (99p) 7,63 ms
Testconfiguratie
  • CPU Test 2020
  • Icm. RTX 2080 Ti
  • Windows 10 1909
  • High performance energie profiel
The Division 2 (DX12) - 1920x1080 - Ultra (99p) 10,49 ms
Testconfiguratie
  • CPU Test 2020
  • Icm. RTX 2080 Ti
  • Windows 10 1909
  • High performance energie profiel
Total War: Three Kingdoms - 1920x1080 - Medium (99p) 8,5 ms
Testconfiguratie
  • CPU Test 2020
  • Icm. RTX 2080 Ti
  • Windows 10 1909
  • High performance energie profiel
Total War: Three Kingdoms - 1920x1080 - Ultra (99p) 14,7 ms
Testconfiguratie
  • CPU Test 2020
  • Icm. RTX 2080 Ti
  • Windows 10 1909
  • High performance energie profiel

Stroomverbruik 2020 (Enkel CPU)

Stroomverbruik idle - Minimaal 6,23 W
Testconfiguratie
  • Stroomverbruik processors (enkel CPU) (2020)
Stroomverbruik idle - Gemiddelde 5 min. 6,84 W
Testconfiguratie
  • Stroomverbruik processors (enkel CPU) (2020)
Stroomverbruik - Cinebench 20 - Gemiddeld 108,0 W
Testconfiguratie
  • Stroomverbruik processors (enkel CPU) (2020)
Stroomverbruik - Cinebench 20 - Totaal (Wh) 1,86 Wh
Testconfiguratie
  • Stroomverbruik processors (enkel CPU) (2020)
Stroomverbruik - Cinebench 20 - Maximaal 114,52 W
Testconfiguratie
  • Stroomverbruik processors (enkel CPU) (2020)
Adobe Premiere Pro 14 - Verbruik - Gemiddeld 79,7 W
Testconfiguratie
  • Stroomverbruik processors (enkel CPU) (2020)
Adobe Premiere Pro 14 - Verbruik - Totaal (Wh) 19,21 Wh
Testconfiguratie
  • Stroomverbruik processors (enkel CPU) (2020)

Temperatuur resultaten (Dark Rock Pro 4 @ 12V)

Max. temperatuur (15 min. Cinebench 20) 80 °C
Testconfiguratie
  • Temperatuur test 2020
Gem. kloksnelheid (15 min. Cinebench 20) 4.211 MHz
Testconfiguratie
  • Temperatuur test 2020
Max. package power (HWinfo) 114 W
Testconfiguratie
  • Temperatuur test 2020

Reviews

Processors

AMD Ryzen XT: Turbo of Teleurstelling?

AMD introduceerde onlangs nieuwe Ryzen XT processors, chips gebaseerd op Zen 2, maar volgens AMD met een aantal substantiele verbeteringen. Wij testten de de Ryzen 5 3600XT, Ryzen 7 3800XT en Ryzen 9 3900XT en vertellen je of deze nieuwe modellen het kopen waard zijn.

24 juli 2020 06:00
Processors

AMD Ryzen 3000XT test: Toppunt of Tussenpaus?

De Ryzen 5 3600XT, Ryzen 7 3700XT en Ryzen 9 3900XT zijn AMD's reactie op de lancering van Intels 10de generatie Core-processors. Maar zijn deze bekroning op de Ryzen 3000-serie ook het kopen waard?

7 juli 2020 15:00

Alternatieven

AMD Ryzen 9 3900XT Boxed

  • Socket AM4
  • 3.8 GHz
  • 12 cores
  • 105 W
 

AMD Ryzen 5 3600X Boxed

  • Socket AM4
  • 3.8 GHz
  • 6 cores
  • 95 W
 

AMD Ryzen 5 3600XT Boxed

  • Socket AM4
  • 3.8 GHz
  • 6 cores
  • 95 W
 

AMD Ryzen 9 3950X Boxed

  • Socket AM4
  • 3.5 GHz
  • 16 cores
  • 105 W
 

Intel Core i5 9600K Boxed

  • Socket 1151
  • 3.7 GHz
  • 6 cores
  • 95 W
  • Geïntegreerde GPU
 

Intel Core i9 10900K Boxed

  • Socket 1200
  • 3.7 GHz
  • 10 cores
  • 125 W
  • Geïntegreerde GPU
 

Intel Core i7 10700K Boxed

  • Socket 1200
  • 3.8 GHz
  • 8 cores
  • 125 W
  • Geïntegreerde GPU
 

Intel Core i5 10600K Boxed

  • Socket 1200
  • 4.1 GHz
  • 6 cores
  • 125 W
  • Geïntegreerde GPU
 

Intel Core i9 10980XE Boxed

  • Socket 2066
  • 3.0 GHz
  • 18 cores
  • 165 W
 

AMD Ryzen Threadripper 3960X Boxed

  • Socket TRX4
  • 3.8 GHz
  • 24 cores
  • 280 W
 

AMD Ryzen 5 2600 Boxed

  • Socket AM4
  • 3.4 GHz
  • 6 cores
  • 65 W
 

AMD Ryzen 7 3700X Boxed

  • Socket AM4
  • 3.6 GHz
  • 8 cores
  • 65 W
 
0