Great Value

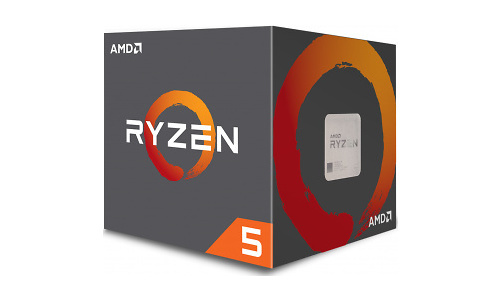
AMD Ryzen 5 2600 Boxed

Prijsverloop

Dit product is niet (meer) verkrijgbaar bij de bij Hardware Info aangesloten shops.

Specificaties

Belangrijkste specificaties

CPU-socket Socket AM4
Klokfrequentie 3,4 GHz
Aantal cores totaal 6 cores
Thermal design power 65 W
Geïntegreerde GPU

Processor

Processorserie Ryzen 5
CPU-core Pinnacle Ridge
CPU-revisie B2
CPU-socket Socket AM4
Klokfrequentie 3,4 GHz
Alle cores turbo klokfrequentie 3,6 GHz
Max. turbo klokfrequentie 3,9 GHz
XFR 3,9 GHz
Aantal cores totaal 6 cores
Aantal threads 12
HyperThreading / SMT
Multiplier 34 x
Multiplier unlocked
Bussnelheid / bClk 100 MHz
Geïntegreerde geheugencontroller DDR4-2933 (Dual Channel)
Thermal design power 65 W
Productie-procedé 12 nm
Die-grootte 213 mm²
Aantal transistors 4.800 mln
Aantal PCIe lanes 20
Uitvoering Boxed
Koeler meegeleverd

Geheugencontroller

Geïntegreerde geheugencontroller
Geheugentype DDR4
Geheugensnelheid 2.933 MHz
Geheugenkanalen 2

Video

Geïntegreerde GPU

Cache

L2-cache 3.072 kB
L3-cache 16 MB

Instructieset

IA-64
MMX
SSE
SSE2
SSE3
SSE4A
SSE4.1
SSE4.2
x86-64
XD-bit
AVX
AVX2
AVX-512
AES-NI

Productcodes

SKU YD2600BBAFBOX
EAN 0730143309165, 9352445038034
Toegevoegd aan Hardware Info vrijdag 13 april 2018

Testresultaten

Dit product is door Hardware Info getest op dinsdag 10 november 2020.

Benchmarks 2020 (5950X @ 4.65GHz)

Total War: Warhammer III 1920x1080 Medium 149,1 fps
Testconfiguratie
  • Ryzen 9 5950X @ 4.65GHz, 32GB DDR4
  • 3600C16, MSI X570 Godlike, Samsung 970 Evo 1TB+Kioxia Exceria Plus 2TB, Windows 10 Pro x64
Total War: Warhammer III 1920x1080 Medium (99p) 11,45 ms
Testconfiguratie
  • Ryzen 9 5950X @ 4.65GHz, 32GB DDR4
  • 3600C16, MSI X570 Godlike, Samsung 970 Evo 1TB+Kioxia Exceria Plus 2TB, Windows 10 Pro x64
Total War: Warhammer III 1920x1080 Medium (99.9p) 12,81 ms
Testconfiguratie
  • Ryzen 9 5950X @ 4.65GHz, 32GB DDR4
  • 3600C16, MSI X570 Godlike, Samsung 970 Evo 1TB+Kioxia Exceria Plus 2TB, Windows 10 Pro x64
Total War: Warhammer III 1920x1080 Ultra 87,2 fps
Testconfiguratie
  • Ryzen 9 5950X @ 4.65GHz, 32GB DDR4
  • 3600C16, MSI X570 Godlike, Samsung 970 Evo 1TB+Kioxia Exceria Plus 2TB, Windows 10 Pro x64
Total War: Warhammer III 1920x1080 Ultra (99p) 18,81 ms
Testconfiguratie
  • Ryzen 9 5950X @ 4.65GHz, 32GB DDR4
  • 3600C16, MSI X570 Godlike, Samsung 970 Evo 1TB+Kioxia Exceria Plus 2TB, Windows 10 Pro x64
Total War: Warhammer III 1920x1080 Ultra (99.9p) 20,69 ms
Testconfiguratie
  • Ryzen 9 5950X @ 4.65GHz, 32GB DDR4
  • 3600C16, MSI X570 Godlike, Samsung 970 Evo 1TB+Kioxia Exceria Plus 2TB, Windows 10 Pro x64

Testresultaten RX 6900 XT

Red Dead 2 - 1920x1080 - Medium - Vulkan 106,1
Testconfiguratie
  • CPU Test 2021
  • 1
Red Dead 2 - 1920x1080 - Medium - Vulkan (99p) 12,91
Testconfiguratie
  • CPU Test 2021
  • 1
Red Dead 2 - 1920x1080 - Medium - Vulkan (99.9p) 13,86
Testconfiguratie
  • CPU Test 2021
  • 1
Red Dead 2 - 1920x1080 - Ultra - Vulkan 106,6
Testconfiguratie
  • CPU Test 2021
  • 1
Red Dead 2 - 1920x1080 - Ultra - Vulkan (99p) 12,65
Testconfiguratie
  • CPU Test 2021
  • 1
Red Dead 2 - 1920x1080 - Ultra - Vulkan (99.9p) 14,16
Testconfiguratie
  • CPU Test 2021
  • 1
Red Dead 2 - 3840x2160 - Medium - Vulkan 107,8
Testconfiguratie
  • CPU Test 2021
  • 1
Red Dead 2 - 3840x2160 - Medium - Vulkan (99p) 12,42
Testconfiguratie
  • CPU Test 2021
  • 1
Red Dead 2 - 3840x2160 - Medium - Vulkan (99.9p) 13,44
Testconfiguratie
  • CPU Test 2021
  • 1
Red Dead 2 - 3840x2160 - Ultra - Vulkan 101,3
Testconfiguratie
  • CPU Test 2021
  • 1
Red Dead 2 - 3840x2160 - Ultra - Vulkan (99p) 12,86
Testconfiguratie
  • CPU Test 2021
  • 1
Red Dead 2 - 3840x2160 - Ultra - Vulkan (99.9p) 14,09
Testconfiguratie
  • CPU Test 2021
  • 1
Metro Exodus - 1920x1080 - Medium 137,2
Testconfiguratie
  • CPU Test 2021
  • 1
Metro Exodus - 1920x1080 - Medium (99p) 13,31
Testconfiguratie
  • CPU Test 2021
  • 1
Metro Exodus - 1920x1080 - Medium (99.9p) 14,17
Testconfiguratie
  • CPU Test 2021
  • 1
Metro Exodus - 1920x1080 - Ultra 102,2
Testconfiguratie
  • CPU Test 2021
  • 1
Metro Exodus - 1920x1080 - Ultra (99p) 17,47
Testconfiguratie
  • CPU Test 2021
  • 1
Metro Exodus - 1920x1080 - Ultra (99.9p) 18,81
Testconfiguratie
  • CPU Test 2021
  • 1
Metro Exodus - 3840x2160 - Medium 131,1
Testconfiguratie
  • CPU Test 2021
  • 1
Metro Exodus - 3840x2160 - Medium (99p) 13,62
Testconfiguratie
  • CPU Test 2021
  • 1
Metro Exodus - 3840x2160 - Medium (99.9p) 14,57
Testconfiguratie
  • CPU Test 2021
  • 1
Metro Exodus - 3840x2160 - Ultra 97,9
Testconfiguratie
  • CPU Test 2021
  • 1
Metro Exodus - 3840x2160 - Ultra (99p) 17,6
Testconfiguratie
  • CPU Test 2021
  • 1
Metro Exodus - 3840x2160 - Ultra (99.9p) 19,46
Testconfiguratie
  • CPU Test 2021
  • 1
F1 2021 - 1920x1080 - Medium 191,9
Testconfiguratie
  • CPU Test 2021
  • 1
F1 2021 - 1920x1080 - Medium (99p) 7,2
Testconfiguratie
  • CPU Test 2021
  • 1
F1 2021 - 1920x1080 - Medium (99.9p) 8,1
Testconfiguratie
  • CPU Test 2021
  • 1
F1 2021 - 1920x1080 - Ultra 142
Testconfiguratie
  • CPU Test 2021
  • 1
F1 2021 - 1920x1080 - Ultra (99p) 9
Testconfiguratie
  • CPU Test 2021
  • 1
F1 2021 - 1920x1080 - Ultra (99.9p) 10,9
Testconfiguratie
  • CPU Test 2021
  • 1
Streaming (x264 6Mbit + F1 2021 1080p ultra 60fps) - gemid. 26,67
Testconfiguratie
  • CPU Test 2021
  • 1
Far Cry 6 - 1920x1080 - Medium 78,4
Testconfiguratie
  • CPU Test 2022
Far Cry 6 - 1920x1080 - Medium (99p) 18,38
Testconfiguratie
  • CPU Test 2022
Far Cry 6 - 1920x1080 - Medium (99.9p) 26,85
Testconfiguratie
  • CPU Test 2022
Far Cry 6 - 1920x1080 - Ultra 66,1
Testconfiguratie
  • CPU Test 2022
Far Cry 6 - 1920x1080 - Ultra (99p) 22,22
Testconfiguratie
  • CPU Test 2022
Far Cry 6 - 1920x1080 - Ultra (99.9p) 28,11
Testconfiguratie
  • CPU Test 2022

Testresultaten (Met geïnt. GPU of GTX 1650)

Cinebench R23 - Single 1.019,88
Testconfiguratie
  • CPU Test 2021
  • 1
Cinebench R23 - Multi 7.281,12
Testconfiguratie
  • CPU Test 2021
  • 1
Corona Render 170 sec.
Testconfiguratie
  • CPU Test 2021
  • 1
Adobe Photoshop bewerking 191 sec.
Testconfiguratie
  • CPU Test 2021
  • 1
Adobe Premiere Pro HWI TV 4K 891 sec.
Testconfiguratie
  • CPU Test 2021
  • 1
Da Vinci Resolve - 4K Video 588 sec.
Testconfiguratie
  • CPU Test 2021
  • 1
StaxRip x264 53,35 fps
Testconfiguratie
  • CPU Test 2021
  • 1
StaxRip x265 10,47 fps
Testconfiguratie
  • CPU Test 2021
  • 1
Flac - 1 uur WAV naar Flac 235 sec.
Testconfiguratie
  • CPU Test 2021
  • 1
Chrome : Jetstream 2 138.328
Testconfiguratie
  • CPU Test 2021
  • 1
MozillaBuild - Firefox compile 2.018
Testconfiguratie
  • CPU Test 2021
  • 1
AIDA64 - Zlib 514
Testconfiguratie
  • CPU Test 2021
  • 1
AIDA64 - AES 49.291
Testconfiguratie
  • CPU Test 2021
  • 1
AIDA64 - Hash 16.770
Testconfiguratie
  • CPU Test 2021
  • 1
AIDA64 - SHA3 1.587
Testconfiguratie
  • CPU Test 2021
  • 1
AIDA64 - Julia 28.823
Testconfiguratie
  • CPU Test 2021
  • 1
AIDA64 - Mandel 14.958
Testconfiguratie
  • CPU Test 2021
  • 1
AIDA64 - FP32 Raytrace 5.876
Testconfiguratie
  • CPU Test 2021
  • 1
AIDA64 - FP64 Raytrace 2.993
Testconfiguratie
  • CPU Test 2021
  • 1
Systeemverbruik Cinebench 23 145 W
Testconfiguratie
  • CPU Test 2021
  • 1
Blender - Italian Flat Render 1.354 sec.
Testconfiguratie
  • CPU Test 2022
7-Zip - 15GB inpakken 637 sec.
Testconfiguratie
  • CPU Test 2022

Stroomverbruik processors met TinkerForge

Stroomverbruik idle - ATX 12V 11,167 W
Testconfiguratie
  • Stroomverbruik processors TinkerForge (2021)
Stroomverbruik idle - EPS 12V2 7,029 W
Testconfiguratie
  • Stroomverbruik processors TinkerForge (2021)
Stroomverbruik idle - EPS 12V1 8,388 W
Testconfiguratie
  • Stroomverbruik processors TinkerForge (2021)
Stroomverbruik idle - CPU - Mediaan 5 min. 15,417 W
Testconfiguratie
  • Stroomverbruik processors TinkerForge (2021)
Stroomverbruik idle - CPU + moederbord - Mediaan 5 min. 26,584 W
Testconfiguratie
  • Stroomverbruik processors TinkerForge (2021)
Stroomverbruik Cinebench R20 - ATX 12V 13,724 W
Testconfiguratie
  • Stroomverbruik processors TinkerForge (2020)
Stroomverbruik Cinebench R20 - ATX 12V - Max 23,047 W
Testconfiguratie
  • Stroomverbruik processors TinkerForge (2020)
Stroomverbruik Cinebench R20 - EPS 12V1 47,432 W
Testconfiguratie
  • Stroomverbruik processors TinkerForge (2020)
Stroomverbruik Cinebench R20 - EPS 12V1 - Max 49,648 W
Testconfiguratie
  • Stroomverbruik processors TinkerForge (2020)
Stroomverbruik Cinebench R20 - EPS 12V2 40,06 W
Testconfiguratie
  • Stroomverbruik processors TinkerForge (2020)
Stroomverbruik Cinebench R20 - EPS 12V2 - Max 41,95 W
Testconfiguratie
  • Stroomverbruik processors TinkerForge (2020)
Stroomverbruik Cinebench R20 - CPU - Mediaan 87,492 W
Testconfiguratie
  • Stroomverbruik processors TinkerForge (2020)
Stroomverbruik Cinebench R20 - CPU + moederbord - Mediaan 101,216 W
Testconfiguratie
  • Stroomverbruik processors TinkerForge (2020)
Stroomverbruik Cinebench R20 - CPU + moederbord - Totaal 2,99 Wh
Testconfiguratie
  • Stroomverbruik processors TinkerForge (2020)
Stroomverbruik Premiere Pro - ATX 12V 27,306 W
Testconfiguratie
  • Stroomverbruik processors TinkerForge (2021)
Stroomverbruik Premiere Pro - ATX 12V - Max 44,29 W
Testconfiguratie
  • Stroomverbruik processors TinkerForge (2021)
Stroomverbruik Premiere Pro - EPS 12V1 42,052 W
Testconfiguratie
  • Stroomverbruik processors TinkerForge (2021)
Stroomverbruik Premiere Pro - EPS 12V1 - Max 52,769 W
Testconfiguratie
  • Stroomverbruik processors TinkerForge (2021)
Stroomverbruik Premiere Pro - EPS 12V2 35,421 W
Testconfiguratie
  • Stroomverbruik processors TinkerForge (2021)
Stroomverbruik Premiere Pro - EPS 12V2 - Max 44,281 W
Testconfiguratie
  • Stroomverbruik processors TinkerForge (2021)
Stroomverbruik Premiere Pro - CPU - Mediaan 77,473 W
Testconfiguratie
  • Stroomverbruik processors TinkerForge (2021)
Stroomverbruik Premiere Pro - CPU + moederbord - Mediaan 104,779 W
Testconfiguratie
  • Stroomverbruik processors TinkerForge (2021)

Testresultaten 2020-2 (Win 10 2004) RTX 3080

Red Dead 2 - 1920x1080 - Medium - Vulkan 106,7 fps
Testconfiguratie
  • CPU Test 2020
  • 2
Red Dead 2 - 1920x1080 - Medium - Vulkan (99p) 12,94 ms
Testconfiguratie
  • CPU Test 2020
  • 2
Red Dead 2 - 1920x1080 - Medium - Vulkan (99.9p) 13,85 ms
Testconfiguratie
  • CPU Test 2020
  • 2
Red Dead 2 - 1920x1080 - Ultra - Vulkan 106,1 fps
Testconfiguratie
  • CPU Test 2020
  • 2
Red Dead 2 - 1920x1080 - Ultra - Vulkan (99p) 13,04 ms
Testconfiguratie
  • CPU Test 2020
  • 2
Red Dead 2 - 1920x1080 - Ultra - Vulkan (99.9p) 14,02 ms
Testconfiguratie
  • CPU Test 2020
  • 2
Red Dead 2 - 3840x2160 - Medium - Vulkan 86,2 fps
Testconfiguratie
  • CPU Test 2020
  • 2
Red Dead 2 - 3840x2160 - Medium - Vulkan (99p) 15,36 ms
Testconfiguratie
  • CPU Test 2020
  • 2
Red Dead 2 - 3840x2160 - Medium - Vulkan (99.9p) 18,65 ms
Testconfiguratie
  • CPU Test 2020
  • 2
Red Dead 2 - 3840x2160 - Ultra - Vulkan 70,4 fps
Testconfiguratie
  • CPU Test 2020
  • 2
Red Dead 2 - 3840x2160 - Ultra - Vulkan (99p) 18,25 ms
Testconfiguratie
  • CPU Test 2020
  • 2
Red Dead 2 - 3840x2160 - Ultra - Vulkan (99.9p) 28,49 ms
Testconfiguratie
  • CPU Test 2020
  • 2
Metro Exodus - 1920x1080 - Medium 108 fps
Testconfiguratie
  • CPU Test 2020
  • 2
Metro Exodus - 1920x1080 - Medium (99p) 16,67 ms
Testconfiguratie
  • CPU Test 2020
  • 2
Metro Exodus - 1920x1080 - Medium (99.9p) 17,86 ms
Testconfiguratie
  • CPU Test 2020
  • 2
Metro Exodus - 1920x1080 - Ultra 83,2 fps
Testconfiguratie
  • CPU Test 2020
  • 2
Metro Exodus - 1920x1080 - Ultra (99p) 21,01 ms
Testconfiguratie
  • CPU Test 2020
  • 2
Metro Exodus - 1920x1080 - Ultra (99.9p) 22,65 ms
Testconfiguratie
  • CPU Test 2020
  • 2
Metro Exodus - 3840x2160 - Medium 86,7 fps
Testconfiguratie
  • CPU Test 2020
  • 2
Metro Exodus - 3840x2160 - Medium (99p) 19,61 ms
Testconfiguratie
  • CPU Test 2020
  • 2
Metro Exodus - 3840x2160 - Medium (99.9p) 23,55 ms
Testconfiguratie
  • CPU Test 2020
  • 2
Metro Exodus - 3840x2160 - Ultra 64,9 fps
Testconfiguratie
  • CPU Test 2020
  • 2
Metro Exodus - 3840x2160 - Ultra (99p) 26,81 ms
Testconfiguratie
  • CPU Test 2020
  • 2
Metro Exodus - 3840x2160 - Ultra (99.9p) 30,33 ms
Testconfiguratie
  • CPU Test 2020
  • 2
Total War: Troy - 1920x1080 - Medium 192,6 fps
Testconfiguratie
  • CPU Test 2020
  • 2
Total War: Troy - 1920x1080 - Medium (99p) 7,78 ms
Testconfiguratie
  • CPU Test 2020
  • 2
Total War: Troy - 1920x1080 - Medium (99.9p) 9,44 ms
Testconfiguratie
  • CPU Test 2020
  • 2
Total War: Troy - 1920x1080 - Ultra 90,9 fps
Testconfiguratie
  • CPU Test 2020
  • 2
Total War: Troy - 1920x1080 - Ultra (99p) 16,03 ms
Testconfiguratie
  • CPU Test 2020
  • 2
Total War: Troy - 1920x1080 - Ultra (99.9p) 18,33 ms
Testconfiguratie
  • CPU Test 2020
  • 2
F1 2020 - 1920x1080 - Medium 165,7 fps
Testconfiguratie
  • CPU Test 2020
  • 2
F1 2020 - 1920x1080 - Medium (99p) 8,6 ms
Testconfiguratie
  • CPU Test 2020
  • 2
F1 2020 - 1920x1080 - Medium (99.9p) 10,1 ms
Testconfiguratie
  • CPU Test 2020
  • 2
F1 2020 - 1920x1080 - Ultra 132,5 fps
Testconfiguratie
  • CPU Test 2020
  • 2
F1 2020 - 1920x1080 - Ultra (99p) 10,9 ms
Testconfiguratie
  • CPU Test 2020
  • 2
F1 2020 - 1920x1080 - Ultra (99.9p) 12,9 ms
Testconfiguratie
  • CPU Test 2020
  • 2
Far Cry: New Dawn - 1920x1080 - Medium 96,2 fps
Testconfiguratie
  • CPU Test 2020
  • 2
Far Cry: New Dawn - 1920x1080 - Medium (99p) 14,03 ms
Testconfiguratie
  • CPU Test 2020
  • 2
Far Cry: New Dawn - 1920x1080 - Medium (99.9p) 15,53 ms
Testconfiguratie
  • CPU Test 2020
  • 2
Far Cry: New Dawn - 1920x1080 - Ultra 84,5 fps
Testconfiguratie
  • CPU Test 2020
  • 2
Far Cry: New Dawn - 1920x1080 - Ultra (99p) 17,33 ms
Testconfiguratie
  • CPU Test 2020
  • 2
Far Cry: New Dawn - 1920x1080 - Ultra (99.9p) 18,86 ms
Testconfiguratie
  • CPU Test 2020
  • 2
Streaming (x264 6Mbit + F1 2020 1080p ultra 60fps) - gemid. 153,26 fps
Testconfiguratie
  • CPU Test 2020
  • 2

Testresultaten 2020-2 (Win 10 2004) Geïnt. GPU of GTX 1650

Cinebench R20 - Single 392
Testconfiguratie
  • CPU Test 2020
  • 2
Cinebench R20 - Multi 2.782
Testconfiguratie
  • CPU Test 2020
  • 2
Blender 2.90.1 Pavillion CPU Render 855 sec.
Testconfiguratie
  • CPU Test 2020
  • 2
Corona Render 1.3 175 sec.
Testconfiguratie
  • CPU Test 2020
  • 2
Fusion 360 - Raspberry Pi 4 B Render 4K 435 sec.
Testconfiguratie
  • CPU Test 2020
  • 2
Adobe Photoshop bewerking 191 sec.
Testconfiguratie
  • CPU Test 2020
  • 2
Adobe Premiere Pro HWI TV 4K 887 sec.
Testconfiguratie
  • CPU Test 2020
  • 2
Da Vinci Resolve - 4K Video 591 sec.
Testconfiguratie
  • CPU Test 2020
  • 2
StaxRip x264 r3018 151,19 fps
Testconfiguratie
  • CPU Test 2020
  • 2
StaxRip x265 3.4.0.26 46,71 fps
Testconfiguratie
  • CPU Test 2020
  • 2
Flac 1.3.3 - 1 uur WAV naar Flac 241 sec.
Testconfiguratie
  • CPU Test 2020
  • 2
7-Zip 20.02 - 4GB inpakken 171 sec.
Testconfiguratie
  • CPU Test 2020
  • 2
Chrome 86: Jetstream 2 117,156
Testconfiguratie
  • CPU Test 2020
  • 2
AIDA64 (6.25.5490) - Zlib 517 MB/s
Testconfiguratie
  • CPU Test 2020
  • 2
AIDA64 (6.25.5490) - AES 49.517 MB/s
Testconfiguratie
  • CPU Test 2020
  • 2
AIDA64 (6.25.5490) - Hash 16.810 MB/s
Testconfiguratie
  • CPU Test 2020
  • 2
AIDA64 (6.25.5490) - SHA3 1.584 MB/s
Testconfiguratie
  • CPU Test 2020
  • 2
AIDA64 (6.25.5490) - Julia 28.873
Testconfiguratie
  • CPU Test 2020
  • 2
AIDA64 (6.25.5490) - Mandel 15.062
Testconfiguratie
  • CPU Test 2020
  • 2
AIDA64 (6.25.5490) - FP32 Raytrace 5.941 KRay/s
Testconfiguratie
  • CPU Test 2020
  • 2
AIDA64 (6.25.5490) - FP64 Raytrace 2.985 KRay/s
Testconfiguratie
  • CPU Test 2020
  • 2
Systeemverbruik Cinebench 20 147 W
Testconfiguratie
  • CPU Test 2020
  • 2

Testresultaten 2020 (Win 10 1909) Geïnt. GPU of GTX 1650

Cinebench 10 (32 bit) - MultiThread 27.796
Testconfiguratie
  • CPU Test 2020
  • Geïnt. gpu (GTX 1650 bij CPU's zonder iGPU)
  • Windows 10 1909
  • High performance energie profiel (tenzij anders aangegeven)
Cinebench 20 - SingleThread 384
Testconfiguratie
  • CPU Test 2020
  • Geïnt. gpu (GTX 1650 bij CPU's zonder iGPU)
  • Windows 10 1909
  • High performance energie profiel (tenzij anders aangegeven)
Cinebench 20 - MultiThread 2.873
Testconfiguratie
  • CPU Test 2020
  • Geïnt. gpu (GTX 1650 bij CPU's zonder iGPU)
  • Windows 10 1909
  • High performance energie profiel (tenzij anders aangegeven)
Blender 2.81a - Pavillion CPU render 964 sec.
Testconfiguratie
  • CPU Test 2020
  • Geïnt. gpu (GTX 1650 bij CPU's zonder iGPU)
  • Windows 10 1909
  • High performance energie profiel (tenzij anders aangegeven)
Adobe Lightroom 9.0 - Export 100 foto's 261 sec.
Testconfiguratie
  • CPU Test 2020
  • Geïnt. gpu (GTX 1650 bij CPU's zonder iGPU)
  • Windows 10 1909
  • High performance energie profiel (tenzij anders aangegeven)
Adobe Photoshop 21 - Panorama 175 sec.
Testconfiguratie
  • CPU Test 2020
  • Geïnt. gpu (GTX 1650 bij CPU's zonder iGPU)
  • Windows 10 1909
  • High performance energie profiel (tenzij anders aangegeven)
Adobe Photoshop 21 - Bewerkingen 195 sec.
Testconfiguratie
  • CPU Test 2020
  • Geïnt. gpu (GTX 1650 bij CPU's zonder iGPU)
  • Windows 10 1909
  • High performance energie profiel (tenzij anders aangegeven)
Adobe Premiere Pro 14 - HWI TV 4K 1.141 sec.
Testconfiguratie
  • CPU Test 2020
  • Geïnt. gpu (GTX 1650 bij CPU's zonder iGPU)
  • Windows 10 1909
  • High performance energie profiel (tenzij anders aangegeven)
Da Vinci Resolve - 4K Video 574 sec.
Testconfiguratie
  • CPU Test 2020
  • Geïnt. gpu (GTX 1650 bij CPU's zonder iGPU)
  • Windows 10 1909
  • High performance energie profiel (tenzij anders aangegeven)
Staxrip - x264 (r2969) 136 fps
Testconfiguratie
  • CPU Test 2020
  • Geïnt. gpu (GTX 1650 bij CPU's zonder iGPU)
  • Windows 10 1909
  • High performance energie profiel (tenzij anders aangegeven)
Staxrip - x265 (3.2.0.5) 35 fps
Testconfiguratie
  • CPU Test 2020
  • Geïnt. gpu (GTX 1650 bij CPU's zonder iGPU)
  • Windows 10 1909
  • High performance energie profiel (tenzij anders aangegeven)
Flac - 1 uur WAV naar Flac 284 sec.
Testconfiguratie
  • CPU Test 2020
  • Geïnt. gpu (GTX 1650 bij CPU's zonder iGPU)
  • Windows 10 1909
  • High performance energie profiel (tenzij anders aangegeven)
Microsoft Word 2019 - 1000 Pagina's naar PDF 81 sec.
Testconfiguratie
  • CPU Test 2020
  • Geïnt. gpu (GTX 1650 bij CPU's zonder iGPU)
  • Windows 10 1909
  • High performance energie profiel (tenzij anders aangegeven)
Microsoft Excel 2019 - Monte Carlo 3,601 sec.
Testconfiguratie
  • CPU Test 2020
  • Geïnt. gpu (GTX 1650 bij CPU's zonder iGPU)
  • Windows 10 1909
  • High performance energie profiel (tenzij anders aangegeven)
7-Zip v19.00 - 4GB inpakken 213 sec.
Testconfiguratie
  • CPU Test 2020
  • Geïnt. gpu (GTX 1650 bij CPU's zonder iGPU)
  • Windows 10 1909
  • High performance energie profiel (tenzij anders aangegeven)
Chrome 79 - Jetstream 2 110,718
Testconfiguratie
  • CPU Test 2020
  • Geïnt. gpu (GTX 1650 bij CPU's zonder iGPU)
  • Windows 10 1909
  • High performance energie profiel (tenzij anders aangegeven)
AIDA64 (6.20.5300) - Zlib 517 MB/s
Testconfiguratie
  • CPU Test 2020
  • Geïnt. gpu (GTX 1650 bij CPU's zonder iGPU)
  • Windows 10 1909
  • High performance energie profiel (tenzij anders aangegeven)
AIDA64 (6.20.5300) - AES 49.331 MB/s
Testconfiguratie
  • CPU Test 2020
  • Geïnt. gpu (GTX 1650 bij CPU's zonder iGPU)
  • Windows 10 1909
  • High performance energie profiel (tenzij anders aangegeven)
AIDA64 (6.20.5300) - SHA3 1.578 MB/s
Testconfiguratie
  • CPU Test 2020
  • Geïnt. gpu (GTX 1650 bij CPU's zonder iGPU)
  • Windows 10 1909
  • High performance energie profiel (tenzij anders aangegeven)
AIDA64 (6.20.5300) - Hash 16.739 MB/s
Testconfiguratie
  • CPU Test 2020
  • Geïnt. gpu (GTX 1650 bij CPU's zonder iGPU)
  • Windows 10 1909
  • High performance energie profiel (tenzij anders aangegeven)
AIDA64 (6.20.5300) - Julia 28.865
Testconfiguratie
  • CPU Test 2020
  • Geïnt. gpu (GTX 1650 bij CPU's zonder iGPU)
  • Windows 10 1909
  • High performance energie profiel (tenzij anders aangegeven)
AIDA64 (6.20.5300) - Mandel 15.035
Testconfiguratie
  • CPU Test 2020
  • Geïnt. gpu (GTX 1650 bij CPU's zonder iGPU)
  • Windows 10 1909
  • High performance energie profiel (tenzij anders aangegeven)
AIDA64 (6.20.5300) - FP32 Raytrace 5.891 KRay/s
Testconfiguratie
  • CPU Test 2020
  • Geïnt. gpu (GTX 1650 bij CPU's zonder iGPU)
  • Windows 10 1909
  • High performance energie profiel (tenzij anders aangegeven)
AIDA64 (6.20.5300) - FP64 Raytrace 2.969 KRay/s
Testconfiguratie
  • CPU Test 2020
  • Geïnt. gpu (GTX 1650 bij CPU's zonder iGPU)
  • Windows 10 1909
  • High performance energie profiel (tenzij anders aangegeven)
Systeemverbruik Cinebench 20 126 W
Testconfiguratie
  • CPU Test 2020
  • Geïnt. gpu (GTX 1650 bij CPU's zonder iGPU)
  • Windows 10 1909
  • High performance energie profiel (tenzij anders aangegeven)

Testresultaten 2020 (Win 10 1909) - RTX 2080 Ti

Battlefield V (DX12) - 1920x1080 - Medium 124,5 fps
Testconfiguratie
  • CPU Test 2020
  • Icm. RTX 2080 Ti
  • Windows 10 1909
  • High performance energie profiel
Battlefield V (DX12) - 1920x1080 - Ultra 114,2 fps
Testconfiguratie
  • CPU Test 2020
  • Icm. RTX 2080 Ti
  • Windows 10 1909
  • High performance energie profiel
Dirt Rally 2.0 - 1920x1080 - Medium 216,6 fps
Testconfiguratie
  • CPU Test 2020
  • Icm. RTX 2080 Ti
  • Windows 10 1909
  • High performance energie profiel
Dirt Rally 2.0 - 1920x1080 - Ultra 146,5 fps
Testconfiguratie
  • CPU Test 2020
  • Icm. RTX 2080 Ti
  • Windows 10 1909
  • High performance energie profiel
GTA V - 1920x1080 - Medium 108,9 fps
Testconfiguratie
  • CPU Test 2020
  • Icm. RTX 2080 Ti
  • Windows 10 1909
  • High performance energie profiel
GTA V - 1920x1080 - Ultra 80,9 fps
Testconfiguratie
  • CPU Test 2020
  • Icm. RTX 2080 Ti
  • Windows 10 1909
  • High performance energie profiel
The Division 2 (DX12) - 1920x1080 - Medium 140,9 fps
Testconfiguratie
  • CPU Test 2020
  • Icm. RTX 2080 Ti
  • Windows 10 1909
  • High performance energie profiel
The Division 2 (DX12) - 1920x1080 - Ultra 122,4 fps
Testconfiguratie
  • CPU Test 2020
  • Icm. RTX 2080 Ti
  • Windows 10 1909
  • High performance energie profiel
Total War: Three Kingdoms - 1920x1080 - Medium 123,4 fps
Testconfiguratie
  • CPU Test 2020
  • Icm. RTX 2080 Ti
  • Windows 10 1909
  • High performance energie profiel
Total War: Three Kingdoms - 1920x1080 - Ultra 84,6 fps
Testconfiguratie
  • CPU Test 2020
  • Icm. RTX 2080 Ti
  • Windows 10 1909
  • High performance energie profiel
Factorio (0.17.79) 10K SPM Base (Headless) - 10.000 ticks 88 UPS
Testconfiguratie
  • CPU Test 2020
  • Icm. RTX 2080 Ti
  • Windows 10 1909
  • High performance energie profiel
Streaming (x264 6Mbit + F1 2019) - gem. over 3 runs 95,6 fps
Testconfiguratie
  • CPU Test 2020
  • Icm. RTX 2080 Ti
  • Windows 10 1909
  • High performance energie profiel
Hardware Info CPU Gaming Prestatiescore 2020 122,8
Testconfiguratie
  • CPU Test 2020
  • Icm. RTX 2080 Ti
  • Windows 10 1909
  • High performance energie profiel

Testresultaten 2020 (Win 10 1909) - RTX 2080 Ti - Frametimes

Battlefield V (DX12) - 1920x1080 - Medium (99p) 12,71 ms
Testconfiguratie
  • CPU Test 2020
  • Icm. RTX 2080 Ti
  • Windows 10 1909
  • High performance energie profiel
Battlefield V (DX12) - 1920x1080 - Ultra (99p) 13,48 ms
Testconfiguratie
  • CPU Test 2020
  • Icm. RTX 2080 Ti
  • Windows 10 1909
  • High performance energie profiel
GTA V - 1920x1080 - Medium (99p) 15 ms
Testconfiguratie
  • CPU Test 2020
  • Icm. RTX 2080 Ti
  • Windows 10 1909
  • High performance energie profiel
GTA V - 1920x1080 - Ultra (99p) 18 ms
Testconfiguratie
  • CPU Test 2020
  • Icm. RTX 2080 Ti
  • Windows 10 1909
  • High performance energie profiel
The Division 2 (DX12) - 1920x1080 - Medium (99p) 10,94 ms
Testconfiguratie
  • CPU Test 2020
  • Icm. RTX 2080 Ti
  • Windows 10 1909
  • High performance energie profiel
The Division 2 (DX12) - 1920x1080 - Ultra (99p) 12,85 ms
Testconfiguratie
  • CPU Test 2020
  • Icm. RTX 2080 Ti
  • Windows 10 1909
  • High performance energie profiel
Total War: Three Kingdoms - 1920x1080 - Medium (99p) 12,1 ms
Testconfiguratie
  • CPU Test 2020
  • Icm. RTX 2080 Ti
  • Windows 10 1909
  • High performance energie profiel
Total War: Three Kingdoms - 1920x1080 - Ultra (99p) 19,4 ms
Testconfiguratie
  • CPU Test 2020
  • Icm. RTX 2080 Ti
  • Windows 10 1909
  • High performance energie profiel

Stroomverbruik 2020 (Enkel CPU)

Stroomverbruik idle - Minimaal 6,23 W
Testconfiguratie
  • Stroomverbruik processors (enkel CPU) (2020)
Stroomverbruik idle - Gemiddelde 5 min. 7,68 W
Testconfiguratie
  • Stroomverbruik processors (enkel CPU) (2020)
Stroomverbruik - Cinebench 20 - Gemiddeld 73,9 W
Testconfiguratie
  • Stroomverbruik processors (enkel CPU) (2020)
Stroomverbruik - Cinebench 20 - Totaal (Wh) 2,32 Wh
Testconfiguratie
  • Stroomverbruik processors (enkel CPU) (2020)
Stroomverbruik - Cinebench 20 - Maximaal 77,45 W
Testconfiguratie
  • Stroomverbruik processors (enkel CPU) (2020)
Adobe Premiere Pro 14 - Verbruik - Gemiddeld 63,6 W
Testconfiguratie
  • Stroomverbruik processors (enkel CPU) (2020)
Adobe Premiere Pro 14 - Verbruik - Totaal (Wh) 20,27 Wh
Testconfiguratie
  • Stroomverbruik processors (enkel CPU) (2020)

Testresultaten 2018 (Windows 10) - Geïnt. GPU of GTX 1050 Ti

Cinebench 10 (Multi-CPU, 32-bit) 29.070
Testconfiguratie
  • CPU Test 2018
  • Geïnt. videokaart (GTX 1050 Ti bij CPU's zonder iGPU)
  • Windows 10
  • High performance energie profiel (tenzij anders aangegeven)
Cinebench 15 Single Threaded 162
Testconfiguratie
  • CPU Test 2018
  • Geïnt. videokaart (GTX 1050 Ti bij CPU's zonder iGPU)
  • Windows 10
  • High performance energie profiel (tenzij anders aangegeven)
Cinebench 15 Multi Threaded 1.260
Testconfiguratie
  • CPU Test 2018
  • Geïnt. videokaart (GTX 1050 Ti bij CPU's zonder iGPU)
  • Windows 10
  • High performance energie profiel (tenzij anders aangegeven)
Cinebench 20 Single Threaded 401
Testconfiguratie
  • CPU Test 2018
  • Geïnt. videokaart (GTX 1050 Ti bij CPU's zonder iGPU)
  • Windows 10
  • High performance energie profiel (tenzij anders aangegeven)
Cinebench 20 Multi Threaded 2.837
Testconfiguratie
  • CPU Test 2018
  • Geïnt. videokaart (GTX 1050 Ti bij CPU's zonder iGPU)
  • Windows 10
  • High performance energie profiel (tenzij anders aangegeven)
Blender 2.79b 94,2 sec.
Testconfiguratie
  • CPU Test 2018
  • Geïnt. videokaart (GTX 1050 Ti bij CPU's zonder iGPU)
  • Windows 10
  • High performance energie profiel (tenzij anders aangegeven)
AIDA64 (5.97) - Zlib 522,4 MB/s
Testconfiguratie
  • CPU Test 2018
  • Geïnt. videokaart (GTX 1050 Ti bij CPU's zonder iGPU)
  • Windows 10
  • High performance energie profiel (tenzij anders aangegeven)
AIDA64 (5.97) - AES 48.912 MB/s
Testconfiguratie
  • CPU Test 2018
  • Geïnt. videokaart (GTX 1050 Ti bij CPU's zonder iGPU)
  • Windows 10
  • High performance energie profiel (tenzij anders aangegeven)
AIDA64 (5.97) - Hash 16.610 MB/s
Testconfiguratie
  • CPU Test 2018
  • Geïnt. videokaart (GTX 1050 Ti bij CPU's zonder iGPU)
  • Windows 10
  • High performance energie profiel (tenzij anders aangegeven)
AIDA64 (5.97) - Julia 28.478
Testconfiguratie
  • CPU Test 2018
  • Geïnt. videokaart (GTX 1050 Ti bij CPU's zonder iGPU)
  • Windows 10
  • High performance energie profiel (tenzij anders aangegeven)
AIDA64 (5.97) - Mandel 14.894
Testconfiguratie
  • CPU Test 2018
  • Geïnt. videokaart (GTX 1050 Ti bij CPU's zonder iGPU)
  • Windows 10
  • High performance energie profiel (tenzij anders aangegeven)
Geekbench 4.2.3 - CPU Single-Core 4.528
Testconfiguratie
  • CPU Test 2018
  • Geïnt. videokaart (GTX 1050 Ti bij CPU's zonder iGPU)
  • Windows 10
  • High performance energie profiel (tenzij anders aangegeven)
Geekbench 4.2.3 - CPU Multi-Core 21.585
Testconfiguratie
  • CPU Test 2018
  • Geïnt. videokaart (GTX 1050 Ti bij CPU's zonder iGPU)
  • Windows 10
  • High performance energie profiel (tenzij anders aangegeven)
Geekbench 4.2.3 - CPU Single-Core - Crypto 5.804
Testconfiguratie
  • CPU Test 2018
  • Geïnt. videokaart (GTX 1050 Ti bij CPU's zonder iGPU)
  • Windows 10
  • High performance energie profiel (tenzij anders aangegeven)
Geekbench 4.2.3 - CPU Single-Core - Integer 4.063
Testconfiguratie
  • CPU Test 2018
  • Geïnt. videokaart (GTX 1050 Ti bij CPU's zonder iGPU)
  • Windows 10
  • High performance energie profiel (tenzij anders aangegeven)
Geekbench 4.2.3 - CPU Single-Core - Floating Point 4.202
Testconfiguratie
  • CPU Test 2018
  • Geïnt. videokaart (GTX 1050 Ti bij CPU's zonder iGPU)
  • Windows 10
  • High performance energie profiel (tenzij anders aangegeven)
Adobe Lightroom CC - Export 62,8 sec.
Testconfiguratie
  • CPU Test 2018
  • Geïnt. videokaart (GTX 1050 Ti bij CPU's zonder iGPU)
  • Windows 10
  • High performance energie profiel (tenzij anders aangegeven)
Adobe Photoshop CC - Panorama 40,3 sec.
Testconfiguratie
  • CPU Test 2018
  • Geïnt. videokaart (GTX 1050 Ti bij CPU's zonder iGPU)
  • Windows 10
  • High performance energie profiel (tenzij anders aangegeven)
Adobe Photoshop CC - Fotobewerking 90,6 sec.
Testconfiguratie
  • CPU Test 2018
  • Geïnt. videokaart (GTX 1050 Ti bij CPU's zonder iGPU)
  • Windows 10
  • High performance energie profiel (tenzij anders aangegeven)
Adobe Premiere Pro CC - 4K HWI TV 1.079 sec.
Testconfiguratie
  • CPU Test 2018
  • Geïnt. videokaart (GTX 1050 Ti bij CPU's zonder iGPU)
  • Windows 10
  • High performance energie profiel (tenzij anders aangegeven)
Staxrip - x264 (r2901) 88,86 fps
Testconfiguratie
  • CPU Test 2018
  • Geïnt. videokaart (GTX 1050 Ti bij CPU's zonder iGPU)
  • Windows 10
  • High performance energie profiel (tenzij anders aangegeven)
Staxrip - x265 (2.8.24) 30,55 fps
Testconfiguratie
  • CPU Test 2018
  • Geïnt. videokaart (GTX 1050 Ti bij CPU's zonder iGPU)
  • Windows 10
  • High performance energie profiel (tenzij anders aangegeven)
Flac - 1 uur WAV naar Flac 240 sec.
Testconfiguratie
  • CPU Test 2018
  • Geïnt. videokaart (GTX 1050 Ti bij CPU's zonder iGPU)
  • Windows 10
  • High performance energie profiel (tenzij anders aangegeven)
Microsoft Word 2016 - 1000 pagina's naar PDF 60,8 sec.
Testconfiguratie
  • CPU Test 2018
  • Geïnt. videokaart (GTX 1050 Ti bij CPU's zonder iGPU)
  • Windows 10
  • High performance energie profiel (tenzij anders aangegeven)
Microsoft Excel 2016 - Monte Carlo 10 sec.
Testconfiguratie
  • CPU Test 2018
  • Geïnt. videokaart (GTX 1050 Ti bij CPU's zonder iGPU)
  • Windows 10
  • High performance energie profiel (tenzij anders aangegeven)
Winrar 5.60 - 4GB inpakken 338 sec.
Testconfiguratie
  • CPU Test 2018
  • Geïnt. videokaart (GTX 1050 Ti bij CPU's zonder iGPU)
  • Windows 10
  • High performance energie profiel (tenzij anders aangegeven)
7-Zip v18.05 - 4GB inpakken 217 sec.
Testconfiguratie
  • CPU Test 2018
  • Geïnt. videokaart (GTX 1050 Ti bij CPU's zonder iGPU)
  • Windows 10
  • High performance energie profiel (tenzij anders aangegeven)
Chrome 67 - Jetstream 179,04
Testconfiguratie
  • CPU Test 2018
  • Geïnt. videokaart (GTX 1050 Ti bij CPU's zonder iGPU)
  • Windows 10
  • High performance energie profiel (tenzij anders aangegeven)
Chrome 75 - Jetstream 2 110,314
Testconfiguratie
  • CPU Test 2018
  • Geïnt. videokaart (GTX 1050 Ti bij CPU's zonder iGPU)
  • Windows 10
  • High performance energie profiel (tenzij anders aangegeven)
Systeemverbruik - Cinebench 15 - Max 122 W
Testconfiguratie
  • CPU Test 2018
  • Geïnt. videokaart (GTX 1050 Ti bij CPU's zonder iGPU)
  • Windows 10
  • High performance energie profiel (tenzij anders aangegeven)

Testresultaten 2018 (Windows 10) - GTX 1080 Ti

Far Cry 5 – 1920x1080 – Medium 110 fps
Testconfiguratie
  • CPU Test 2018
  • Icm. GeForce GTX 1080 Ti
  • Windows 10
  • High performance energie profiel
Far Cry 5 – 1920x1080 – Ultra 99 fps
Testconfiguratie
  • CPU Test 2018
  • Icm. GeForce GTX 1080 Ti
  • Windows 10
  • High performance energie profiel
Assassin’s Creed: Origins – 1920x1080 – Medium 91 fps
Testconfiguratie
  • CPU Test 2018
  • Icm. GeForce GTX 1080 Ti
  • Windows 10
  • High performance energie profiel
Assassin’s Creed: Origins – 1920x1080 – Ultra 78 fps
Testconfiguratie
  • CPU Test 2018
  • Icm. GeForce GTX 1080 Ti
  • Windows 10
  • High performance energie profiel
The Witcher 3: Blood & Wine - 1920x1080 - Medium 196,1 fps
Testconfiguratie
  • CPU Test 2018
  • Icm. GeForce GTX 1080 Ti
  • Windows 10
  • High performance energie profiel
The Witcher 3: Blood & Wine - 1920x1080 - Ultra 108 fps
Testconfiguratie
  • CPU Test 2018
  • Icm. GeForce GTX 1080 Ti
  • Windows 10
  • High performance energie profiel
GTA V - 1920x1080 – Medium 105 fps
Testconfiguratie
  • CPU Test 2018
  • Icm. GeForce GTX 1080 Ti
  • Windows 10
  • High performance energie profiel
GTA V - 1920x1080 - Ultra (2x MSAA, 2x Refl. MSAA) 79,9 fps
Testconfiguratie
  • CPU Test 2018
  • Icm. GeForce GTX 1080 Ti
  • Windows 10
  • High performance energie profiel
Battlefield 1 (DX11) - 1920x1080 – Medium 156 fps
Testconfiguratie
  • CPU Test 2018
  • Icm. GeForce GTX 1080 Ti
  • Windows 10
  • High performance energie profiel
Battlefield 1 (DX11) - 1920x1080 – Ultra 137,1 fps
Testconfiguratie
  • CPU Test 2018
  • Icm. GeForce GTX 1080 Ti
  • Windows 10
  • High performance energie profiel
Rise of the Tombraider (DX12) - 1920x1080 - Medium 158,6 fps
Testconfiguratie
  • CPU Test 2018
  • Icm. GeForce GTX 1080 Ti
  • Windows 10
  • High performance energie profiel
Rise of the Tombraider (DX12) - 1920x1080 - Ultra 118,1 fps
Testconfiguratie
  • CPU Test 2018
  • Icm. GeForce GTX 1080 Ti
  • Windows 10
  • High performance energie profiel
The Division (DX12) - 1920x1080 - Medium 187,9 fps
Testconfiguratie
  • CPU Test 2018
  • Icm. GeForce GTX 1080 Ti
  • Windows 10
  • High performance energie profiel
The Division (DX12) - 1920x1080 - Ultra 126,1 fps
Testconfiguratie
  • CPU Test 2018
  • Icm. GeForce GTX 1080 Ti
  • Windows 10
  • High performance energie profiel

Testresultaten 2018 (Windows 10) - GTX 1080 Ti - Frametimes

The Witcher 3: Blood & Wine - 1920x1080 - Medium (99p) 7,7 ms
Testconfiguratie
  • CPU Test 2018
  • Icm. GeForce GTX 1080 Ti
  • Windows 10
  • High performance energie profiel
The Witcher 3: Blood & Wine - 1920x1080 - Ultra (99p) 18,8 ms
Testconfiguratie
  • CPU Test 2018
  • Icm. GeForce GTX 1080 Ti
  • Windows 10
  • High performance energie profiel
GTA V - 1920x1080 - Medium (99p) 16 ms
Testconfiguratie
  • CPU Test 2018
  • Icm. GeForce GTX 1080 Ti
  • Windows 10
  • High performance energie profiel
GTA V - 1920x1080 - Ultra (2x MSAA, 2xRefl. MSAA) (99p) 18 ms
Testconfiguratie
  • CPU Test 2018
  • Icm. GeForce GTX 1080 Ti
  • Windows 10
  • High performance energie profiel
Battlefield 1 (DX11) - 1920x1080 - Medium (99p) 10,9 ms
Testconfiguratie
  • CPU Test 2018
  • Icm. GeForce GTX 1080 Ti
  • Windows 10
  • High performance energie profiel
Battlefield 1 (DX11) - 1920x1080 - Ultra (99p) 12,8 ms
Testconfiguratie
  • CPU Test 2018
  • Icm. GeForce GTX 1080 Ti
  • Windows 10
  • High performance energie profiel
Rise of the Tombraider (DX12) - 1920x1080 - Medium (99p) 10,1 ms
Testconfiguratie
  • CPU Test 2018
  • Icm. GeForce GTX 1080 Ti
  • Windows 10
  • High performance energie profiel
Rise of the Tombraider (DX12) - 1920x1080 - Ultra (99p) 14,1 ms
Testconfiguratie
  • CPU Test 2018
  • Icm. GeForce GTX 1080 Ti
  • Windows 10
  • High performance energie profiel

Stroomverbruik 2019 (Enkel CPU)

Stroomverbruik idle - Minimaal 4,15 W
Testconfiguratie
  • Stroomverbruik processors (enkel CPU) (2019)
Stroomverbruik idle - Gemiddelde 5 min. 5,52 W
Testconfiguratie
  • Stroomverbruik processors (enkel CPU) (2019)
Stroomverbruik - Cinebench 15 - Gemiddeld 69,9 W
Testconfiguratie
  • Stroomverbruik processors (enkel CPU) (2019)
Stroomverbruik - Cinebench 15 - Maximaal 76,48 W
Testconfiguratie
  • Stroomverbruik processors (enkel CPU) (2019)
Adobe Premiere Pro - Verbruik - Gemiddeld 58,1 W
Testconfiguratie
  • Stroomverbruik processors (enkel CPU) (2019)
Adobe Premiere Pro - Verbruik - Totaal (Wh) 11,64 Wh
Testconfiguratie
  • Stroomverbruik processors (enkel CPU) (2019)

Testresultaten 2017 (Windows 10) - Geïnt. GPU of GTX 1050 Ti

Cinebench 10 (Multi-CPU, 32-bit) 28.390
Testconfiguratie
  • CPU Test 2017
  • Geïnt. videokaart (GTX 1050 Ti bij CPU's zonder iGPU)
  • Windows 10
  • High performance energie profiel (tenzij anders aangegeven)
Cinebench 15 Single Threaded 162
Testconfiguratie
  • CPU Test 2017
  • Geïnt. videokaart (GTX 1050 Ti bij CPU's zonder iGPU)
  • Windows 10
  • High performance energie profiel (tenzij anders aangegeven)
Cinebench 15 Multi Threaded 1.265
Testconfiguratie
  • CPU Test 2017
  • Geïnt. videokaart (GTX 1050 Ti bij CPU's zonder iGPU)
  • Windows 10
  • High performance energie profiel (tenzij anders aangegeven)
Cinebench 15 multi-core schaling 130,1 %
Testconfiguratie
  • CPU Test 2017
  • Geïnt. videokaart (GTX 1050 Ti bij CPU's zonder iGPU)
  • Windows 10
  • High performance energie profiel (tenzij anders aangegeven)
Blender 2.78c 97,3 sec.
Testconfiguratie
  • CPU Test 2017
  • Geïnt. videokaart (GTX 1050 Ti bij CPU's zonder iGPU)
  • Windows 10
  • High performance energie profiel (tenzij anders aangegeven)
AIDA64 (5.90.4247) - Zlib 525,1 MB/s
Testconfiguratie
  • CPU Test 2017
  • Geïnt. videokaart (GTX 1050 Ti bij CPU's zonder iGPU)
  • Windows 10
  • High performance energie profiel (tenzij anders aangegeven)
AIDA64 (5.90.4247) - AES 48.513 MB/s
Testconfiguratie
  • CPU Test 2017
  • Geïnt. videokaart (GTX 1050 Ti bij CPU's zonder iGPU)
  • Windows 10
  • High performance energie profiel (tenzij anders aangegeven)
AIDA64 (5.90.4247) - Hash 17.209 MB/s
Testconfiguratie
  • CPU Test 2017
  • Geïnt. videokaart (GTX 1050 Ti bij CPU's zonder iGPU)
  • Windows 10
  • High performance energie profiel (tenzij anders aangegeven)
AIDA64 (5.90.4247) - VP8 7.077
Testconfiguratie
  • CPU Test 2017
  • Geïnt. videokaart (GTX 1050 Ti bij CPU's zonder iGPU)
  • Windows 10
  • High performance energie profiel (tenzij anders aangegeven)
AIDA64 (5.90.4247) - Julia 27.748
Testconfiguratie
  • CPU Test 2017
  • Geïnt. videokaart (GTX 1050 Ti bij CPU's zonder iGPU)
  • Windows 10
  • High performance energie profiel (tenzij anders aangegeven)
AIDA64 (5.90.4247) - Mandel 14.433
Testconfiguratie
  • CPU Test 2017
  • Geïnt. videokaart (GTX 1050 Ti bij CPU's zonder iGPU)
  • Windows 10
  • High performance energie profiel (tenzij anders aangegeven)
PCMark 8 - Home 4.355
Testconfiguratie
  • CPU Test 2017
  • Geïnt. videokaart (GTX 1050 Ti bij CPU's zonder iGPU)
  • Windows 10
  • High performance energie profiel (tenzij anders aangegeven)
PCMark 8 - Creativity 4.907
Testconfiguratie
  • CPU Test 2017
  • Geïnt. videokaart (GTX 1050 Ti bij CPU's zonder iGPU)
  • Windows 10
  • High performance energie profiel (tenzij anders aangegeven)
PCMark 8 - Work 3.510
Testconfiguratie
  • CPU Test 2017
  • Geïnt. videokaart (GTX 1050 Ti bij CPU's zonder iGPU)
  • Windows 10
  • High performance energie profiel (tenzij anders aangegeven)
Adobe Lightroom 6 - Export 31,9 sec.
Testconfiguratie
  • CPU Test 2017
  • Geïnt. videokaart (GTX 1050 Ti bij CPU's zonder iGPU)
  • Windows 10
  • High performance energie profiel (tenzij anders aangegeven)
Adobe Photoshop CC 2017 - Panorama 41,6 sec.
Testconfiguratie
  • CPU Test 2017
  • Geïnt. videokaart (GTX 1050 Ti bij CPU's zonder iGPU)
  • Windows 10
  • High performance energie profiel (tenzij anders aangegeven)
Adobe Photoshop CC 2017 - Fotobewerking 95,8 sec.
Testconfiguratie
  • CPU Test 2017
  • Geïnt. videokaart (GTX 1050 Ti bij CPU's zonder iGPU)
  • Windows 10
  • High performance energie profiel (tenzij anders aangegeven)
Adobe Premiere Pro 2017 - 4K HWI TV 183,8 sec.
Testconfiguratie
  • CPU Test 2017
  • Geïnt. videokaart (GTX 1050 Ti bij CPU's zonder iGPU)
  • Windows 10
  • High performance energie profiel (tenzij anders aangegeven)
Staxrip - x264 82,7 fps
Testconfiguratie
  • CPU Test 2017
  • Geïnt. videokaart (GTX 1050 Ti bij CPU's zonder iGPU)
  • Windows 10
  • High performance energie profiel (tenzij anders aangegeven)
Staxrip - x265 31,2 fps
Testconfiguratie
  • CPU Test 2017
  • Geïnt. videokaart (GTX 1050 Ti bij CPU's zonder iGPU)
  • Windows 10
  • High performance energie profiel (tenzij anders aangegeven)
Flac - 1 uur WAV naar Flac 242 sec.
Testconfiguratie
  • CPU Test 2017
  • Geïnt. videokaart (GTX 1050 Ti bij CPU's zonder iGPU)
  • Windows 10
  • High performance energie profiel (tenzij anders aangegeven)
Microsoft Word 2016 - 1000 pagina's naar PDF 68,8 sec.
Testconfiguratie
  • CPU Test 2017
  • Geïnt. videokaart (GTX 1050 Ti bij CPU's zonder iGPU)
  • Windows 10
  • High performance energie profiel (tenzij anders aangegeven)
Microsoft Excel 2016 - Monte Carlo 3,1 sec.
Testconfiguratie
  • CPU Test 2017
  • Geïnt. videokaart (GTX 1050 Ti bij CPU's zonder iGPU)
  • Windows 10
  • High performance energie profiel (tenzij anders aangegeven)
Winrar 5.40 - 2GB inpakken 95 sec.
Testconfiguratie
  • CPU Test 2017
  • Geïnt. videokaart (GTX 1050 Ti bij CPU's zonder iGPU)
  • Windows 10
  • High performance energie profiel (tenzij anders aangegeven)
7-Zip - 2GB inpakken 114 sec.
Testconfiguratie
  • CPU Test 2017
  • Geïnt. videokaart (GTX 1050 Ti bij CPU's zonder iGPU)
  • Windows 10
  • High performance energie profiel (tenzij anders aangegeven)
Chrome 58 - Jetstream 217,54
Testconfiguratie
  • CPU Test 2017
  • Geïnt. videokaart (GTX 1050 Ti bij CPU's zonder iGPU)
  • Windows 10
  • High performance energie profiel (tenzij anders aangegeven)
Stroomverbruik - Cinebench 15 - Max 121 W
Testconfiguratie
  • CPU Test 2017
  • Geïnt. videokaart (GTX 1050 Ti bij CPU's zonder iGPU)
  • Windows 10
  • High performance energie profiel (tenzij anders aangegeven)
Stroomverbruik idle - Gemiddelde 5 min. 40,8 W
Testconfiguratie
  • CPU Test 2017
  • Geïnt. videokaart (GTX 1050 Ti bij CPU's zonder iGPU)
  • Windows 10
  • High performance energie profiel (tenzij anders aangegeven)
Stroomverbruik idle - Gemiddelde 5 min.(Energie pr. balanced 38,4 W
Testconfiguratie
  • CPU Test 2017
  • Geïnt. videokaart (GTX 1050 Ti bij CPU's zonder iGPU)
  • Windows 10
  • High performance energie profiel (tenzij anders aangegeven)
Stroomverbruik Premiere Pro - 4K HWI TV - Verbruik 5,9 Wh
Testconfiguratie
  • CPU Test 2017
  • Geïnt. videokaart (GTX 1050 Ti bij CPU's zonder iGPU)
  • Windows 10
  • High performance energie profiel (tenzij anders aangegeven)
Stroomverbruik Premiere Pro - 4K HWI TV - Gemiddeld 115,6 W
Testconfiguratie
  • CPU Test 2017
  • Geïnt. videokaart (GTX 1050 Ti bij CPU's zonder iGPU)
  • Windows 10
  • High performance energie profiel (tenzij anders aangegeven)
Perf. / Watt - Cinebench 15 10,5 cb/W
Testconfiguratie
  • CPU Test 2017
  • Geïnt. videokaart (GTX 1050 Ti bij CPU's zonder iGPU)
  • Windows 10
  • High performance energie profiel (tenzij anders aangegeven)

Testresultaten 2017 (Windows 10) - GTX 1080 Ti

Prey - 1920x1080 - Medium 201,2 fps
Testconfiguratie
  • CPU Test 2017
  • In combinatie met GeForce GTX 1080 Ti
  • Windows 10
  • High performance energie profiel
Prey - 1920x1080 - Ultra 191,3 fps
Testconfiguratie
  • CPU Test 2017
  • In combinatie met GeForce GTX 1080 Ti
  • Windows 10
  • High performance energie profiel
GTA V - 1920x1080 - Medium 119,1 fps
Testconfiguratie
  • CPU Test 2017
  • In combinatie met GeForce GTX 1080 Ti
  • Windows 10
  • High performance energie profiel
GTA V - 1920x1080 - Ultra (2x MSAA, 0x Refl. MSAA) 60,9 fps
Testconfiguratie
  • CPU Test 2017
  • In combinatie met GeForce GTX 1080 Ti
  • Windows 10
  • High performance energie profiel
Battlefield 1 (DX12) - 1920x1080 - Medium 158,5 fps
Testconfiguratie
  • CPU Test 2017
  • In combinatie met GeForce GTX 1080 Ti
  • Windows 10
  • High performance energie profiel
Battlefield 1 (DX12) - 1920x1080 - Ultra 135,7 fps
Testconfiguratie
  • CPU Test 2017
  • In combinatie met GeForce GTX 1080 Ti
  • Windows 10
  • High performance energie profiel
Doom (Vulkan) - 1920x1080 - Medium 200 fps
Testconfiguratie
  • CPU Test 2017
  • In combinatie met GeForce GTX 1080 Ti
  • Windows 10
  • High performance energie profiel
Doom (Vulkan) - 1920x1080 - Ultra 200 fps
Testconfiguratie
  • CPU Test 2017
  • In combinatie met GeForce GTX 1080 Ti
  • Windows 10
  • High performance energie profiel
Rise of the Tombraider (DX12) - 1920x1080 - Medium 171,3 fps
Testconfiguratie
  • CPU Test 2017
  • In combinatie met GeForce GTX 1080 Ti
  • Windows 10
  • High performance energie profiel
Rise of the Tombraider (DX12) - 1920x1080 - Ultra 137,7 fps
Testconfiguratie
  • CPU Test 2017
  • In combinatie met GeForce GTX 1080 Ti
  • Windows 10
  • High performance energie profiel
The Division (DX12) - 1920x1080 - Medium 193,6 fps
Testconfiguratie
  • CPU Test 2017
  • In combinatie met GeForce GTX 1080 Ti
  • Windows 10
  • High performance energie profiel
The Division (DX12) - 1920x1080 - Ultra 133,2 fps
Testconfiguratie
  • CPU Test 2017
  • In combinatie met GeForce GTX 1080 Ti
  • Windows 10
  • High performance energie profiel
Stroomverbruik - Cinebench 15 - Max 130 W
Testconfiguratie
  • CPU Test 2017
  • In combinatie met GeForce GTX 1080 Ti
  • Windows 10
  • High performance energie profiel
Stroomverbruik idle - Gemiddelde 5 min. 43,2 W
Testconfiguratie
  • CPU Test 2017
  • In combinatie met GeForce GTX 1080 Ti
  • Windows 10
  • High performance energie profiel

Testresultaten 2017 (Windows 10) - GTX 1080 Ti - Frametimes

Prey - 1920x1080 - Medium (99p) 7,3 ms
Testconfiguratie
  • CPU Test 2017
  • In combinatie met GeForce GTX 1080 Ti
  • Windows 10
  • High performance energie profiel
Prey - 1920x1080 - Ultra (99p) 7,4 ms
Testconfiguratie
  • CPU Test 2017
  • In combinatie met GeForce GTX 1080 Ti
  • Windows 10
  • High performance energie profiel
GTA V - 1920x1080 - Medium (99p) 13 ms
Testconfiguratie
  • CPU Test 2017
  • In combinatie met GeForce GTX 1080 Ti
  • Windows 10
  • High performance energie profiel
GTA V - 1920x1080 - Ultra (2x MSAA, 0xRefl. MSAA) (99p) 24 ms
Testconfiguratie
  • CPU Test 2017
  • In combinatie met GeForce GTX 1080 Ti
  • Windows 10
  • High performance energie profiel
Battlefield 1 (DX12) - 1920x1080 - Medium (99p) 10,4 ms
Testconfiguratie
  • CPU Test 2017
  • In combinatie met GeForce GTX 1080 Ti
  • Windows 10
  • High performance energie profiel
Battlefield 1 (DX12) - 1920x1080 - Ultra (99p) 11,8 ms
Testconfiguratie
  • CPU Test 2017
  • In combinatie met GeForce GTX 1080 Ti
  • Windows 10
  • High performance energie profiel
Doom (Vulkan) - 1920x1080 - Medium (99p) 6,1 ms
Testconfiguratie
  • CPU Test 2017
  • In combinatie met GeForce GTX 1080 Ti
  • Windows 10
  • High performance energie profiel
Doom (Vulkan) - 1920x1080 - Ultra (99p) 6,6 ms
Testconfiguratie
  • CPU Test 2017
  • In combinatie met GeForce GTX 1080 Ti
  • Windows 10
  • High performance energie profiel
Prey - 1920x1080 - Medium (min. FPS 99p) 137,0 fps
Testconfiguratie
  • CPU Test 2017
  • In combinatie met GeForce GTX 1080 Ti
  • Windows 10
  • High performance energie profiel
Prey - 1920x1080 - Ultra (min. FPS 99p) 135,1 fps
Testconfiguratie
  • CPU Test 2017
  • In combinatie met GeForce GTX 1080 Ti
  • Windows 10
  • High performance energie profiel
GTA V - 1920x1080 - Medium (min. FPS 99p) 76,9 fps
Testconfiguratie
  • CPU Test 2017
  • In combinatie met GeForce GTX 1080 Ti
  • Windows 10
  • High performance energie profiel
GTA V - 1920x1080 - Ultra (2x MSAA, 0xRefl. MSAA) (min. FPS 41,7 fps
Testconfiguratie
  • CPU Test 2017
  • In combinatie met GeForce GTX 1080 Ti
  • Windows 10
  • High performance energie profiel
Battlefield 1 (DX12) - 1920x1080 - Medium (min. FPS 99p) 96,2 fps
Testconfiguratie
  • CPU Test 2017
  • In combinatie met GeForce GTX 1080 Ti
  • Windows 10
  • High performance energie profiel
Battlefield 1 (DX12) - 1920x1080 - Ultra (min. FPS 99p) 84,7 fps
Testconfiguratie
  • CPU Test 2017
  • In combinatie met GeForce GTX 1080 Ti
  • Windows 10
  • High performance energie profiel
Doom (Vulkan) - 1920x1080 - Medium (min. FPS 99p) 163,9 fps
Testconfiguratie
  • CPU Test 2017
  • In combinatie met GeForce GTX 1080 Ti
  • Windows 10
  • High performance energie profiel
Doom (Vulkan) - 1920x1080 - Ultra (min. FPS 99p) 151,5 fps
Testconfiguratie
  • CPU Test 2017
  • In combinatie met GeForce GTX 1080 Ti
  • Windows 10
  • High performance energie profiel

Stroomverbruik 2017 (Enkel CPU)

Idle - Verbruik 0,066 Ah
Testconfiguratie
  • Stroomverbruik processors (enkel CPU)
Stroomverbruik idle - Gemiddelde 5 min. 9,7 W
Testconfiguratie
  • Stroomverbruik processors (enkel CPU)
Cinebench 15 - Load - Verbruik 0,063 Ah
Testconfiguratie
  • Stroomverbruik processors (enkel CPU)
Stroomverbruik - Cinebench 15 - Gemiddeld 81,1 W
Testconfiguratie
  • Stroomverbruik processors (enkel CPU)
Adobe Premiere Pro - Verbruik 0,333 Ah
Testconfiguratie
  • Stroomverbruik processors (enkel CPU)
Stroomverbruik Premiere Pro - 4K HWI TV - Gemiddeld 78,4 W
Testconfiguratie
  • Stroomverbruik processors (enkel CPU)
Adobe Premiere Pro (2018) - Verbruik 1,293 Ah
Testconfiguratie
  • Stroomverbruik processors (enkel CPU)
Stroomverbruik Premiere Pro (2018) - 4K HWI TV - Gemiddeld 51,9 W
Testconfiguratie
  • Stroomverbruik processors (enkel CPU)

Reviews

Processors

De beste AMD-alternatieven voor peperdure Intel-processors

Wie zijn zinnen heeft gezet op de aanschaf van een Intel-processor, komt bedrogen uit. De verkrijgbaarheid van Coffee Lake CPU's is ingezakt, en de prijzen zijn omhoog geschoten. Wat zijn de beste alternatieven van AMD met Ryzen?

9 oktober 2018 14:00
Processors

AMD Ryzen 5 2600 review: de leukste Ryzen 2!

Misschien wel de interessantste CPU ontbrak vorige week nog in onze grote review van Ryzen 2. Deze betaalbare Ryzen 5 2600 haal je al voor 195 euro in huis. Is dat net zo aantrekkelijk als het klinkt?

26 april 2018 05:59

Alternatieven

AMD Ryzen 7 2700X Boxed

  • Socket AM4
  • 3.7 GHz
  • 8 cores
  • 105 W
 

AMD Ryzen 7 1800X Boxed

  • Socket AM4
  • 3.6 GHz
  • 8 cores
  • 95 W
 

AMD Ryzen 5 1600 Boxed

  • Socket AM4
  • 3.2 GHz
  • 6 cores
  • 65 W
 

AMD Ryzen 7 2700 Boxed

  • Socket AM4
  • 3.2 GHz
  • 8 cores
  • 65 W
 

AMD Ryzen 5 2600X Boxed

  • Socket AM4
  • 3.6 GHz
  • 6 cores
  • 95 W
 

Intel Core i5 8600K Boxed

  • Socket 1151
  • 3.6 GHz
  • 6 cores
  • 95 W
  • Geïntegreerde GPU
 

Intel Core i7 8700K Boxed

  • Socket 1151
  • 3.7 GHz
  • 6 cores
  • 95 W
  • Geïntegreerde GPU
 

Intel Core i9 7900X Boxed

  • Socket 2066
  • 3.3 GHz
  • 10 cores
  • 140 W
 

Intel Core i5 8400 Boxed

  • Socket 1151
  • 2.8 GHz
  • 6 cores
  • 65 W
  • Geïntegreerde GPU
 

Intel Core i3 8350K Boxed

  • Socket 1151
  • 4.0 GHz
  • 4 cores
  • 91 W
  • Geïntegreerde GPU
 

AMD Ryzen 7 1700 Boxed

  • Socket AM4
  • 3.0 GHz
  • 8 cores
  • 65 W
 

Intel Core i7 7820X Boxed

  • Socket 2066
  • 3.6 GHz
  • 8 cores
  • 140 W
 
0