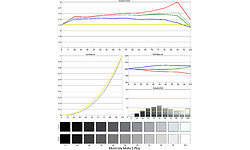
| Geekbench 3 Score - Single-Core Score |
681 |
|
|
| Geekbench 3 Score - Multi-Core Score |
3.319 |
|
|
| Geekbench 3 Integer - Single-Core Score |
846 |
|
|
| Geekbench 3 Integer - Multi-Core Score |
4.451 |
|
|
| Geekbench 3 Floating Point - Single-Core Score |
581 |
|
|
| Geekbench 3 Floating Point - Multi-Core Score |
3.464 |
|
|
| Geekbench 3 Memory - Single-Core Score |
552 |
|
|
| Geekbench 3 Memory - Multi-Core Score |
769 |
|
|
| Geekbench 4 Score - Single-Core Score |
687 |
|
|
| Geekbench 4 Score - Multi-Core Score |
2.155 |
|
|
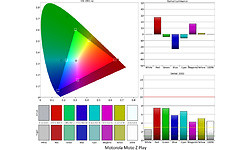
| 3DMark Ice Storm Extreme (Total Score) |
7.977 |
|
|
| 3DMark Ice Storm Extreme (Graphics Score) |
7.247 |
|
|
| 3DMark Ice Storm Extreme (Physics Score) |
12.323 |
|
|
| 3DMark Ice Storm Extreme (GT1) |
42 fps |
|
|
| 3DMark Ice Storm Extreme (GT2) |
25 fps |
|
|
| 3DMark Ice Storm Unlimited (Total Score) |
13.256 |
|
|
| 3DMark Ice Storm Unlimited (Graphics Score) |
13.245 |
|
|
| 3DMark Ice Storm Unlimited (Physics Score) |
13.293 |
|
|
| 3DMark Ice Storm Unlimited (GT1) |
80 fps |
|
|
| 3DMark Ice Storm Unlimited (GT2) |
45 fps |
|
|
| 3DMark Sling Shot(Total Score) |
838 |
|
|
| 3DMark Sling Shot (Graphics Score) |
737 |
|
|
| 3DMark Sling Shot (Physics Score) |
1.603 |
|
|
| 3DMark Sling Shot (GT1) |
6 fps |
|
|
| 3DMark Sling Shot (GT2) |
2,2 fps |
|
|
| 3DMark Sling Shot Extreme (Total Score) |
469 |
|
|
| 3DMark Sling Shot Extreme (Graphics Score) |
391 |
|
|
| 3DMark Sling Shot Extreme (Physics Score) |
1.551 |
|
|
| 3DMark Sling Shot Extreme (GT1) |
3 fps |
|
|
| 3DMark Sling Shot Extreme (GT2) |
1,2 fps |
|
|
| SunSpider 0.9.1 |
894,7 ms |
|
|
| SunSpider 1.0.2 |
884 ms |
|
|
| Google Octane |
4.868 |
|
|
| GFXBench Manhattan 3.1 |
6,7 fps |
|
|
| GFXBench Manhattan offscreen 3.1 |
6,2 fps |
|
|
| GFXBench Manhattan 3.0 |
10 fps |
|
|
| GFXBench Manhattan offscreen 3.0 |
9,8 fps |
|
|
| GFXBench T-Rex |
23 fps |
|
|
| GFXBench T-Rex offscreen |
23 fps |
|
|