| Gebruikte driver versie |
390.77 |
|
|
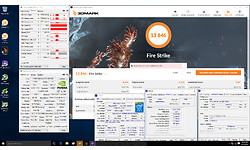
| 3DMark Firestrike |
12.070 |
|
|
| 3DMark Firestrike Graphics score |
13.336 |
|
|
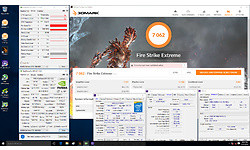
| 3DMark Firestrike Extreme |
6.220 |
|
|
| 3DMark Firestrike Ultra |
3.229 |
|
|
| 3DMark Timespy |
4.815 |
|
|
| 3DMark Timespy - Graphics score |
4.357 |
|
|
| Unigine Superposition - 1080p High - Totaalscore |
6.688 |
|
|
| Unigine Superposition - 1080p High |
50 fps |
|
|
| Unigine Superposition - 4K Optimized - Totaalscore |
5.810 |
|
|
| Unigine Superposition - 4K Optimized |
43,5 fps |
|
|
| Battlefield 1 (DX12) - 1920x1080 - Medium |
112,8 fps |
|
|
| Battlefield 1 (DX12) - 1920x1080 - Ultra |
86,4 fps |
|
|
| Battlefield 1 (DX12) - 2560x1440 - Medium |
85,7 fps |
|
|
| Battlefield 1 (DX12) - 2560x1440 - Ultra |
62,2 fps |
|
|
| Battlefield 1 (DX12) - 3840x2160 - Medium |
47,1 fps |
|
|
| Battlefield 1 (DX12) - 3840x2160 - Ultra |
34,3 fps |
|
|
| Dragon Age Inquisition - 1920x1080 - Medium |
183,8 fps |
|
|
| Dragon Age Inquisition - 1920x1080 - Ultra |
68,7 fps |
|
|
| Dragon Age Inquisition - 2560x1440 - Medium |
120,8 fps |
|
|
| Dragon Age Inquisition - 2560x1440 - Ultra |
44,1 fps |
|
|
| Dragon Age Inquisition - 3840x2160 - Medium |
59,6 fps |
|
|
| Dragon Age Inquisition - 3840x2160 - Ultra |
22,3 fps |
|
|
| Ghost Recon: Wildlands - 1920x1080 - Medium |
81,4 fps |
|
|
| Ghost Recon: Wildlands - 1920x1080 - Ultra |
41,8 fps |
|
|
| Ghost Recon: Wildlands - 2560x1440 - Medium |
57,9 fps |
|
|
| Ghost Recon: Wildlands - 2560x1440 - Ultra |
31,6 fps |
|
|
| Ghost Recon: Wildlands - 3840x2160 - Medium |
31,7 fps |
|
|
| Ghost Recon: Wildlands - 3840x2160 - Ultra |
18 fps |
|
|
| GTA V - 1920x1080 - Medium |
148,7 fps |
|
|
| GTA V - 1920x1080 - Ultra (2x MSAA) |
101,2 fps |
|
|
| GTA V - 2560x1440 - Medium |
148,5 fps |
|
|
| GTA V - 2560x1440 - Ultra (2x MSAA) |
74,5 fps |
|
|
| GTA V - 3840x2160 - Medium |
118,1 fps |
|
|
| GTA V - 3840x2160 - Ultra (2x MSAA) |
36,2 fps |
|
|
| Prey - 1920x1080 - Medium |
151,6 fps |
|
|
| Prey - 1920x1080 - Ultra |
118 fps |
|
|
| Prey - 2560x1440 - Medium |
194,5 fps |
|
|
| Prey - 2560x1440 - Ultra |
71 fps |
|
|
| Prey - 3840x2160 - Medium |
45,3 fps |
|
|
| Prey - 3840x2160 - Ultra |
32,6 fps |
|
|
| Rise of the Tombraider (DX12) - 1920x1080 - Medium |
113,1 fps |
|
|
| Rise of the Tombraider (DX12) - 1920x1080 - Ultra |
71,1 fps |
|
|
| Rise of the Tombraider (DX12) - 2560x1440 - Medium |
72,6 fps |
|
|
| Rise of the Tombraider (DX12) - 2560x1440 - Ultra |
46,8 fps |
|
|
| Rise of the Tombraider (DX12) - 3840x2160 - Medium |
35,7 fps |
|
|
| Rise of the Tombraider (DX12) - 3840x2160 - Ultra |
24 fps |
|
|
| The Division (DX12) - 1920x1080 - Medium |
104,6 fps |
|
|
| The Division (DX12) - 1920x1080 - Ultra |
64,6 fps |
|
|
| The Division (DX12) - 2560x1440 - Medium |
65,5 fps |
|
|
| The Division (DX12) - 2560x1440 - Ultra |
44,8 fps |
|
|
| The Division (DX12) - 3840x2160 - Medium |
32,2 fps |
|
|
| The Division (DX12) - 3840x2160 - Ultra |
23,9 fps |
|
|