Prijsverloop

Dit product is niet (meer) verkrijgbaar bij de bij Hardware Info aangesloten shops.

Specificaties

Belangrijkste specificaties

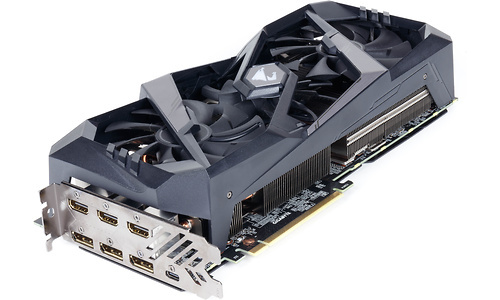
GPU Nvidia GeForce RTX 2070
Klokfrequentie turbo 1.815 MHz
Geheugengrootte 8.192 MB

Chip

GPU Nvidia GeForce RTX 2070
GPU serie Nvidia GeForce RTX-20
GPU fabrikant Nvidia
Klokfrequentie GPU 1.410 MHz
Klokfrequentie turbo 1.815 MHz
Aantal rekenkernen 2.304

Geheugen

Geheugengrootte 8.192 MB
Geheugensnelheid 1.750 MHz
Geheugentype GDDR6
Geheugenkoeling
Geheugenchips (merk) Micron

Functionaliteit

DirectX versie DirectX 12
OpenGL versie 4
Nvidia SLI/NVLink-compatible
AMD Crossfire-compatible

Kaartontwerp

Interface PCI-Express 3.0 x16
GPU koeling Actief
PEG stroomaansluiting
Type power connector(s) PEG6+PEG8
Aantal slots 3
Lengte 29,2 cm
Breedte 12 cm
Hoogte 6 cm
Low profile

Aansluitingen

D-Sub uitgang
DVI uitgang
Aantal DVI uitgangen 0
HDMI uitgang
HDMI-versie 2.0b
Aantal HDMI uitgangen 3
DisplayPort uitgang
DisplayPort-versie 1.4
Aantal DisplayPort uitgangen 3
Interne HDMI aansluitingen 0
USB-C uitgang
VirtualLink USB-C

Meegeleverd

DVI -> D-Sub plug
DVI -> HDMI plug
HDMI -> DVI plug
Afstandsbediening
DVD software drivers & utilities

Productcodes

SKU GV-N2070AORUS X-8GC
EAN 4719331303747
Toegevoegd aan Hardware Info dinsdag 16 oktober 2018

Testresultaten

Dit product is door Hardware Info getest op donderdag 27 december 2018.

Benchmarks 2018 (Win 10 Pro x64, Intel Core i9 7900X @ 4.5GHz)

Gebruikte driver versie 417.35
Testconfiguratie
  • Intel Core i9 7900X @ 4.5GHz, 32GB DDR4
  • 3200C14, Asus Strix X299
  • E Gaming, 2x Samsung 840 Evo 1TB, Windows 10 Pro x64
3DMark Firestrike 20.396
Testconfiguratie
  • Intel Core i9 7900X @ 4.5GHz, 32GB DDR4
  • 3200C14, Asus Strix X299
  • E Gaming, 2x Samsung 840 Evo 1TB, Windows 10 Pro x64
3DMark Firestrike Graphics score 23.421
Testconfiguratie
  • Intel Core i9 7900X @ 4.5GHz, 32GB DDR4
  • 3200C14, Asus Strix X299
  • E Gaming, 2x Samsung 840 Evo 1TB, Windows 10 Pro x64
3DMark Firestrike Extreme 10.933
Testconfiguratie
  • Intel Core i9 7900X @ 4.5GHz, 32GB DDR4
  • 3200C14, Asus Strix X299
  • E Gaming, 2x Samsung 840 Evo 1TB, Windows 10 Pro x64
3DMark Firestrike Ultra 5.714
Testconfiguratie
  • Intel Core i9 7900X @ 4.5GHz, 32GB DDR4
  • 3200C14, Asus Strix X299
  • E Gaming, 2x Samsung 840 Evo 1TB, Windows 10 Pro x64
3DMark Timespy 9.649
Testconfiguratie
  • Intel Core i9 7900X @ 4.5GHz, 32GB DDR4
  • 3200C14, Asus Strix X299
  • E Gaming, 2x Samsung 840 Evo 1TB, Windows 10 Pro x64
3DMark Timespy - Graphics score 9.339
Testconfiguratie
  • Intel Core i9 7900X @ 4.5GHz, 32GB DDR4
  • 3200C14, Asus Strix X299
  • E Gaming, 2x Samsung 840 Evo 1TB, Windows 10 Pro x64
Unigine Superposition - 1080p High - Totaalscore 12.812
Testconfiguratie
  • Intel Core i9 7900X @ 4.5GHz, 32GB DDR4
  • 3200C14, Asus Strix X299
  • E Gaming, 2x Samsung 840 Evo 1TB, Windows 10 Pro x64
Unigine Superposition - 1080p High 95,8 fps
Testconfiguratie
  • Intel Core i9 7900X @ 4.5GHz, 32GB DDR4
  • 3200C14, Asus Strix X299
  • E Gaming, 2x Samsung 840 Evo 1TB, Windows 10 Pro x64
Unigine Superposition - 4K Optimized - Totaalscore 7.489
Testconfiguratie
  • Intel Core i9 7900X @ 4.5GHz, 32GB DDR4
  • 3200C14, Asus Strix X299
  • E Gaming, 2x Samsung 840 Evo 1TB, Windows 10 Pro x64
Unigine Superposition - 4K Optimized 56 fps
Testconfiguratie
  • Intel Core i9 7900X @ 4.5GHz, 32GB DDR4
  • 3200C14, Asus Strix X299
  • E Gaming, 2x Samsung 840 Evo 1TB, Windows 10 Pro x64
Assassins Creed Origins - 1920x1080 - Medium 118 fps
Testconfiguratie
  • Intel Core i9 7900X @ 4.5GHz, 32GB DDR4
  • 3200C14, Asus Strix X299
  • E Gaming, 2x Samsung 840 Evo 1TB, Windows 10 Pro x64
Assassins Creed Origins - 1920x1080 - Ultra 91 fps
Testconfiguratie
  • Intel Core i9 7900X @ 4.5GHz, 32GB DDR4
  • 3200C14, Asus Strix X299
  • E Gaming, 2x Samsung 840 Evo 1TB, Windows 10 Pro x64
Assassins Creed Origins - 2560x1440 - Medium 94 fps
Testconfiguratie
  • Intel Core i9 7900X @ 4.5GHz, 32GB DDR4
  • 3200C14, Asus Strix X299
  • E Gaming, 2x Samsung 840 Evo 1TB, Windows 10 Pro x64
Assassins Creed Origins - 2560x1440 - Ultra 73 fps
Testconfiguratie
  • Intel Core i9 7900X @ 4.5GHz, 32GB DDR4
  • 3200C14, Asus Strix X299
  • E Gaming, 2x Samsung 840 Evo 1TB, Windows 10 Pro x64
Assassins Creed Origins - 3840x2160 - Medium 62 fps
Testconfiguratie
  • Intel Core i9 7900X @ 4.5GHz, 32GB DDR4
  • 3200C14, Asus Strix X299
  • E Gaming, 2x Samsung 840 Evo 1TB, Windows 10 Pro x64
Assassins Creed Origins - 3840x2160 - Ultra 46 fps
Testconfiguratie
  • Intel Core i9 7900X @ 4.5GHz, 32GB DDR4
  • 3200C14, Asus Strix X299
  • E Gaming, 2x Samsung 840 Evo 1TB, Windows 10 Pro x64
Battlefield 1 (DX12) - 1920x1080 - Medium 181,6 fps
Testconfiguratie
  • Intel Core i9 7900X @ 4.5GHz, 32GB DDR4
  • 3200C14, Asus Strix X299
  • E Gaming, 2x Samsung 840 Evo 1TB, Windows 10 Pro x64
Battlefield 1 (DX12) - 1920x1080 - Ultra 154 fps
Testconfiguratie
  • Intel Core i9 7900X @ 4.5GHz, 32GB DDR4
  • 3200C14, Asus Strix X299
  • E Gaming, 2x Samsung 840 Evo 1TB, Windows 10 Pro x64
Battlefield 1 (DX12) - 2560x1440 - Medium 157,8 fps
Testconfiguratie
  • Intel Core i9 7900X @ 4.5GHz, 32GB DDR4
  • 3200C14, Asus Strix X299
  • E Gaming, 2x Samsung 840 Evo 1TB, Windows 10 Pro x64
Battlefield 1 (DX12) - 2560x1440 - Ultra 120,3 fps
Testconfiguratie
  • Intel Core i9 7900X @ 4.5GHz, 32GB DDR4
  • 3200C14, Asus Strix X299
  • E Gaming, 2x Samsung 840 Evo 1TB, Windows 10 Pro x64
Battlefield 1 (DX12) - 3840x2160 - Medium 88,8 fps
Testconfiguratie
  • Intel Core i9 7900X @ 4.5GHz, 32GB DDR4
  • 3200C14, Asus Strix X299
  • E Gaming, 2x Samsung 840 Evo 1TB, Windows 10 Pro x64
Battlefield 1 (DX12) - 3840x2160 - Ultra 71 fps
Testconfiguratie
  • Intel Core i9 7900X @ 4.5GHz, 32GB DDR4
  • 3200C14, Asus Strix X299
  • E Gaming, 2x Samsung 840 Evo 1TB, Windows 10 Pro x64
F1 2018 - 1920x1080 - Medium 244,3 fps
Testconfiguratie
  • Intel Core i9 7900X @ 4.5GHz, 32GB DDR4
  • 3200C14, Asus Strix X299
  • E Gaming, 2x Samsung 840 Evo 1TB, Windows 10 Pro x64
F1 2018 - 1920x1080 - Ultra 143,2 fps
Testconfiguratie
  • Intel Core i9 7900X @ 4.5GHz, 32GB DDR4
  • 3200C14, Asus Strix X299
  • E Gaming, 2x Samsung 840 Evo 1TB, Windows 10 Pro x64
F1 2018 - 2560x1440 - Medium 188,9 fps
Testconfiguratie
  • Intel Core i9 7900X @ 4.5GHz, 32GB DDR4
  • 3200C14, Asus Strix X299
  • E Gaming, 2x Samsung 840 Evo 1TB, Windows 10 Pro x64
F1 2018 - 2560x1440 - Ultra 112,5 fps
Testconfiguratie
  • Intel Core i9 7900X @ 4.5GHz, 32GB DDR4
  • 3200C14, Asus Strix X299
  • E Gaming, 2x Samsung 840 Evo 1TB, Windows 10 Pro x64
F1 2018 - 3840x2160 - Medium 112,9 fps
Testconfiguratie
  • Intel Core i9 7900X @ 4.5GHz, 32GB DDR4
  • 3200C14, Asus Strix X299
  • E Gaming, 2x Samsung 840 Evo 1TB, Windows 10 Pro x64
F1 2018 - 3840x2160 - Ultra 67,8 fps
Testconfiguratie
  • Intel Core i9 7900X @ 4.5GHz, 32GB DDR4
  • 3200C14, Asus Strix X299
  • E Gaming, 2x Samsung 840 Evo 1TB, Windows 10 Pro x64
Far Cry 5 - 2560x1440 - Medium 99 fps
Testconfiguratie
  • Intel Core i9 7900X @ 4.5GHz, 32GB DDR4
  • 3200C14, Asus Strix X299
  • E Gaming, 2x Samsung 840 Evo 1TB, Windows 10 Pro x64
Far Cry 5 - 2560x1440 - Ultra 84 fps
Testconfiguratie
  • Intel Core i9 7900X @ 4.5GHz, 32GB DDR4
  • 3200C14, Asus Strix X299
  • E Gaming, 2x Samsung 840 Evo 1TB, Windows 10 Pro x64
Far Cry 5 - 3840x2160 - Medium 51 fps
Testconfiguratie
  • Intel Core i9 7900X @ 4.5GHz, 32GB DDR4
  • 3200C14, Asus Strix X299
  • E Gaming, 2x Samsung 840 Evo 1TB, Windows 10 Pro x64
Far Cry 5 - 3840x2160 - Ultra 44 fps
Testconfiguratie
  • Intel Core i9 7900X @ 4.5GHz, 32GB DDR4
  • 3200C14, Asus Strix X299
  • E Gaming, 2x Samsung 840 Evo 1TB, Windows 10 Pro x64
GTA V - 1920x1080 - Medium 131,9 fps
Testconfiguratie
  • Intel Core i9 7900X @ 4.5GHz, 32GB DDR4
  • 3200C14, Asus Strix X299
  • E Gaming, 2x Samsung 840 Evo 1TB, Windows 10 Pro x64
GTA V - 1920x1080 - Ultra 91,3 fps
Testconfiguratie
  • Intel Core i9 7900X @ 4.5GHz, 32GB DDR4
  • 3200C14, Asus Strix X299
  • E Gaming, 2x Samsung 840 Evo 1TB, Windows 10 Pro x64
GTA V - 2560x1440 - Medium 130,7 fps
Testconfiguratie
  • Intel Core i9 7900X @ 4.5GHz, 32GB DDR4
  • 3200C14, Asus Strix X299
  • E Gaming, 2x Samsung 840 Evo 1TB, Windows 10 Pro x64
GTA V - 2560x1440 - Ultra 84,7 fps
Testconfiguratie
  • Intel Core i9 7900X @ 4.5GHz, 32GB DDR4
  • 3200C14, Asus Strix X299
  • E Gaming, 2x Samsung 840 Evo 1TB, Windows 10 Pro x64
GTA V - 3840x2160 - Medium 91,9 fps
Testconfiguratie
  • Intel Core i9 7900X @ 4.5GHz, 32GB DDR4
  • 3200C14, Asus Strix X299
  • E Gaming, 2x Samsung 840 Evo 1TB, Windows 10 Pro x64
GTA V - 3840x2160 - Ultra 48,1 fps
Testconfiguratie
  • Intel Core i9 7900X @ 4.5GHz, 32GB DDR4
  • 3200C14, Asus Strix X299
  • E Gaming, 2x Samsung 840 Evo 1TB, Windows 10 Pro x64
Rise of the Tomb Raider (DX12) - 1920x1080 - Medium 178,62 fps
Testconfiguratie
  • Intel Core i9 7900X @ 4.5GHz, 32GB DDR4
  • 3200C14, Asus Strix X299
  • E Gaming, 2x Samsung 840 Evo 1TB, Windows 10 Pro x64
Rise of the Tomb Raider (DX12) - 1920x1080 - Ultra 135,98 fps
Testconfiguratie
  • Intel Core i9 7900X @ 4.5GHz, 32GB DDR4
  • 3200C14, Asus Strix X299
  • E Gaming, 2x Samsung 840 Evo 1TB, Windows 10 Pro x64
Rise of the Tomb Raider (DX12) - 2560x1440 - Medium 133,74 fps
Testconfiguratie
  • Intel Core i9 7900X @ 4.5GHz, 32GB DDR4
  • 3200C14, Asus Strix X299
  • E Gaming, 2x Samsung 840 Evo 1TB, Windows 10 Pro x64
Rise of the Tomb Raider (DX12) - 2560x1440 - Ultra 94,25 fps
Testconfiguratie
  • Intel Core i9 7900X @ 4.5GHz, 32GB DDR4
  • 3200C14, Asus Strix X299
  • E Gaming, 2x Samsung 840 Evo 1TB, Windows 10 Pro x64
Rise of the Tomb Raider (DX12) - 3840x2160 - Medium 72,1 fps
Testconfiguratie
  • Intel Core i9 7900X @ 4.5GHz, 32GB DDR4
  • 3200C14, Asus Strix X299
  • E Gaming, 2x Samsung 840 Evo 1TB, Windows 10 Pro x64
Rise of the Tomb Raider (DX12) - 3840x2160 - Ultra 51,54 fps
Testconfiguratie
  • Intel Core i9 7900X @ 4.5GHz, 32GB DDR4
  • 3200C14, Asus Strix X299
  • E Gaming, 2x Samsung 840 Evo 1TB, Windows 10 Pro x64
Total War Warhammer II - 1920x1080 - Medium 116,9 fps
Testconfiguratie
  • Intel Core i9 7900X @ 4.5GHz, 32GB DDR4
  • 3200C14, Asus Strix X299
  • E Gaming, 2x Samsung 840 Evo 1TB, Windows 10 Pro x64
Total War Warhammer II - 1920x1080 - Ultra 74,6 fps
Testconfiguratie
  • Intel Core i9 7900X @ 4.5GHz, 32GB DDR4
  • 3200C14, Asus Strix X299
  • E Gaming, 2x Samsung 840 Evo 1TB, Windows 10 Pro x64
Total War Warhammer II - 2560x1440 - Medium 106,2 fps
Testconfiguratie
  • Intel Core i9 7900X @ 4.5GHz, 32GB DDR4
  • 3200C14, Asus Strix X299
  • E Gaming, 2x Samsung 840 Evo 1TB, Windows 10 Pro x64
Total War Warhammer II - 2560x1440 - Ultra 66,8 fps
Testconfiguratie
  • Intel Core i9 7900X @ 4.5GHz, 32GB DDR4
  • 3200C14, Asus Strix X299
  • E Gaming, 2x Samsung 840 Evo 1TB, Windows 10 Pro x64
Total War Warhammer II - 3840x2160 - Medium 57,8 fps
Testconfiguratie
  • Intel Core i9 7900X @ 4.5GHz, 32GB DDR4
  • 3200C14, Asus Strix X299
  • E Gaming, 2x Samsung 840 Evo 1TB, Windows 10 Pro x64
Total War Warhammer II - 3840x2160 - Ultra 40,3 fps
Testconfiguratie
  • Intel Core i9 7900X @ 4.5GHz, 32GB DDR4
  • 3200C14, Asus Strix X299
  • E Gaming, 2x Samsung 840 Evo 1TB, Windows 10 Pro x64

Hardware.Info Prestatiescore

HWI Videokaart Prestatiescore 2018-2 (Full HD) 131,5
Testconfiguratie
  • Intel Core i9 7900X @ 4.5GHz, 32GB DDR4
  • 3200C14, Asus Strix X299
  • E Gaming, 2x Samsung 840 Evo 1TB, Windows 10 Pro x64
HWI Videokaart Prestatiescore 2018-2 (WQHD) 108,8
Testconfiguratie
  • Intel Core i9 7900X @ 4.5GHz, 32GB DDR4
  • 3200C14, Asus Strix X299
  • E Gaming, 2x Samsung 840 Evo 1TB, Windows 10 Pro x64
HWI Videokaart Prestatiescore 2018-2 (4K) 64,6
Testconfiguratie
  • Intel Core i9 7900X @ 4.5GHz, 32GB DDR4
  • 3200C14, Asus Strix X299
  • E Gaming, 2x Samsung 840 Evo 1TB, Windows 10 Pro x64

Stroomverbruik

Stroomverbruik (Videokaart) - Idle - 12V PEG1 4,2 W
Testconfiguratie
  • Stroomverbruik videokaarten (enkel GPU). Load in Rise of the Tomb Raider 3840x2160 Ultra settings.
Stroomverbruik (Videokaart) - Idle - 12V PEG2 4,58 W
Testconfiguratie
  • Stroomverbruik videokaarten (enkel GPU). Load in Rise of the Tomb Raider 3840x2160 Ultra settings.
Stroomverbruik (Videokaart) - Idle - 12V PCIe 3,51 W
Testconfiguratie
  • Stroomverbruik videokaarten (enkel GPU). Load in Rise of the Tomb Raider 3840x2160 Ultra settings.
Stroomverbruik (Videokaart) - Idle - Totaal 12,29 W
Testconfiguratie
  • Stroomverbruik videokaarten (enkel GPU). Load in Rise of the Tomb Raider 3840x2160 Ultra settings.
Stroomverbruik (Videokaart) - Load - 12V PEG1 118,76 W
Testconfiguratie
  • Stroomverbruik videokaarten (enkel GPU). Load in Rise of the Tomb Raider 3840x2160 Ultra settings.
Stroomverbruik (Videokaart) - Load - 12V PEG2 57,1 W
Testconfiguratie
  • Stroomverbruik videokaarten (enkel GPU). Load in Rise of the Tomb Raider 3840x2160 Ultra settings.
Stroomverbruik (Videokaart) - Load - 12V PCIe 50,38 W
Testconfiguratie
  • Stroomverbruik videokaarten (enkel GPU). Load in Rise of the Tomb Raider 3840x2160 Ultra settings.
Stroomverbruik (Videokaart) - Load - Totaal 226,24 W
Testconfiguratie
  • Stroomverbruik videokaarten (enkel GPU). Load in Rise of the Tomb Raider 3840x2160 Ultra settings.

Geluidsproductie

Geluidsproductie - Idle (10 cm.) 17 dB(A)
Testconfiguratie
  • Geluidsproductie & warmte ontwikkeling 2018
  • 2019
Geluidsproductie - Load (10 cm.) 43,1 dB(A)
Testconfiguratie
  • Geluidsproductie & warmte ontwikkeling 2018
  • 2019
Geluidsproductie - 100% fanprofiel (10 cm.) 64 dB(A)
Testconfiguratie
  • Geluidsproductie & warmte ontwikkeling 2018
  • 2019
Fanprofiel 1 load 52 %
Testconfiguratie
  • Geluidsproductie & warmte ontwikkeling 2018
  • 2019
Fanprofiel voor 40 dB(A) (10 cm.) 47 %
Testconfiguratie
  • Geluidsproductie & warmte ontwikkeling 2018
  • 2019

Warmteontwikkeling

Max. temperatuur (30 min. duurtest) 67 °C
Testconfiguratie
  • Geluidsproductie & warmte ontwikkeling 2018
  • 2019
Stabiele klokfrequentie na 30 min. duurtest 1.905 MHz
Testconfiguratie
  • Geluidsproductie & warmte ontwikkeling 2018
  • 2019
Temperatuur bij 40 dB(A) en vaste snelheid/spanning 62 °C
Testconfiguratie
  • Geluidsproductie & warmte ontwikkeling 2018
  • 2019
Stabiele klokfrequentie - 40 dB(A) + vaste spanning 1.920 MHz
Testconfiguratie
  • Geluidsproductie & warmte ontwikkeling 2018
  • 2019

Reviews

Alternatieven

EVGA GeForce RTX 2080 Ti FTW3 Ultra Gaming 11GB

  • Nvidia GeForce RTX 2080 Ti
  • 1755 MHz
  • 11264 MB
 

Asus RoG Strix GeForce RTX 2080 Ti OC 11GB

  • Nvidia GeForce RTX 2080 Ti
  • 1650 MHz
  • 11264 MB
 

Inno3D GeForce RTX 2080 Ti iChill Black 11GB

  • Nvidia GeForce RTX 2080 Ti
  • 1695 MHz
  • 11264 MB
 

MSI GeForce RTX 2080 Ti Gaming X Trio 11GB

  • Nvidia GeForce RTX 2080 Ti
  • 1755 MHz
  • 11264 MB
 

Gigabyte GeForce RTX 2060 Gaming OC Pro 6GB

  • Nvidia GeForce RTX 2060
  • 1830 MHz
  • 6144 MB
 

MSI GeForce RTX 2060 Gaming Z 6GB

  • Nvidia GeForce RTX 2060
  • 1830 MHz
  • 6144 MB
 

EVGA GeForce RTX 2060 XC Gaming 6GB

  • Nvidia GeForce RTX 2060
  • 1755 MHz
  • 6144 MB
 

Asus GeForce RTX 2060 Strix OC 6GB

  • Nvidia GeForce RTX 2060
  • 1830 MHz
  • 6144 MB
 

MSI GeForce RTX 2080 Ti Lightning Z 11GB

  • Nvidia GeForce RTX 2080 Ti
  • 1770 MHz
  • 11264 MB
 

Nvidia GeForce RTX 2060 Founders Edition

  • Nvidia GeForce RTX 2060
  • 1680 MHz
  • 6144 MB
 

ASRock Radeon RX 590 Phantom Gaming X OC 8GB

  • AMD Radeon RX 590
  • 1591 MHz
  • 8192 MB
 

PNY GeForce RTX 2070 XLR8 Gaming OC Twin Fan 8GB

  • Nvidia GeForce RTX 2070
  • 1710 MHz
  • 8192 MB
 
0