Excellent

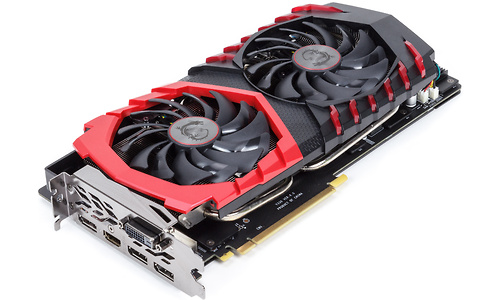
MSI GeForce GTX 1070 Ti Gaming 8GB

Prijsverloop

Dit product is niet (meer) verkrijgbaar bij de bij Hardware Info aangesloten shops.

Specificaties

Belangrijkste specificaties

GPU Nvidia GeForce GTX 1070 Ti
Klokfrequentie turbo 1.683 MHz
Geheugengrootte 8.192 MB

Chip

GPU Nvidia GeForce GTX 1070 Ti
GPU serie Nvidia GeForce GTX-10
GPU fabrikant Nvidia
Klokfrequentie GPU 1.607 MHz
Klokfrequentie turbo 1.683 MHz
Aantal rekenkernen 2.432

Geheugen

Geheugengrootte 8.192 MB
Geheugensnelheid 2.002 MHz
Geheugentype GDDR5
Geheugenkoeling
Geheugenchips (merk) Micron

Functionaliteit

DirectX versie DirectX 12
OpenGL versie 4
Nvidia SLI/NVLink-compatible
AMD Crossfire-compatible

Kaartontwerp

Interface PCI-Express 3.0 x16
GPU koeling Actief (2x)
PEG stroomaansluiting
Type power connector(s) PEG6+PEG8
Aantal slots 2
Lengte 28 cm
Breedte 13 cm
Hoogte 4 cm
Low profile

Aansluitingen

D-Sub uitgang
DVI uitgang
Aantal DVI uitgangen 1
HDMI uitgang
HDMI-versie 2.0b
Aantal HDMI uitgangen 1
DisplayPort uitgang
DisplayPort-versie 1.4
Aantal DisplayPort uitgangen 3
Interne HDMI aansluitingen 0

Meegeleverd

DVI -> D-Sub plug
DVI -> HDMI plug
HDMI -> DVI plug
Afstandsbediening

Productcodes

SKU V330-237R, MSI 8GB D5 GTX 1070 TI GAMING 8G, 1070TIGAMING8G, GTX 1070 TI GAMING 8G, GEFORCE GTX 1070 TI GAMING 8G
EAN 4719072549558
Toegevoegd aan Hardware Info donderdag 2 november 2017

Testresultaten

Dit product is door Hardware Info getest op vrijdag 29 december 2017.

Hardware.Info Prestatiescore

HWI Videokaart Prestatiescore 2017-2018 (WQHD) 87,7
Testconfiguratie
  • Intel Core i9 7900X @ 4.5GHz, 32GB DDR4
  • 3200C14, Asus Strix X299
  • E Gaming, 2x Samsung 840 Evo 1TB, Windows 10 Pro x64
HWI Videokaart Prestatiescore 2017-2018 (4K) 53,6
Testconfiguratie
  • Intel Core i9 7900X @ 4.5GHz, 32GB DDR4
  • 3200C14, Asus Strix X299
  • E Gaming, 2x Samsung 840 Evo 1TB, Windows 10 Pro x64

Benchmarks (Win 10 Pro x64, Intel core i9 7900X @ 4.5GHz)

Gebruikte driver versie Geforce 388.09
Testconfiguratie
  • Intel Core i9 7900X @ 4.5GHz, 32GB DDR4
  • 3200C14, Asus Strix X299
  • E Gaming, 2x Samsung 840 Evo 1TB, Windows 10 Pro x64
3DMark Firestrike 17.587
Testconfiguratie
  • Intel Core i9 7900X @ 4.5GHz, 32GB DDR4
  • 3200C14, Asus Strix X299
  • E Gaming, 2x Samsung 840 Evo 1TB, Windows 10 Pro x64
3DMark Firestrike Graphics score 19.583
Testconfiguratie
  • Intel Core i9 7900X @ 4.5GHz, 32GB DDR4
  • 3200C14, Asus Strix X299
  • E Gaming, 2x Samsung 840 Evo 1TB, Windows 10 Pro x64
3DMark Firestrike Extreme 9.076
Testconfiguratie
  • Intel Core i9 7900X @ 4.5GHz, 32GB DDR4
  • 3200C14, Asus Strix X299
  • E Gaming, 2x Samsung 840 Evo 1TB, Windows 10 Pro x64
3DMark Firestrike Ultra 4.766
Testconfiguratie
  • Intel Core i9 7900X @ 4.5GHz, 32GB DDR4
  • 3200C14, Asus Strix X299
  • E Gaming, 2x Samsung 840 Evo 1TB, Windows 10 Pro x64
3DMark Timespy 7.230
Testconfiguratie
  • Intel Core i9 7900X @ 4.5GHz, 32GB DDR4
  • 3200C14, Asus Strix X299
  • E Gaming, 2x Samsung 840 Evo 1TB, Windows 10 Pro x64
3DMark Timespy - Graphics score 6.755
Testconfiguratie
  • Intel Core i9 7900X @ 4.5GHz, 32GB DDR4
  • 3200C14, Asus Strix X299
  • E Gaming, 2x Samsung 840 Evo 1TB, Windows 10 Pro x64
Unigine Superposition - 1080p High - Totaalscore 10.338
Testconfiguratie
  • Intel Core i9 7900X @ 4.5GHz, 32GB DDR4
  • 3200C14, Asus Strix X299
  • E Gaming, 2x Samsung 840 Evo 1TB, Windows 10 Pro x64
Unigine Superposition - 1080p High 77,3 fps
Testconfiguratie
  • Intel Core i9 7900X @ 4.5GHz, 32GB DDR4
  • 3200C14, Asus Strix X299
  • E Gaming, 2x Samsung 840 Evo 1TB, Windows 10 Pro x64
Unigine Superposition - 4K Optimized - Totaalscore 6.027
Testconfiguratie
  • Intel Core i9 7900X @ 4.5GHz, 32GB DDR4
  • 3200C14, Asus Strix X299
  • E Gaming, 2x Samsung 840 Evo 1TB, Windows 10 Pro x64
Unigine Superposition - 4K Optimized 45,1 fps
Testconfiguratie
  • Intel Core i9 7900X @ 4.5GHz, 32GB DDR4
  • 3200C14, Asus Strix X299
  • E Gaming, 2x Samsung 840 Evo 1TB, Windows 10 Pro x64
Battlefield 1 (DX12) - 1920x1080 - Medium 161,5 fps
Testconfiguratie
  • Intel Core i9 7900X @ 4.5GHz, 32GB DDR4
  • 3200C14, Asus Strix X299
  • E Gaming, 2x Samsung 840 Evo 1TB, Windows 10 Pro x64
Battlefield 1 (DX12) - 1920x1080 - Ultra 122 fps
Testconfiguratie
  • Intel Core i9 7900X @ 4.5GHz, 32GB DDR4
  • 3200C14, Asus Strix X299
  • E Gaming, 2x Samsung 840 Evo 1TB, Windows 10 Pro x64
Battlefield 1 (DX12) - 2560x1440 - Medium 122,5 fps
Testconfiguratie
  • Intel Core i9 7900X @ 4.5GHz, 32GB DDR4
  • 3200C14, Asus Strix X299
  • E Gaming, 2x Samsung 840 Evo 1TB, Windows 10 Pro x64
Battlefield 1 (DX12) - 2560x1440 - Ultra 88 fps
Testconfiguratie
  • Intel Core i9 7900X @ 4.5GHz, 32GB DDR4
  • 3200C14, Asus Strix X299
  • E Gaming, 2x Samsung 840 Evo 1TB, Windows 10 Pro x64
Battlefield 1 (DX12) - 3840x2160 - Medium 66 fps
Testconfiguratie
  • Intel Core i9 7900X @ 4.5GHz, 32GB DDR4
  • 3200C14, Asus Strix X299
  • E Gaming, 2x Samsung 840 Evo 1TB, Windows 10 Pro x64
Battlefield 1 (DX12) - 3840x2160 - Ultra 48,2 fps
Testconfiguratie
  • Intel Core i9 7900X @ 4.5GHz, 32GB DDR4
  • 3200C14, Asus Strix X299
  • E Gaming, 2x Samsung 840 Evo 1TB, Windows 10 Pro x64
Dragon Age Inquisition - 1920x1080 - Medium 241,4 fps
Testconfiguratie
  • Intel Core i9 7900X @ 4.5GHz, 32GB DDR4
  • 3200C14, Asus Strix X299
  • E Gaming, 2x Samsung 840 Evo 1TB, Windows 10 Pro x64
Dragon Age Inquisition - 1920x1080 - Ultra 104,4 fps
Testconfiguratie
  • Intel Core i9 7900X @ 4.5GHz, 32GB DDR4
  • 3200C14, Asus Strix X299
  • E Gaming, 2x Samsung 840 Evo 1TB, Windows 10 Pro x64
Dragon Age Inquisition - 2560x1440 - Medium 174,8 fps
Testconfiguratie
  • Intel Core i9 7900X @ 4.5GHz, 32GB DDR4
  • 3200C14, Asus Strix X299
  • E Gaming, 2x Samsung 840 Evo 1TB, Windows 10 Pro x64
Dragon Age Inquisition - 2560x1440 - Ultra 66,8 fps
Testconfiguratie
  • Intel Core i9 7900X @ 4.5GHz, 32GB DDR4
  • 3200C14, Asus Strix X299
  • E Gaming, 2x Samsung 840 Evo 1TB, Windows 10 Pro x64
Dragon Age Inquisition - 3840x2160 - Medium 90,4 fps
Testconfiguratie
  • Intel Core i9 7900X @ 4.5GHz, 32GB DDR4
  • 3200C14, Asus Strix X299
  • E Gaming, 2x Samsung 840 Evo 1TB, Windows 10 Pro x64
Dragon Age Inquisition - 3840x2160 - Ultra 33,7 fps
Testconfiguratie
  • Intel Core i9 7900X @ 4.5GHz, 32GB DDR4
  • 3200C14, Asus Strix X299
  • E Gaming, 2x Samsung 840 Evo 1TB, Windows 10 Pro x64
Ghost Recon: Wildlands - 1920x1080 - Medium 108,9 fps
Testconfiguratie
  • Intel Core i9 7900X @ 4.5GHz, 32GB DDR4
  • 3200C14, Asus Strix X299
  • E Gaming, 2x Samsung 840 Evo 1TB, Windows 10 Pro x64
Ghost Recon: Wildlands - 1920x1080 - Ultra 55,9 fps
Testconfiguratie
  • Intel Core i9 7900X @ 4.5GHz, 32GB DDR4
  • 3200C14, Asus Strix X299
  • E Gaming, 2x Samsung 840 Evo 1TB, Windows 10 Pro x64
Ghost Recon: Wildlands - 2560x1440 - Medium 81,6 fps
Testconfiguratie
  • Intel Core i9 7900X @ 4.5GHz, 32GB DDR4
  • 3200C14, Asus Strix X299
  • E Gaming, 2x Samsung 840 Evo 1TB, Windows 10 Pro x64
Ghost Recon: Wildlands - 2560x1440 - Ultra 43,1 fps
Testconfiguratie
  • Intel Core i9 7900X @ 4.5GHz, 32GB DDR4
  • 3200C14, Asus Strix X299
  • E Gaming, 2x Samsung 840 Evo 1TB, Windows 10 Pro x64
Ghost Recon: Wildlands - 3840x2160 - Medium 47,1 fps
Testconfiguratie
  • Intel Core i9 7900X @ 4.5GHz, 32GB DDR4
  • 3200C14, Asus Strix X299
  • E Gaming, 2x Samsung 840 Evo 1TB, Windows 10 Pro x64
Ghost Recon: Wildlands - 3840x2160 - Ultra 26,5 fps
Testconfiguratie
  • Intel Core i9 7900X @ 4.5GHz, 32GB DDR4
  • 3200C14, Asus Strix X299
  • E Gaming, 2x Samsung 840 Evo 1TB, Windows 10 Pro x64
GTA V - 1920x1080 - Medium 149,3 fps
Testconfiguratie
  • Intel Core i9 7900X @ 4.5GHz, 32GB DDR4
  • 3200C14, Asus Strix X299
  • E Gaming, 2x Samsung 840 Evo 1TB, Windows 10 Pro x64
GTA V - 1920x1080 - Ultra (2x MSAA) 112,1 fps
Testconfiguratie
  • Intel Core i9 7900X @ 4.5GHz, 32GB DDR4
  • 3200C14, Asus Strix X299
  • E Gaming, 2x Samsung 840 Evo 1TB, Windows 10 Pro x64
GTA V - 2560x1440 - Medium 149,8 fps
Testconfiguratie
  • Intel Core i9 7900X @ 4.5GHz, 32GB DDR4
  • 3200C14, Asus Strix X299
  • E Gaming, 2x Samsung 840 Evo 1TB, Windows 10 Pro x64
GTA V - 2560x1440 - Ultra (2x MSAA) 99,1 fps
Testconfiguratie
  • Intel Core i9 7900X @ 4.5GHz, 32GB DDR4
  • 3200C14, Asus Strix X299
  • E Gaming, 2x Samsung 840 Evo 1TB, Windows 10 Pro x64
GTA V - 3840x2160 - Medium 144,8 fps
Testconfiguratie
  • Intel Core i9 7900X @ 4.5GHz, 32GB DDR4
  • 3200C14, Asus Strix X299
  • E Gaming, 2x Samsung 840 Evo 1TB, Windows 10 Pro x64
GTA V - 3840x2160 - Ultra (2x MSAA) 52,8 fps
Testconfiguratie
  • Intel Core i9 7900X @ 4.5GHz, 32GB DDR4
  • 3200C14, Asus Strix X299
  • E Gaming, 2x Samsung 840 Evo 1TB, Windows 10 Pro x64
Hitman (DX12) - 1920x1080 - Medium 191,3 fps
Testconfiguratie
  • Intel Core i9 7900X @ 4.5GHz, 32GB DDR4
  • 3200C14, Asus Strix X299
  • E Gaming, 2x Samsung 840 Evo 1TB, Windows 10 Pro x64
Hitman (DX12) - 1920x1080 - Ultra 133,1 fps
Testconfiguratie
  • Intel Core i9 7900X @ 4.5GHz, 32GB DDR4
  • 3200C14, Asus Strix X299
  • E Gaming, 2x Samsung 840 Evo 1TB, Windows 10 Pro x64
Hitman (DX12) - 2560x1440 - Medium 153,3 fps
Testconfiguratie
  • Intel Core i9 7900X @ 4.5GHz, 32GB DDR4
  • 3200C14, Asus Strix X299
  • E Gaming, 2x Samsung 840 Evo 1TB, Windows 10 Pro x64
Hitman (DX12) - 2560x1440 - Ultra 100 fps
Testconfiguratie
  • Intel Core i9 7900X @ 4.5GHz, 32GB DDR4
  • 3200C14, Asus Strix X299
  • E Gaming, 2x Samsung 840 Evo 1TB, Windows 10 Pro x64
Hitman (DX12) - 3840x2160 - Medium 85,7 fps
Testconfiguratie
  • Intel Core i9 7900X @ 4.5GHz, 32GB DDR4
  • 3200C14, Asus Strix X299
  • E Gaming, 2x Samsung 840 Evo 1TB, Windows 10 Pro x64
Hitman (DX12) - 3840x2160 - Ultra 59 fps
Testconfiguratie
  • Intel Core i9 7900X @ 4.5GHz, 32GB DDR4
  • 3200C14, Asus Strix X299
  • E Gaming, 2x Samsung 840 Evo 1TB, Windows 10 Pro x64
Prey - 1920x1080 - Medium 222,3 fps
Testconfiguratie
  • Intel Core i9 7900X @ 4.5GHz, 32GB DDR4
  • 3200C14, Asus Strix X299
  • E Gaming, 2x Samsung 840 Evo 1TB, Windows 10 Pro x64
Prey - 1920x1080 - Ultra 180,2 fps
Testconfiguratie
  • Intel Core i9 7900X @ 4.5GHz, 32GB DDR4
  • 3200C14, Asus Strix X299
  • E Gaming, 2x Samsung 840 Evo 1TB, Windows 10 Pro x64
Prey - 2560x1440 - Medium 143,7 fps
Testconfiguratie
  • Intel Core i9 7900X @ 4.5GHz, 32GB DDR4
  • 3200C14, Asus Strix X299
  • E Gaming, 2x Samsung 840 Evo 1TB, Windows 10 Pro x64
Prey - 2560x1440 - Ultra 108,9 fps
Testconfiguratie
  • Intel Core i9 7900X @ 4.5GHz, 32GB DDR4
  • 3200C14, Asus Strix X299
  • E Gaming, 2x Samsung 840 Evo 1TB, Windows 10 Pro x64
Prey - 3840x2160 - Medium 71,1 fps
Testconfiguratie
  • Intel Core i9 7900X @ 4.5GHz, 32GB DDR4
  • 3200C14, Asus Strix X299
  • E Gaming, 2x Samsung 840 Evo 1TB, Windows 10 Pro x64
Prey - 3840x2160 - Ultra 50,5 fps
Testconfiguratie
  • Intel Core i9 7900X @ 4.5GHz, 32GB DDR4
  • 3200C14, Asus Strix X299
  • E Gaming, 2x Samsung 840 Evo 1TB, Windows 10 Pro x64
Rainbow Six: Siege - 1920x1080 - Medium 246,5 fps
Testconfiguratie
  • Intel Core i9 7900X @ 4.5GHz, 32GB DDR4
  • 3200C14, Asus Strix X299
  • E Gaming, 2x Samsung 840 Evo 1TB, Windows 10 Pro x64
Rainbow Six: Siege - 1920x1080 - Ultra 95,4 fps
Testconfiguratie
  • Intel Core i9 7900X @ 4.5GHz, 32GB DDR4
  • 3200C14, Asus Strix X299
  • E Gaming, 2x Samsung 840 Evo 1TB, Windows 10 Pro x64
Rainbow Six: Siege - 2560x1440 - Medium 171,9 fps
Testconfiguratie
  • Intel Core i9 7900X @ 4.5GHz, 32GB DDR4
  • 3200C14, Asus Strix X299
  • E Gaming, 2x Samsung 840 Evo 1TB, Windows 10 Pro x64
Rainbow Six: Siege - 2560x1440 - Ultra 61,4 fps
Testconfiguratie
  • Intel Core i9 7900X @ 4.5GHz, 32GB DDR4
  • 3200C14, Asus Strix X299
  • E Gaming, 2x Samsung 840 Evo 1TB, Windows 10 Pro x64
Rainbow Six: Siege - 3840x2160 - Medium 93,4 fps
Testconfiguratie
  • Intel Core i9 7900X @ 4.5GHz, 32GB DDR4
  • 3200C14, Asus Strix X299
  • E Gaming, 2x Samsung 840 Evo 1TB, Windows 10 Pro x64
Rainbow Six: Siege - 3840x2160 - Ultra 30,1 fps
Testconfiguratie
  • Intel Core i9 7900X @ 4.5GHz, 32GB DDR4
  • 3200C14, Asus Strix X299
  • E Gaming, 2x Samsung 840 Evo 1TB, Windows 10 Pro x64
Rise of the Tombraider (DX12) - 1920x1080 - Medium 169,6 fps
Testconfiguratie
  • Intel Core i9 7900X @ 4.5GHz, 32GB DDR4
  • 3200C14, Asus Strix X299
  • E Gaming, 2x Samsung 840 Evo 1TB, Windows 10 Pro x64
Rise of the Tombraider (DX12) - 1920x1080 - Ultra 111 fps
Testconfiguratie
  • Intel Core i9 7900X @ 4.5GHz, 32GB DDR4
  • 3200C14, Asus Strix X299
  • E Gaming, 2x Samsung 840 Evo 1TB, Windows 10 Pro x64
Rise of the Tombraider (DX12) - 2560x1440 - Medium 111,5 fps
Testconfiguratie
  • Intel Core i9 7900X @ 4.5GHz, 32GB DDR4
  • 3200C14, Asus Strix X299
  • E Gaming, 2x Samsung 840 Evo 1TB, Windows 10 Pro x64
Rise of the Tombraider (DX12) - 2560x1440 - Ultra 74,4 fps
Testconfiguratie
  • Intel Core i9 7900X @ 4.5GHz, 32GB DDR4
  • 3200C14, Asus Strix X299
  • E Gaming, 2x Samsung 840 Evo 1TB, Windows 10 Pro x64
Rise of the Tombraider (DX12) - 3840x2160 - Medium 57,2 fps
Testconfiguratie
  • Intel Core i9 7900X @ 4.5GHz, 32GB DDR4
  • 3200C14, Asus Strix X299
  • E Gaming, 2x Samsung 840 Evo 1TB, Windows 10 Pro x64
Rise of the Tombraider (DX12) - 3840x2160 - Ultra 39,9 fps
Testconfiguratie
  • Intel Core i9 7900X @ 4.5GHz, 32GB DDR4
  • 3200C14, Asus Strix X299
  • E Gaming, 2x Samsung 840 Evo 1TB, Windows 10 Pro x64

Stroomverbruik

Stroomverbruik (Videokaart) - Idle - 12V PEG1 0 W
Testconfiguratie
  • Stroomverbruik videokaarten (enkel GPU). Load in Rise of the Tomb Raider 3840x2160 Ultra settings.
Stroomverbruik (Videokaart) - Idle - 12V PEG2 9,56 W
Testconfiguratie
  • Stroomverbruik videokaarten (enkel GPU). Load in Rise of the Tomb Raider 3840x2160 Ultra settings.
Stroomverbruik (Videokaart) - Idle - 12V PCIe 5,3 W
Testconfiguratie
  • Stroomverbruik videokaarten (enkel GPU). Load in Rise of the Tomb Raider 3840x2160 Ultra settings.
Stroomverbruik (Videokaart) - Idle - Totaal 15,03 W
Testconfiguratie
  • Stroomverbruik videokaarten (enkel GPU). Load in Rise of the Tomb Raider 3840x2160 Ultra settings.
Stroomverbruik (Videokaart) - Load - 12V PEG1 27,87 W
Testconfiguratie
  • Stroomverbruik videokaarten (enkel GPU). Load in Rise of the Tomb Raider 3840x2160 Ultra settings.
Stroomverbruik (Videokaart) - Load - 12V PEG2 114,73 W
Testconfiguratie
  • Stroomverbruik videokaarten (enkel GPU). Load in Rise of the Tomb Raider 3840x2160 Ultra settings.
Stroomverbruik (Videokaart) - Load - 12V PCIe 35,76 W
Testconfiguratie
  • Stroomverbruik videokaarten (enkel GPU). Load in Rise of the Tomb Raider 3840x2160 Ultra settings.
Stroomverbruik (Videokaart) - Load - Totaal 178,92 W
Testconfiguratie
  • Stroomverbruik videokaarten (enkel GPU). Load in Rise of the Tomb Raider 3840x2160 Ultra settings.

Geluidsproductie

Geluidsproductie - Idle (10 cm.) 17 dB(A)
Testconfiguratie
  • Geluidsproductie & warmte ontwikkeling 2018
  • 2019
Geluidsproductie - Load (10 cm.) 43,9 dB(A)
Testconfiguratie
  • Geluidsproductie & warmte ontwikkeling 2018
  • 2019
Geluidsproductie - 100% fanprofiel (10 cm.) 60,6 dB(A)
Testconfiguratie
  • Geluidsproductie & warmte ontwikkeling 2018
  • 2019
Fanprofiel 1 load 47 %
Testconfiguratie
  • Geluidsproductie & warmte ontwikkeling 2018
  • 2019
Fanprofiel voor 40 dB(A) (10 cm.) 50 %
Testconfiguratie
  • Geluidsproductie & warmte ontwikkeling 2018
  • 2019

Warmteontwikkeling

Max. temperatuur (30 min. duurtest) 67 °C
Testconfiguratie
  • Geluidsproductie & warmte ontwikkeling 2018
  • 2019
Max. temperatuur bij 40 dB(A) - duurtest (30 min.) 66 °C
Testconfiguratie
  • Geluidsproductie & warmte ontwikkeling 2018
  • 2019
Stabiele klokfrequentie na 30 min. duurtest 1.823 MHz
Testconfiguratie
  • Geluidsproductie & warmte ontwikkeling 2018
  • 2019
Stabiele klokfrequentie na 30 min. duurtest bij 40 dB(A) 1.823 MHz
Testconfiguratie
  • Geluidsproductie & warmte ontwikkeling 2018
  • 2019

Reviews

Videokaarten

Nvidia GeForce GTX 1070 Ti video review

Nividia introduceerde gisteren de GeForce GTX 1070 Ti, een kaart die het gat tussen de reguliere 1070 en de 1080 moet dichtten. Wij zochten uit hoe de nieuwe kaart presteert, en voor welke doelgroep hij bedoeld is.

3 november 2017 15:02

Alternatieven

Asus GeForce GTX 1070 Ti Strix Gaming 8GB

  • Nvidia GeForce GTX 1070 Ti
  • 1683 MHz
  • 8192 MB
 

Inno3D GeForce GTX 1070 Ti iChill X3 8GB

  • Nvidia GeForce GTX 1070 Ti
  • 1683 MHz
  • 8192 MB
 

MSI GeForce GTX 1050 Ti Gaming X 4GB

  • Nvidia GeForce GTX 1050 Ti
  • 1468 MHz
  • 4096 MB
 

MSI GeForce GTX 1060 Gaming X 3GB

  • Nvidia GeForce GTX 1060
  • 1785 MHz
  • 3072 MB
 

MSI GeForce GTX 1080 Gaming X+ 8GB

  • Nvidia GeForce GTX 1080
  • 1823 MHz
  • 8192 MB
 

Gigabyte Aorus GeForce GTX 1080 8GB (11Gbps)

  • Nvidia GeForce GTX 1080
  • 1873 MHz
  • 8192 MB
 

Gigabyte GeForce GTX 1080 Mini ITX 8GB

  • Nvidia GeForce GTX 1080
  • 1771 MHz
  • 8192 MB
 

Gigabyte GeForce GTX 1070 Ti Gaming 8GB

  • Nvidia GeForce GTX 1070 Ti
  • 1683 MHz
  • 8192 MB
 

XFX Radeon RX Vega 56 8GB

  • AMD Radeon RX Vega 56
  • 1471 MHz
  • 8192 MB
 

Asus Radeon RX Vega 64 Strix 8GB

  • AMD Radeon RX Vega 64
  • 1630 MHz
  • 8192 MB
 

Asus Radeon RX Vega 64 Black 8GB

  • AMD Radeon RX Vega 64
  • 1546 MHz
  • 8192 MB
 

Asus RoG Radeon RX Vega 56 Strix OC 8GB

  • AMD Radeon RX Vega 56
  • 1573 MHz
  • 8192 MB
 
0