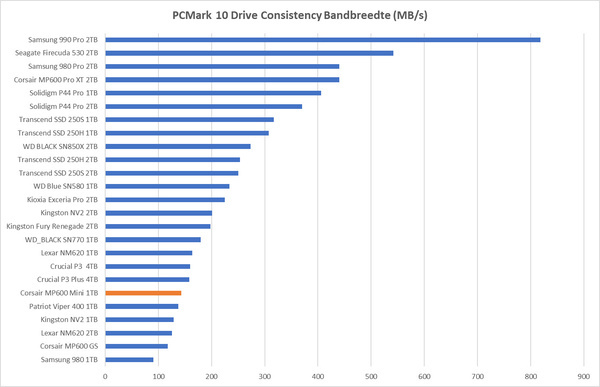
Benchmarks: PCMark 10 Drive Consistency
De prestaties in deze benchmark vallen wat tegen, voor een ssd met PCI Express 4.0.
| Score | Bandbreedte | Zoektijd | |
|---|---|---|---|
| Samsung 990 Pro 2TB | 3527 | 818,58 | 69 |
| Seagate Firecuda 530 2TB | 2337 | 541,91 | 104 |
| Corsair MP600 Pro XT 2TB | 1877 | 440,49 | 131 |
| Samsung 980 Pro 2TB | 1877 | 440,49 | 131 |
| Solidigm P44 Pro 1TB | 1713 | 405,94 | 145 |
| Solidigm P44 Pro 2TB | 1608 | 370,24 | 150 |
| Transcend SSD 250S 1TB | 1343 | 316,93 | 184 |
| Transcend SSD 250H 1TB | 1299 | 307,66 | 191 |
| WD BLACK SN850X 2TB | 1144 | 273,66 | 219 |
| Transcend SSD 250H 2TB | 1052 | 253,67 | 240 |
| Transcend SSD 250S 2TB | 1030 | 250,11 | 247 |
| WD Blue SN580 1TB | 971 | 233,96 | 260 |
| Kioxia Exceria Pro 2TB | 925 | 224,88 | 275 |
| Lexar NM620 1TB | 795 | 190,31 | 315 |
| Kingston NV2 2TB | 780 | 201,15 | 346 |
| WD_BLACK SN770 1TB | 710 | 179,45 | 373 |
| Corsair MP600 Mini 1TB | 576 | 142,68 | 453 |
| Patriot Viper 400 1TB | 548 | 137,34 | 479 |
| Lexar NM620 2TB | 530 | 125,43 | 498 |
| Kingston NV2 1TB | 511 | 128,51 | 516 |
| Samsung 980 1TB | 357 | 90,37 | 742 |
| Kingston Fury Renegade 2TB | 820 | 197,88 | 820 |
Advertentie