Great Value

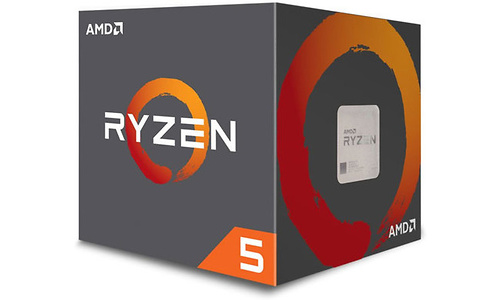
AMD Ryzen 5 1600 Boxed

Prijsverloop

Dit product is niet (meer) verkrijgbaar bij de bij Hardware Info aangesloten shops.

Specificaties

Belangrijkste specificaties

CPU-socket Socket AM4
Klokfrequentie 3,2 GHz
Aantal cores totaal 6 cores
Thermal design power 65 W
Geïntegreerde GPU

Processor

Processorserie Ryzen 5
CPU-core Summit Ridge
CPU-socket Socket AM4
Klokfrequentie 3,2 GHz
Max. turbo klokfrequentie 3,6 GHz
Aantal cores totaal 6 cores
Aantal threads 12
HyperThreading / SMT
Multiplier 32 x
Multiplier unlocked
Bussnelheid / bClk 100 MHz
Geïntegreerde geheugencontroller DDR4-2667 (Dual Channel)
Thermal design power 65 W
Productie-procedé 14 nm
Die-grootte 213 mm²
Aantal transistors 4.800 mln
Aantal PCIe lanes 20
Uitvoering Boxed
Koeler meegeleverd

Geheugencontroller

Geïntegreerde geheugencontroller
Geheugentype DDR4
Geheugensnelheid 2.667 MHz
Geheugenkanalen 2

Video

Geïntegreerde GPU

Cache

L2-cache 3.072 kB
L3-cache 16 MB

Instructieset

IA-64
MMX
SSE
SSE2
SSE3
SSE4A
SSE4.1
SSE4.2
x86-64
XD-bit
AVX
AVX2
AES-NI

Productcodes

SKU YD1600BBAEBOX, 54548775
EAN 0730143308397, 7106787079529
Toegevoegd aan Hardware Info dinsdag 21 maart 2017

Testresultaten

Dit product is door Hardware Info getest op maandag 25 maart 2019.

Benchmarks 2020 (5950X @ 4.65GHz)

Total War: Warhammer III 1920x1080 Medium 136,1 fps
Testconfiguratie
  • Ryzen 9 5950X @ 4.65GHz, 32GB DDR4
  • 3600C16, MSI X570 Godlike, Samsung 970 Evo 1TB+Kioxia Exceria Plus 2TB, Windows 10 Pro x64
Total War: Warhammer III 1920x1080 Medium (99p) 12,78 ms
Testconfiguratie
  • Ryzen 9 5950X @ 4.65GHz, 32GB DDR4
  • 3600C16, MSI X570 Godlike, Samsung 970 Evo 1TB+Kioxia Exceria Plus 2TB, Windows 10 Pro x64
Total War: Warhammer III 1920x1080 Medium (99.9p) 14,3 ms
Testconfiguratie
  • Ryzen 9 5950X @ 4.65GHz, 32GB DDR4
  • 3600C16, MSI X570 Godlike, Samsung 970 Evo 1TB+Kioxia Exceria Plus 2TB, Windows 10 Pro x64
Total War: Warhammer III 1920x1080 Ultra 78,9 fps
Testconfiguratie
  • Ryzen 9 5950X @ 4.65GHz, 32GB DDR4
  • 3600C16, MSI X570 Godlike, Samsung 970 Evo 1TB+Kioxia Exceria Plus 2TB, Windows 10 Pro x64
Total War: Warhammer III 1920x1080 Ultra (99p) 20,83 ms
Testconfiguratie
  • Ryzen 9 5950X @ 4.65GHz, 32GB DDR4
  • 3600C16, MSI X570 Godlike, Samsung 970 Evo 1TB+Kioxia Exceria Plus 2TB, Windows 10 Pro x64
Total War: Warhammer III 1920x1080 Ultra (99.9p) 23,28 ms
Testconfiguratie
  • Ryzen 9 5950X @ 4.65GHz, 32GB DDR4
  • 3600C16, MSI X570 Godlike, Samsung 970 Evo 1TB+Kioxia Exceria Plus 2TB, Windows 10 Pro x64

Testresultaten RX 6900 XT

Red Dead 2 - 1920x1080 - Medium - Vulkan 97,6
Testconfiguratie
  • CPU Test 2021
  • 1
Red Dead 2 - 1920x1080 - Medium - Vulkan (99p) 14,47
Testconfiguratie
  • CPU Test 2021
  • 1
Red Dead 2 - 1920x1080 - Medium - Vulkan (99.9p) 24,58
Testconfiguratie
  • CPU Test 2021
  • 1
Red Dead 2 - 1920x1080 - Ultra - Vulkan 98,1
Testconfiguratie
  • CPU Test 2021
  • 1
Red Dead 2 - 1920x1080 - Ultra - Vulkan (99p) 14,71
Testconfiguratie
  • CPU Test 2021
  • 1
Red Dead 2 - 1920x1080 - Ultra - Vulkan (99.9p) 24,59
Testconfiguratie
  • CPU Test 2021
  • 1
Red Dead 2 - 3840x2160 - Medium - Vulkan 98,3
Testconfiguratie
  • CPU Test 2021
  • 1
Red Dead 2 - 3840x2160 - Medium - Vulkan (99p) 14,22
Testconfiguratie
  • CPU Test 2021
  • 1
Red Dead 2 - 3840x2160 - Medium - Vulkan (99.9p) 23,32
Testconfiguratie
  • CPU Test 2021
  • 1
Red Dead 2 - 3840x2160 - Ultra - Vulkan 93,7
Testconfiguratie
  • CPU Test 2021
  • 1
Red Dead 2 - 3840x2160 - Ultra - Vulkan (99p) 14,85
Testconfiguratie
  • CPU Test 2021
  • 1
Red Dead 2 - 3840x2160 - Ultra - Vulkan (99.9p) 26,53
Testconfiguratie
  • CPU Test 2021
  • 1
Metro Exodus - 1920x1080 - Medium 122,4
Testconfiguratie
  • CPU Test 2021
  • 1
Metro Exodus - 1920x1080 - Medium (99p) 14,94
Testconfiguratie
  • CPU Test 2021
  • 1
Metro Exodus - 1920x1080 - Medium (99.9p) 16,31
Testconfiguratie
  • CPU Test 2021
  • 1
Metro Exodus - 1920x1080 - Ultra 118,1
Testconfiguratie
  • CPU Test 2021
  • 1
Metro Exodus - 1920x1080 - Ultra (99p) 15,13
Testconfiguratie
  • CPU Test 2021
  • 1
Metro Exodus - 1920x1080 - Ultra (99.9p) 16,5
Testconfiguratie
  • CPU Test 2021
  • 1
Metro Exodus - 3840x2160 - Medium 92,4
Testconfiguratie
  • CPU Test 2021
  • 1
Metro Exodus - 3840x2160 - Medium (99p) 19,61
Testconfiguratie
  • CPU Test 2021
  • 1
Metro Exodus - 3840x2160 - Medium (99.9p) 21,32
Testconfiguratie
  • CPU Test 2021
  • 1
Metro Exodus - 3840x2160 - Ultra 88,8
Testconfiguratie
  • CPU Test 2021
  • 1
Metro Exodus - 3840x2160 - Ultra (99p) 19,9
Testconfiguratie
  • CPU Test 2021
  • 1
Metro Exodus - 3840x2160 - Ultra (99.9p) 21,37
Testconfiguratie
  • CPU Test 2021
  • 1
F1 2021 - 1920x1080 - Medium 174,2
Testconfiguratie
  • CPU Test 2021
  • 1
F1 2021 - 1920x1080 - Medium (99p) 8,2
Testconfiguratie
  • CPU Test 2021
  • 1
F1 2021 - 1920x1080 - Medium (99.9p) 9,2
Testconfiguratie
  • CPU Test 2021
  • 1
F1 2021 - 1920x1080 - Ultra 131,5
Testconfiguratie
  • CPU Test 2021
  • 1
F1 2021 - 1920x1080 - Ultra (99p) 9,7
Testconfiguratie
  • CPU Test 2021
  • 1
F1 2021 - 1920x1080 - Ultra (99.9p) 11,8
Testconfiguratie
  • CPU Test 2021
  • 1
Streaming (x264 6Mbit + F1 2021 1080p ultra 60fps) - gemid. 22,93
Testconfiguratie
  • CPU Test 2021
  • 1
Far Cry 6 - 1920x1080 - Medium 68,8
Testconfiguratie
  • CPU Test 2022
Far Cry 6 - 1920x1080 - Medium (99p) 20,5
Testconfiguratie
  • CPU Test 2022
Far Cry 6 - 1920x1080 - Medium (99.9p) 26,64
Testconfiguratie
  • CPU Test 2022
Far Cry 6 - 1920x1080 - Ultra 59
Testconfiguratie
  • CPU Test 2022
Far Cry 6 - 1920x1080 - Ultra (99p) 25,12
Testconfiguratie
  • CPU Test 2022
Far Cry 6 - 1920x1080 - Ultra (99.9p) 31,51
Testconfiguratie
  • CPU Test 2022

Testresultaten (Met geïnt. GPU of GTX 1650)

Cinebench R23 - Single 942,84
Testconfiguratie
  • CPU Test 2021
  • 1
Cinebench R23 - Multi 6.496,16
Testconfiguratie
  • CPU Test 2021
  • 1
Corona Render 192 sec.
Testconfiguratie
  • CPU Test 2021
  • 1
Adobe Photoshop bewerking 182 sec.
Testconfiguratie
  • CPU Test 2021
  • 1
Adobe Premiere Pro HWI TV 4K 1.015 sec.
Testconfiguratie
  • CPU Test 2021
  • 1
Da Vinci Resolve - 4K Video 653 sec.
Testconfiguratie
  • CPU Test 2021
  • 1
StaxRip x264 48,91 fps
Testconfiguratie
  • CPU Test 2021
  • 1
StaxRip x265 9,48 fps
Testconfiguratie
  • CPU Test 2021
  • 1
Flac - 1 uur WAV naar Flac 253 sec.
Testconfiguratie
  • CPU Test 2021
  • 1
Chrome : Jetstream 2 125.267
Testconfiguratie
  • CPU Test 2021
  • 1
MozillaBuild - Firefox compile 2.257
Testconfiguratie
  • CPU Test 2021
  • 1
AIDA64 - Zlib 468
Testconfiguratie
  • CPU Test 2021
  • 1
AIDA64 - AES 44.804
Testconfiguratie
  • CPU Test 2021
  • 1
AIDA64 - Hash 15.378
Testconfiguratie
  • CPU Test 2021
  • 1
AIDA64 - SHA3 1.415
Testconfiguratie
  • CPU Test 2021
  • 1
AIDA64 - Julia 26.356
Testconfiguratie
  • CPU Test 2021
  • 1
AIDA64 - Mandel 13.822
Testconfiguratie
  • CPU Test 2021
  • 1
AIDA64 - FP32 Raytrace 5.333
Testconfiguratie
  • CPU Test 2021
  • 1
AIDA64 - FP64 Raytrace 2.790
Testconfiguratie
  • CPU Test 2021
  • 1
Systeemverbruik Cinebench 23 140 W
Testconfiguratie
  • CPU Test 2021
  • 1
Blender - Italian Flat Render 1.508 sec.
Testconfiguratie
  • CPU Test 2022
7-Zip - 15GB inpakken 726 sec.
Testconfiguratie
  • CPU Test 2022

Testresultaten 2018 (Windows 10) - Geïnt. GPU of GTX 1050 Ti

Cinebench 10 (Multi-CPU, 32-bit) 24.932
Testconfiguratie
  • CPU Test 2018
  • Geïnt. videokaart (GTX 1050 Ti bij CPU's zonder iGPU)
  • Windows 10
  • High performance energie profiel (tenzij anders aangegeven)
Cinebench 15 Single Threaded 145
Testconfiguratie
  • CPU Test 2018
  • Geïnt. videokaart (GTX 1050 Ti bij CPU's zonder iGPU)
  • Windows 10
  • High performance energie profiel (tenzij anders aangegeven)
Cinebench 15 Multi Threaded 1.076
Testconfiguratie
  • CPU Test 2018
  • Geïnt. videokaart (GTX 1050 Ti bij CPU's zonder iGPU)
  • Windows 10
  • High performance energie profiel (tenzij anders aangegeven)
Cinebench 20 Single Threaded 315
Testconfiguratie
  • CPU Test 2018
  • Geïnt. videokaart (GTX 1050 Ti bij CPU's zonder iGPU)
  • Windows 10
  • High performance energie profiel (tenzij anders aangegeven)
Cinebench 20 Multi Threaded 2.429
Testconfiguratie
  • CPU Test 2018
  • Geïnt. videokaart (GTX 1050 Ti bij CPU's zonder iGPU)
  • Windows 10
  • High performance energie profiel (tenzij anders aangegeven)
Blender 2.79b 109 sec.
Testconfiguratie
  • CPU Test 2018
  • Geïnt. videokaart (GTX 1050 Ti bij CPU's zonder iGPU)
  • Windows 10
  • High performance energie profiel (tenzij anders aangegeven)
AIDA64 (5.97) - Zlib 450,9 MB/s
Testconfiguratie
  • CPU Test 2018
  • Geïnt. videokaart (GTX 1050 Ti bij CPU's zonder iGPU)
  • Windows 10
  • High performance energie profiel (tenzij anders aangegeven)
AIDA64 (5.97) - AES 42.497 MB/s
Testconfiguratie
  • CPU Test 2018
  • Geïnt. videokaart (GTX 1050 Ti bij CPU's zonder iGPU)
  • Windows 10
  • High performance energie profiel (tenzij anders aangegeven)
AIDA64 (5.97) - Hash 14.493 MB/s
Testconfiguratie
  • CPU Test 2018
  • Geïnt. videokaart (GTX 1050 Ti bij CPU's zonder iGPU)
  • Windows 10
  • High performance energie profiel (tenzij anders aangegeven)
AIDA64 (5.97) - Julia 24.999
Testconfiguratie
  • CPU Test 2018
  • Geïnt. videokaart (GTX 1050 Ti bij CPU's zonder iGPU)
  • Windows 10
  • High performance energie profiel (tenzij anders aangegeven)
AIDA64 (5.97) - Mandel 13.082
Testconfiguratie
  • CPU Test 2018
  • Geïnt. videokaart (GTX 1050 Ti bij CPU's zonder iGPU)
  • Windows 10
  • High performance energie profiel (tenzij anders aangegeven)
Geekbench 4.2.3 - CPU Single-Core 3.901
Testconfiguratie
  • CPU Test 2018
  • Geïnt. videokaart (GTX 1050 Ti bij CPU's zonder iGPU)
  • Windows 10
  • High performance energie profiel (tenzij anders aangegeven)
Geekbench 4.2.3 - CPU Multi-Core 19.068
Testconfiguratie
  • CPU Test 2018
  • Geïnt. videokaart (GTX 1050 Ti bij CPU's zonder iGPU)
  • Windows 10
  • High performance energie profiel (tenzij anders aangegeven)
Geekbench 4.2.3 - CPU Single-Core - Crypto 5.175
Testconfiguratie
  • CPU Test 2018
  • Geïnt. videokaart (GTX 1050 Ti bij CPU's zonder iGPU)
  • Windows 10
  • High performance energie profiel (tenzij anders aangegeven)
Geekbench 4.2.3 - CPU Single-Core - Integer 3.551
Testconfiguratie
  • CPU Test 2018
  • Geïnt. videokaart (GTX 1050 Ti bij CPU's zonder iGPU)
  • Windows 10
  • High performance energie profiel (tenzij anders aangegeven)
Geekbench 4.2.3 - CPU Single-Core - Floating Point 3.431
Testconfiguratie
  • CPU Test 2018
  • Geïnt. videokaart (GTX 1050 Ti bij CPU's zonder iGPU)
  • Windows 10
  • High performance energie profiel (tenzij anders aangegeven)
Adobe Lightroom CC - Export 77 sec.
Testconfiguratie
  • CPU Test 2018
  • Geïnt. videokaart (GTX 1050 Ti bij CPU's zonder iGPU)
  • Windows 10
  • High performance energie profiel (tenzij anders aangegeven)
Adobe Photoshop CC - Panorama 45 sec.
Testconfiguratie
  • CPU Test 2018
  • Geïnt. videokaart (GTX 1050 Ti bij CPU's zonder iGPU)
  • Windows 10
  • High performance energie profiel (tenzij anders aangegeven)
Adobe Photoshop CC - Fotobewerking 100 sec.
Testconfiguratie
  • CPU Test 2018
  • Geïnt. videokaart (GTX 1050 Ti bij CPU's zonder iGPU)
  • Windows 10
  • High performance energie profiel (tenzij anders aangegeven)
Adobe Premiere Pro CC - 4K HWI TV 1.230 sec.
Testconfiguratie
  • CPU Test 2018
  • Geïnt. videokaart (GTX 1050 Ti bij CPU's zonder iGPU)
  • Windows 10
  • High performance energie profiel (tenzij anders aangegeven)
Staxrip - x264 (r2901) 76,8 fps
Testconfiguratie
  • CPU Test 2018
  • Geïnt. videokaart (GTX 1050 Ti bij CPU's zonder iGPU)
  • Windows 10
  • High performance energie profiel (tenzij anders aangegeven)
Staxrip - x265 (2.8.24) 26,5 fps
Testconfiguratie
  • CPU Test 2018
  • Geïnt. videokaart (GTX 1050 Ti bij CPU's zonder iGPU)
  • Windows 10
  • High performance energie profiel (tenzij anders aangegeven)
Flac - 1 uur WAV naar Flac 291 sec.
Testconfiguratie
  • CPU Test 2018
  • Geïnt. videokaart (GTX 1050 Ti bij CPU's zonder iGPU)
  • Windows 10
  • High performance energie profiel (tenzij anders aangegeven)
Microsoft Word 2016 - 1000 pagina's naar PDF 73 sec.
Testconfiguratie
  • CPU Test 2018
  • Geïnt. videokaart (GTX 1050 Ti bij CPU's zonder iGPU)
  • Windows 10
  • High performance energie profiel (tenzij anders aangegeven)
Microsoft Excel 2016 - Monte Carlo 11,61 sec.
Testconfiguratie
  • CPU Test 2018
  • Geïnt. videokaart (GTX 1050 Ti bij CPU's zonder iGPU)
  • Windows 10
  • High performance energie profiel (tenzij anders aangegeven)
Winrar 5.60 - 4GB inpakken 377 sec.
Testconfiguratie
  • CPU Test 2018
  • Geïnt. videokaart (GTX 1050 Ti bij CPU's zonder iGPU)
  • Windows 10
  • High performance energie profiel (tenzij anders aangegeven)
7-Zip v18.05 - 4GB inpakken 248 sec.
Testconfiguratie
  • CPU Test 2018
  • Geïnt. videokaart (GTX 1050 Ti bij CPU's zonder iGPU)
  • Windows 10
  • High performance energie profiel (tenzij anders aangegeven)
Chrome 67 - Jetstream 158,98
Testconfiguratie
  • CPU Test 2018
  • Geïnt. videokaart (GTX 1050 Ti bij CPU's zonder iGPU)
  • Windows 10
  • High performance energie profiel (tenzij anders aangegeven)
Chrome 75 - Jetstream 2 99,01
Testconfiguratie
  • CPU Test 2018
  • Geïnt. videokaart (GTX 1050 Ti bij CPU's zonder iGPU)
  • Windows 10
  • High performance energie profiel (tenzij anders aangegeven)
Systeemverbruik - Cinebench 15 - Max 109 W
Testconfiguratie
  • CPU Test 2018
  • Geïnt. videokaart (GTX 1050 Ti bij CPU's zonder iGPU)
  • Windows 10
  • High performance energie profiel (tenzij anders aangegeven)

Testresultaten 2018 (Windows 10) - GTX 1080 Ti

Far Cry 5 – 1920x1080 – Medium 96 fps
Testconfiguratie
  • CPU Test 2018
  • Icm. GeForce GTX 1080 Ti
  • Windows 10
  • High performance energie profiel
Far Cry 5 – 1920x1080 – Ultra 86 fps
Testconfiguratie
  • CPU Test 2018
  • Icm. GeForce GTX 1080 Ti
  • Windows 10
  • High performance energie profiel
Assassin’s Creed: Origins – 1920x1080 – Medium 81 fps
Testconfiguratie
  • CPU Test 2018
  • Icm. GeForce GTX 1080 Ti
  • Windows 10
  • High performance energie profiel
Assassin’s Creed: Origins – 1920x1080 – Ultra 71 fps
Testconfiguratie
  • CPU Test 2018
  • Icm. GeForce GTX 1080 Ti
  • Windows 10
  • High performance energie profiel
The Witcher 3: Blood & Wine - 1920x1080 - Medium 184,3 fps
Testconfiguratie
  • CPU Test 2018
  • Icm. GeForce GTX 1080 Ti
  • Windows 10
  • High performance energie profiel
The Witcher 3: Blood & Wine - 1920x1080 - Ultra 110,5 fps
Testconfiguratie
  • CPU Test 2018
  • Icm. GeForce GTX 1080 Ti
  • Windows 10
  • High performance energie profiel
GTA V - 1920x1080 – Medium 96,6 fps
Testconfiguratie
  • CPU Test 2018
  • Icm. GeForce GTX 1080 Ti
  • Windows 10
  • High performance energie profiel
GTA V - 1920x1080 - Ultra (2x MSAA, 2x Refl. MSAA) 70,9 fps
Testconfiguratie
  • CPU Test 2018
  • Icm. GeForce GTX 1080 Ti
  • Windows 10
  • High performance energie profiel
Battlefield 1 (DX11) - 1920x1080 – Medium 127,4 fps
Testconfiguratie
  • CPU Test 2018
  • Icm. GeForce GTX 1080 Ti
  • Windows 10
  • High performance energie profiel
Battlefield 1 (DX11) - 1920x1080 – Ultra 124,5 fps
Testconfiguratie
  • CPU Test 2018
  • Icm. GeForce GTX 1080 Ti
  • Windows 10
  • High performance energie profiel
Rise of the Tombraider (DX12) - 1920x1080 - Medium 127,6 fps
Testconfiguratie
  • CPU Test 2018
  • Icm. GeForce GTX 1080 Ti
  • Windows 10
  • High performance energie profiel
Rise of the Tombraider (DX12) - 1920x1080 - Ultra 114,7 fps
Testconfiguratie
  • CPU Test 2018
  • Icm. GeForce GTX 1080 Ti
  • Windows 10
  • High performance energie profiel
The Division (DX12) - 1920x1080 - Medium 162,6 fps
Testconfiguratie
  • CPU Test 2018
  • Icm. GeForce GTX 1080 Ti
  • Windows 10
  • High performance energie profiel
The Division (DX12) - 1920x1080 - Ultra 131,6 fps
Testconfiguratie
  • CPU Test 2018
  • Icm. GeForce GTX 1080 Ti
  • Windows 10
  • High performance energie profiel

Testresultaten 2018 (Windows 10) - GTX 1080 Ti - Frametimes

The Witcher 3: Blood & Wine - 1920x1080 - Medium (99p) 7,4 ms
Testconfiguratie
  • CPU Test 2018
  • Icm. GeForce GTX 1080 Ti
  • Windows 10
  • High performance energie profiel
The Witcher 3: Blood & Wine - 1920x1080 - Ultra (99p) 18,6 ms
Testconfiguratie
  • CPU Test 2018
  • Icm. GeForce GTX 1080 Ti
  • Windows 10
  • High performance energie profiel
GTA V - 1920x1080 - Medium (99p) 17 ms
Testconfiguratie
  • CPU Test 2018
  • Icm. GeForce GTX 1080 Ti
  • Windows 10
  • High performance energie profiel
GTA V - 1920x1080 - Ultra (2x MSAA, 2xRefl. MSAA) (99p) 20 ms
Testconfiguratie
  • CPU Test 2018
  • Icm. GeForce GTX 1080 Ti
  • Windows 10
  • High performance energie profiel
Battlefield 1 (DX11) - 1920x1080 - Medium (99p) 12,2 ms
Testconfiguratie
  • CPU Test 2018
  • Icm. GeForce GTX 1080 Ti
  • Windows 10
  • High performance energie profiel
Battlefield 1 (DX11) - 1920x1080 - Ultra (99p) 13,8 ms
Testconfiguratie
  • CPU Test 2018
  • Icm. GeForce GTX 1080 Ti
  • Windows 10
  • High performance energie profiel
Rise of the Tombraider (DX12) - 1920x1080 - Medium (99p) 13,9 ms
Testconfiguratie
  • CPU Test 2018
  • Icm. GeForce GTX 1080 Ti
  • Windows 10
  • High performance energie profiel
Rise of the Tombraider (DX12) - 1920x1080 - Ultra (99p) 13,5 ms
Testconfiguratie
  • CPU Test 2018
  • Icm. GeForce GTX 1080 Ti
  • Windows 10
  • High performance energie profiel

Stroomverbruik 2019 (Enkel CPU)

Stroomverbruik idle - Minimaal 6,23 W
Testconfiguratie
  • Stroomverbruik processors (enkel CPU) (2019)
Stroomverbruik idle - Gemiddelde 5 min. 6,96 W
Testconfiguratie
  • Stroomverbruik processors (enkel CPU) (2019)
Stroomverbruik - Cinebench 15 - Gemiddeld 63,7 W
Testconfiguratie
  • Stroomverbruik processors (enkel CPU) (2019)
Stroomverbruik - Cinebench 15 - Maximaal 69,06 W
Testconfiguratie
  • Stroomverbruik processors (enkel CPU) (2019)
Adobe Premiere Pro - Verbruik - Gemiddeld 55,3 W
Testconfiguratie
  • Stroomverbruik processors (enkel CPU) (2019)
Adobe Premiere Pro - Verbruik - Totaal (Wh) 18,92 Wh
Testconfiguratie
  • Stroomverbruik processors (enkel CPU) (2019)

Testresultaten 2017 (Windows 10) - Geïnt. GPU of GTX 1050 Ti

Cinebench 10 (Multi-CPU, 32-bit) 26.656
Testconfiguratie
  • CPU Test 2017
  • Geïnt. videokaart (GTX 1050 Ti bij CPU's zonder iGPU)
  • Windows 10
  • High performance energie profiel (tenzij anders aangegeven)
Cinebench 15 Single Threaded 143
Testconfiguratie
  • CPU Test 2017
  • Geïnt. videokaart (GTX 1050 Ti bij CPU's zonder iGPU)
  • Windows 10
  • High performance energie profiel (tenzij anders aangegeven)
Cinebench 15 Multi Threaded 1.139
Testconfiguratie
  • CPU Test 2017
  • Geïnt. videokaart (GTX 1050 Ti bij CPU's zonder iGPU)
  • Windows 10
  • High performance energie profiel (tenzij anders aangegeven)
Cinebench 15 Multi Threaded (Energie profiel balanced) 1.135
Testconfiguratie
  • CPU Test 2017
  • Geïnt. videokaart (GTX 1050 Ti bij CPU's zonder iGPU)
  • Windows 10
  • High performance energie profiel (tenzij anders aangegeven)
Cinebench 15 multi-core schaling 132,8 %
Testconfiguratie
  • CPU Test 2017
  • Geïnt. videokaart (GTX 1050 Ti bij CPU's zonder iGPU)
  • Windows 10
  • High performance energie profiel (tenzij anders aangegeven)
Blender 2.78c 106 sec.
Testconfiguratie
  • CPU Test 2017
  • Geïnt. videokaart (GTX 1050 Ti bij CPU's zonder iGPU)
  • Windows 10
  • High performance energie profiel (tenzij anders aangegeven)
AIDA64 (5.90.4247) - Zlib 468,6 MB/s
Testconfiguratie
  • CPU Test 2017
  • Geïnt. videokaart (GTX 1050 Ti bij CPU's zonder iGPU)
  • Windows 10
  • High performance energie profiel (tenzij anders aangegeven)
AIDA64 (5.90.4247) - AES 45.235 MB/s
Testconfiguratie
  • CPU Test 2017
  • Geïnt. videokaart (GTX 1050 Ti bij CPU's zonder iGPU)
  • Windows 10
  • High performance energie profiel (tenzij anders aangegeven)
AIDA64 (5.90.4247) - Hash 15.349 MB/s
Testconfiguratie
  • CPU Test 2017
  • Geïnt. videokaart (GTX 1050 Ti bij CPU's zonder iGPU)
  • Windows 10
  • High performance energie profiel (tenzij anders aangegeven)
AIDA64 (5.90.4247) - VP8 7.102
Testconfiguratie
  • CPU Test 2017
  • Geïnt. videokaart (GTX 1050 Ti bij CPU's zonder iGPU)
  • Windows 10
  • High performance energie profiel (tenzij anders aangegeven)
AIDA64 (5.90.4247) - Julia 25.782
Testconfiguratie
  • CPU Test 2017
  • Geïnt. videokaart (GTX 1050 Ti bij CPU's zonder iGPU)
  • Windows 10
  • High performance energie profiel (tenzij anders aangegeven)
AIDA64 (5.90.4247) - Mandel 13.400
Testconfiguratie
  • CPU Test 2017
  • Geïnt. videokaart (GTX 1050 Ti bij CPU's zonder iGPU)
  • Windows 10
  • High performance energie profiel (tenzij anders aangegeven)
PCMark 10 - Score 4.792
Testconfiguratie
  • CPU Test 2017
  • Geïnt. videokaart (GTX 1050 Ti bij CPU's zonder iGPU)
  • Windows 10
  • High performance energie profiel (tenzij anders aangegeven)
PCMark 10 - Essentials 8.174
Testconfiguratie
  • CPU Test 2017
  • Geïnt. videokaart (GTX 1050 Ti bij CPU's zonder iGPU)
  • Windows 10
  • High performance energie profiel (tenzij anders aangegeven)
PCMark 10 - Productivity 7.111
Testconfiguratie
  • CPU Test 2017
  • Geïnt. videokaart (GTX 1050 Ti bij CPU's zonder iGPU)
  • Windows 10
  • High performance energie profiel (tenzij anders aangegeven)
PCMark 10 - Digital Content Creation 5.138
Testconfiguratie
  • CPU Test 2017
  • Geïnt. videokaart (GTX 1050 Ti bij CPU's zonder iGPU)
  • Windows 10
  • High performance energie profiel (tenzij anders aangegeven)
PCMark 8 - Home 4.308
Testconfiguratie
  • CPU Test 2017
  • Geïnt. videokaart (GTX 1050 Ti bij CPU's zonder iGPU)
  • Windows 10
  • High performance energie profiel (tenzij anders aangegeven)
PCMark 8 - Creativity 4.917
Testconfiguratie
  • CPU Test 2017
  • Geïnt. videokaart (GTX 1050 Ti bij CPU's zonder iGPU)
  • Windows 10
  • High performance energie profiel (tenzij anders aangegeven)
PCMark 8 - Work 3.583
Testconfiguratie
  • CPU Test 2017
  • Geïnt. videokaart (GTX 1050 Ti bij CPU's zonder iGPU)
  • Windows 10
  • High performance energie profiel (tenzij anders aangegeven)
Adobe Lightroom 6 - Export 35 sec.
Testconfiguratie
  • CPU Test 2017
  • Geïnt. videokaart (GTX 1050 Ti bij CPU's zonder iGPU)
  • Windows 10
  • High performance energie profiel (tenzij anders aangegeven)
Adobe Photoshop CC 2017 - Panorama 46 sec.
Testconfiguratie
  • CPU Test 2017
  • Geïnt. videokaart (GTX 1050 Ti bij CPU's zonder iGPU)
  • Windows 10
  • High performance energie profiel (tenzij anders aangegeven)
Adobe Photoshop CC 2017 - Fotobewerking 98 sec.
Testconfiguratie
  • CPU Test 2017
  • Geïnt. videokaart (GTX 1050 Ti bij CPU's zonder iGPU)
  • Windows 10
  • High performance energie profiel (tenzij anders aangegeven)
Adobe Premiere Pro 2017 - 4K HWI TV 198 sec.
Testconfiguratie
  • CPU Test 2017
  • Geïnt. videokaart (GTX 1050 Ti bij CPU's zonder iGPU)
  • Windows 10
  • High performance energie profiel (tenzij anders aangegeven)
Staxrip - x264 80,05 fps
Testconfiguratie
  • CPU Test 2017
  • Geïnt. videokaart (GTX 1050 Ti bij CPU's zonder iGPU)
  • Windows 10
  • High performance energie profiel (tenzij anders aangegeven)
Staxrip - x265 28,14 fps
Testconfiguratie
  • CPU Test 2017
  • Geïnt. videokaart (GTX 1050 Ti bij CPU's zonder iGPU)
  • Windows 10
  • High performance energie profiel (tenzij anders aangegeven)
Flac - 1 uur WAV naar Flac 271 sec.
Testconfiguratie
  • CPU Test 2017
  • Geïnt. videokaart (GTX 1050 Ti bij CPU's zonder iGPU)
  • Windows 10
  • High performance energie profiel (tenzij anders aangegeven)
Microsoft Word 2016 - 1000 pagina's naar PDF 67 sec.
Testconfiguratie
  • CPU Test 2017
  • Geïnt. videokaart (GTX 1050 Ti bij CPU's zonder iGPU)
  • Windows 10
  • High performance energie profiel (tenzij anders aangegeven)
Microsoft Excel 2016 - Monte Carlo 2,9 sec.
Testconfiguratie
  • CPU Test 2017
  • Geïnt. videokaart (GTX 1050 Ti bij CPU's zonder iGPU)
  • Windows 10
  • High performance energie profiel (tenzij anders aangegeven)
Winrar 5.40 - 2GB inpakken 98 sec.
Testconfiguratie
  • CPU Test 2017
  • Geïnt. videokaart (GTX 1050 Ti bij CPU's zonder iGPU)
  • Windows 10
  • High performance energie profiel (tenzij anders aangegeven)
7-Zip - 2GB inpakken 136 sec.
Testconfiguratie
  • CPU Test 2017
  • Geïnt. videokaart (GTX 1050 Ti bij CPU's zonder iGPU)
  • Windows 10
  • High performance energie profiel (tenzij anders aangegeven)
Chrome 58 - Jetstream 192,56
Testconfiguratie
  • CPU Test 2017
  • Geïnt. videokaart (GTX 1050 Ti bij CPU's zonder iGPU)
  • Windows 10
  • High performance energie profiel (tenzij anders aangegeven)
Stroomverbruik - Cinebench 15 - Max 109 W
Testconfiguratie
  • CPU Test 2017
  • Geïnt. videokaart (GTX 1050 Ti bij CPU's zonder iGPU)
  • Windows 10
  • High performance energie profiel (tenzij anders aangegeven)
Stroomverbruik - Cinebench 15 - Max (Energie prof. balanced) 109 W
Testconfiguratie
  • CPU Test 2017
  • Geïnt. videokaart (GTX 1050 Ti bij CPU's zonder iGPU)
  • Windows 10
  • High performance energie profiel (tenzij anders aangegeven)
Stroomverbruik idle - Gemiddelde 5 min. 37,2 W
Testconfiguratie
  • CPU Test 2017
  • Geïnt. videokaart (GTX 1050 Ti bij CPU's zonder iGPU)
  • Windows 10
  • High performance energie profiel (tenzij anders aangegeven)
Stroomverbruik idle - Gemiddelde 5 min.(Energie pr. balanced 34,8 W
Testconfiguratie
  • CPU Test 2017
  • Geïnt. videokaart (GTX 1050 Ti bij CPU's zonder iGPU)
  • Windows 10
  • High performance energie profiel (tenzij anders aangegeven)
Stroomverbruik Premiere Pro - 4K HWI TV - Verbruik 5,8 Wh
Testconfiguratie
  • CPU Test 2017
  • Geïnt. videokaart (GTX 1050 Ti bij CPU's zonder iGPU)
  • Windows 10
  • High performance energie profiel (tenzij anders aangegeven)
Stroomverbruik Premiere Pro - 4K HWI TV - Gemiddeld 105,5 W
Testconfiguratie
  • CPU Test 2017
  • Geïnt. videokaart (GTX 1050 Ti bij CPU's zonder iGPU)
  • Windows 10
  • High performance energie profiel (tenzij anders aangegeven)
Perf. / Watt - Cinebench 15 10,4 cb/W
Testconfiguratie
  • CPU Test 2017
  • Geïnt. videokaart (GTX 1050 Ti bij CPU's zonder iGPU)
  • Windows 10
  • High performance energie profiel (tenzij anders aangegeven)

Testresultaten 2017 (Windows 10) - GTX 1080 Ti

Prey - 1920x1080 - Medium 196,9 fps
Testconfiguratie
  • CPU Test 2017
  • In combinatie met GeForce GTX 1080 Ti
  • Windows 10
  • High performance energie profiel
Prey - 1920x1080 - Ultra 175,3 fps
Testconfiguratie
  • CPU Test 2017
  • In combinatie met GeForce GTX 1080 Ti
  • Windows 10
  • High performance energie profiel
GTA V - 1920x1080 - Medium 102,5 fps
Testconfiguratie
  • CPU Test 2017
  • In combinatie met GeForce GTX 1080 Ti
  • Windows 10
  • High performance energie profiel
GTA V - 1920x1080 - Ultra (2x MSAA, 0x Refl. MSAA) 52,8 fps
Testconfiguratie
  • CPU Test 2017
  • In combinatie met GeForce GTX 1080 Ti
  • Windows 10
  • High performance energie profiel
Battlefield 1 (DX12) - 1920x1080 - Medium 132,9 fps
Testconfiguratie
  • CPU Test 2017
  • In combinatie met GeForce GTX 1080 Ti
  • Windows 10
  • High performance energie profiel
Battlefield 1 (DX12) - 1920x1080 - Ultra 112,3 fps
Testconfiguratie
  • CPU Test 2017
  • In combinatie met GeForce GTX 1080 Ti
  • Windows 10
  • High performance energie profiel
Doom (Vulkan) - 1920x1080 - Medium 200 fps
Testconfiguratie
  • CPU Test 2017
  • In combinatie met GeForce GTX 1080 Ti
  • Windows 10
  • High performance energie profiel
Doom (Vulkan) - 1920x1080 - Ultra 200 fps
Testconfiguratie
  • CPU Test 2017
  • In combinatie met GeForce GTX 1080 Ti
  • Windows 10
  • High performance energie profiel
Rise of the Tombraider (DX12) - 1920x1080 - Medium 152,8 fps
Testconfiguratie
  • CPU Test 2017
  • In combinatie met GeForce GTX 1080 Ti
  • Windows 10
  • High performance energie profiel
Rise of the Tombraider (DX12) - 1920x1080 - Ultra 130,5 fps
Testconfiguratie
  • CPU Test 2017
  • In combinatie met GeForce GTX 1080 Ti
  • Windows 10
  • High performance energie profiel
The Division (DX12) - 1920x1080 - Medium 159,3 fps
Testconfiguratie
  • CPU Test 2017
  • In combinatie met GeForce GTX 1080 Ti
  • Windows 10
  • High performance energie profiel
The Division (DX12) - 1920x1080 - Ultra 124,4 fps
Testconfiguratie
  • CPU Test 2017
  • In combinatie met GeForce GTX 1080 Ti
  • Windows 10
  • High performance energie profiel
Stroomverbruik - Cinebench 15 - Max 114 W
Testconfiguratie
  • CPU Test 2017
  • In combinatie met GeForce GTX 1080 Ti
  • Windows 10
  • High performance energie profiel
Stroomverbruik idle - Gemiddelde 5 min. 42,0 W
Testconfiguratie
  • CPU Test 2017
  • In combinatie met GeForce GTX 1080 Ti
  • Windows 10
  • High performance energie profiel

Testresultaten 2017 (Windows 10) - GTX 1080 Ti - Frametimes

Prey - 1920x1080 - Medium (99p) 7,5 ms
Testconfiguratie
  • CPU Test 2017
  • In combinatie met GeForce GTX 1080 Ti
  • Windows 10
  • High performance energie profiel
Prey - 1920x1080 - Ultra (99p) 8,1 ms
Testconfiguratie
  • CPU Test 2017
  • In combinatie met GeForce GTX 1080 Ti
  • Windows 10
  • High performance energie profiel
GTA V - 1920x1080 - Medium (99p) 14 ms
Testconfiguratie
  • CPU Test 2017
  • In combinatie met GeForce GTX 1080 Ti
  • Windows 10
  • High performance energie profiel
GTA V - 1920x1080 - Ultra (2x MSAA, 0xRefl. MSAA) (99p) 31 ms
Testconfiguratie
  • CPU Test 2017
  • In combinatie met GeForce GTX 1080 Ti
  • Windows 10
  • High performance energie profiel
Battlefield 1 (DX12) - 1920x1080 - Medium (99p) 13 ms
Testconfiguratie
  • CPU Test 2017
  • In combinatie met GeForce GTX 1080 Ti
  • Windows 10
  • High performance energie profiel
Battlefield 1 (DX12) - 1920x1080 - Ultra (99p) 12,4 ms
Testconfiguratie
  • CPU Test 2017
  • In combinatie met GeForce GTX 1080 Ti
  • Windows 10
  • High performance energie profiel
Doom (Vulkan) - 1920x1080 - Medium (99p) 5,5 ms
Testconfiguratie
  • CPU Test 2017
  • In combinatie met GeForce GTX 1080 Ti
  • Windows 10
  • High performance energie profiel
Doom (Vulkan) - 1920x1080 - Ultra (99p) 5,7 ms
Testconfiguratie
  • CPU Test 2017
  • In combinatie met GeForce GTX 1080 Ti
  • Windows 10
  • High performance energie profiel
Prey - 1920x1080 - Medium (min. FPS 99p) 133,3 fps
Testconfiguratie
  • CPU Test 2017
  • In combinatie met GeForce GTX 1080 Ti
  • Windows 10
  • High performance energie profiel
Prey - 1920x1080 - Ultra (min. FPS 99p) 123,5 fps
Testconfiguratie
  • CPU Test 2017
  • In combinatie met GeForce GTX 1080 Ti
  • Windows 10
  • High performance energie profiel
GTA V - 1920x1080 - Medium (min. FPS 99p) 71,4 fps
Testconfiguratie
  • CPU Test 2017
  • In combinatie met GeForce GTX 1080 Ti
  • Windows 10
  • High performance energie profiel
GTA V - 1920x1080 - Ultra (2x MSAA, 0xRefl. MSAA) (min. FPS 32,3 fps
Testconfiguratie
  • CPU Test 2017
  • In combinatie met GeForce GTX 1080 Ti
  • Windows 10
  • High performance energie profiel
Battlefield 1 (DX12) - 1920x1080 - Medium (min. FPS 99p) 76,9 fps
Testconfiguratie
  • CPU Test 2017
  • In combinatie met GeForce GTX 1080 Ti
  • Windows 10
  • High performance energie profiel
Battlefield 1 (DX12) - 1920x1080 - Ultra (min. FPS 99p) 80,6 fps
Testconfiguratie
  • CPU Test 2017
  • In combinatie met GeForce GTX 1080 Ti
  • Windows 10
  • High performance energie profiel
Doom (Vulkan) - 1920x1080 - Medium (min. FPS 99p) 181,8 fps
Testconfiguratie
  • CPU Test 2017
  • In combinatie met GeForce GTX 1080 Ti
  • Windows 10
  • High performance energie profiel
Doom (Vulkan) - 1920x1080 - Ultra (min. FPS 99p) 175,4 fps
Testconfiguratie
  • CPU Test 2017
  • In combinatie met GeForce GTX 1080 Ti
  • Windows 10
  • High performance energie profiel

Testresultaten 2016 (Windows 10) - Geïnt. GPU of GTX 750 Ti

Cinebench 10 (Multi-CPU, 32-bit) 25.410
Testconfiguratie
  • CPU Test 2016
  • Geïnt. videokaart (GTX 750 Ti bij CPU's zonder iGPU)
  • Windows 10
Cinebench 15 Single Threaded 149
Testconfiguratie
  • CPU Test 2016
  • Geïnt. videokaart (GTX 750 Ti bij CPU's zonder iGPU)
  • Windows 10
Cinebench 15 Multi Threaded 1.145
Testconfiguratie
  • CPU Test 2016
  • Geïnt. videokaart (GTX 750 Ti bij CPU's zonder iGPU)
  • Windows 10
AIDA64 - Zlib 467,5 MB/s
Testconfiguratie
  • CPU Test 2016
  • Geïnt. videokaart (GTX 750 Ti bij CPU's zonder iGPU)
  • Windows 10
AIDA64 - AES 1.952 MB/s
Testconfiguratie
  • CPU Test 2016
  • Geïnt. videokaart (GTX 750 Ti bij CPU's zonder iGPU)
  • Windows 10
AIDA64 - Hash 3.774 MB/s
Testconfiguratie
  • CPU Test 2016
  • Geïnt. videokaart (GTX 750 Ti bij CPU's zonder iGPU)
  • Windows 10
AIDA64 - VP8 7.049
Testconfiguratie
  • CPU Test 2016
  • Geïnt. videokaart (GTX 750 Ti bij CPU's zonder iGPU)
  • Windows 10
AIDA64 - Julia 16.902
Testconfiguratie
  • CPU Test 2016
  • Geïnt. videokaart (GTX 750 Ti bij CPU's zonder iGPU)
  • Windows 10
AIDA64 - Mandel 7.711
Testconfiguratie
  • CPU Test 2016
  • Geïnt. videokaart (GTX 750 Ti bij CPU's zonder iGPU)
  • Windows 10
Handbrake - 30 min. 1080p (x264) 123,24 fps
Testconfiguratie
  • CPU Test 2016
  • Geïnt. videokaart (GTX 750 Ti bij CPU's zonder iGPU)
  • Windows 10
Handbrake - 30 min. 1080p (x265) 33,61 fps
Testconfiguratie
  • CPU Test 2016
  • Geïnt. videokaart (GTX 750 Ti bij CPU's zonder iGPU)
  • Windows 10
Adobe Photoshop CC 2015 - HWI Bench 34 sec.
Testconfiguratie
  • CPU Test 2016
  • Geïnt. videokaart (GTX 750 Ti bij CPU's zonder iGPU)
  • Windows 10
Adobe Premiere CC 2015 - HWI Bench (zonder versnelling) 312 sec.
Testconfiguratie
  • CPU Test 2016
  • Geïnt. videokaart (GTX 750 Ti bij CPU's zonder iGPU)
  • Windows 10
7Zip - Encoding benchmark 24.480 kByte/s
Testconfiguratie
  • CPU Test 2016
  • Geïnt. videokaart (GTX 750 Ti bij CPU's zonder iGPU)
  • Windows 10
WinRAR 5.20 - Encoding benchmark 3.534 kByte/s
Testconfiguratie
  • CPU Test 2016
  • Geïnt. videokaart (GTX 750 Ti bij CPU's zonder iGPU)
  • Windows 10
Word 2016 - 1000 pagina's PDF 63 sec.
Testconfiguratie
  • CPU Test 2016
  • Geïnt. videokaart (GTX 750 Ti bij CPU's zonder iGPU)
  • Windows 10
Excel 2016 - Monte Carlo 3,094 sec.
Testconfiguratie
  • CPU Test 2016
  • Geïnt. videokaart (GTX 750 Ti bij CPU's zonder iGPU)
  • Windows 10
Google Chrome 44 - Mozilla Kraken 1.1 910,1 ms
Testconfiguratie
  • CPU Test 2016
  • Geïnt. videokaart (GTX 750 Ti bij CPU's zonder iGPU)
  • Windows 10
Stroomverbruik - Cinebench 15 - Max 132 W
Testconfiguratie
  • CPU Test 2016
  • Geïnt. videokaart (GTX 750 Ti bij CPU's zonder iGPU)
  • Windows 10
Stroomverbruik idle - Gemiddelde 5 min. 55,2 W
Testconfiguratie
  • CPU Test 2016
  • Geïnt. videokaart (GTX 750 Ti bij CPU's zonder iGPU)
  • Windows 10

Testresultaten 2016 (Windows 10) - I.c.m. GTX 960

F1 2015 - 1920x1080 - Medium 77,6 fps
Testconfiguratie
  • CPU Test 2016
  • In combinatie met GeForce GTX 960
  • Windows 10
F1 2015 - 1920x1080 - Ultra 52,4 fps
Testconfiguratie
  • CPU Test 2016
  • In combinatie met GeForce GTX 960
  • Windows 10
GTA V - 1920x1080 - Medium 100,4 fps
Testconfiguratie
  • CPU Test 2016
  • In combinatie met GeForce GTX 960
  • Windows 10
GTA V - 1920x1080 - Ultra(4x AA, 0x Refl. AA) 20,3 fps
Testconfiguratie
  • CPU Test 2016
  • In combinatie met GeForce GTX 960
  • Windows 10
Mad Max - 1920x1080 - Medium 96,6 fps
Testconfiguratie
  • CPU Test 2016
  • In combinatie met GeForce GTX 960
  • Windows 10
Mad Max - 1920x1080 - Ultra 67,1 fps
Testconfiguratie
  • CPU Test 2016
  • In combinatie met GeForce GTX 960
  • Windows 10
Gemiddelde fps (GTX 960) 61,4
Testconfiguratie
  • CPU Test 2016
  • In combinatie met GeForce GTX 960
  • Windows 10
Stroomverbruik idle - Gemiddelde 5 min. 62,4 W
Testconfiguratie
  • CPU Test 2016
  • In combinatie met GeForce GTX 960
  • Windows 10
Stroomverbruik - Cinebench 15 - Max 136 W
Testconfiguratie
  • CPU Test 2016
  • In combinatie met GeForce GTX 960
  • Windows 10

Testresultaten 2016 (Windows 10) - I.c.m. GTX 980

F1 2015 - 1920x1080 - Medium 144,9 fps
Testconfiguratie
  • CPU Test 2016
  • In combinatie met GeForce GTX 980
  • Windows 10
F1 2015 - 1920x1080 - Ultra 98,3 fps
Testconfiguratie
  • CPU Test 2016
  • In combinatie met GeForce GTX 980
  • Windows 10
GTA V - 1920x1080 - Medium 99,4 fps
Testconfiguratie
  • CPU Test 2016
  • In combinatie met GeForce GTX 980
  • Windows 10
GTA V - 1920x1080 - Ultra(4x AA, 0x Refl. AA) 33,9 fps
Testconfiguratie
  • CPU Test 2016
  • In combinatie met GeForce GTX 980
  • Windows 10
Mad Max - 1920x1080 - Medium 171,6 fps
Testconfiguratie
  • CPU Test 2016
  • In combinatie met GeForce GTX 980
  • Windows 10
Mad Max - 1920x1080 - Ultra 121 fps
Testconfiguratie
  • CPU Test 2016
  • In combinatie met GeForce GTX 980
  • Windows 10
Gemiddelde fps (GTX 980) 99,9
Testconfiguratie
  • CPU Test 2016
  • In combinatie met GeForce GTX 980
  • Windows 10

Stroomverbruik 2017 (Enkel CPU)

Idle - Verbruik 0,053 Ah
Testconfiguratie
  • Stroomverbruik processors (enkel CPU)
Stroomverbruik idle - Gemiddelde 5 min. 7,6 W
Testconfiguratie
  • Stroomverbruik processors (enkel CPU)
Cinebench 15 - Load - Verbruik 0,05 Ah
Testconfiguratie
  • Stroomverbruik processors (enkel CPU)
Stroomverbruik - Cinebench 15 - Gemiddeld 56,8 W
Testconfiguratie
  • Stroomverbruik processors (enkel CPU)
Adobe Premiere Pro - Verbruik 0,288 Ah
Testconfiguratie
  • Stroomverbruik processors (enkel CPU)
Stroomverbruik Premiere Pro - 4K HWI TV - Gemiddeld 60,7 W
Testconfiguratie
  • Stroomverbruik processors (enkel CPU)

Reviews

Processors

42 AMD en Intel CPU's review: wat is de beste processor?

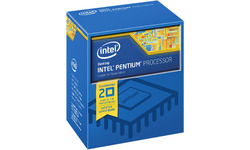
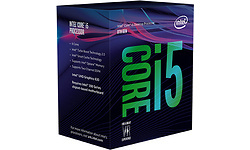
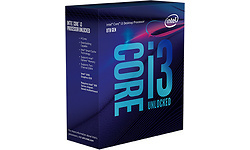
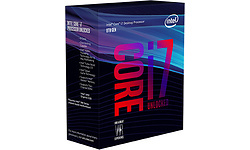
AMD en Intel concurreerden in 2017 weer met elkaar, met aan de lopende band nieuwe processors. Tijd om de balans op te maken: welke processor moet je kopen voor welk gebruiksdoeleinde? Met dit artikel weet je welke CPU voor jou de beste is!

10 maart 2018 05:59
Processors

AMD Ryzen 5 1400 en 1600 review: bang for your buck

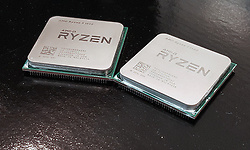
In de AMD Ryzen 5-serie zijn er ook enkele goedkopere modellen, die bepaalde features missen en simpelweg lager geklokt zijn. Maakt hun vriendelijke prijs dat goed, of kun je toch beter even doorsparen?

13 juli 2017 05:59
Processors

AMD Ryzen 5 1500X en 1600X video review

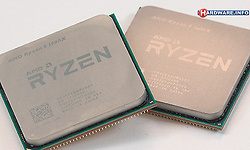
Na de Ryzen 7 chips die AMD eerder dit jaar introduceerde, was het vorige week tijd voor de goedkopere Ryzen 5 chips. Deze processors moeten het opnemen tegen Intel's Core i5 modellen, en de vraag is natuurlijk hoe goed AMD het doet in dit middensegment. 

17 april 2017 15:02

Alternatieven

AMD Ryzen 7 1800X Boxed

  • Socket AM4
  • 3.6 GHz
  • 8 cores
  • 95 W
 

AMD Ryzen 7 1700 Boxed

  • Socket AM4
  • 3.0 GHz
  • 8 cores
  • 65 W
 

AMD Ryzen 5 2600 Boxed

  • Socket AM4
  • 3.4 GHz
  • 6 cores
  • 65 W
 

AMD Ryzen 7 2700X Boxed

  • Socket AM4
  • 3.7 GHz
  • 8 cores
  • 105 W
 

Intel Core i7 6700K Boxed

  • Socket 1151
  • 4 GHz
  • 4 cores
  • 95 W
  • Geïntegreerde GPU
 

Intel Pentium G4560 Boxed

  • Socket 1151
  • 3.5 GHz
  • 2 cores
  • 54 W
  • Geïntegreerde GPU
 

Intel Core i5 8400 Boxed

  • Socket 1151
  • 2.8 GHz
  • 6 cores
  • 65 W
  • Geïntegreerde GPU
 

Intel Core i3 8350K Boxed

  • Socket 1151
  • 4.0 GHz
  • 4 cores
  • 91 W
  • Geïntegreerde GPU
 

Intel Core i7 8700K Boxed

  • Socket 1151
  • 3.7 GHz
  • 6 cores
  • 95 W
  • Geïntegreerde GPU
 

Intel Core i5 8600K Boxed

  • Socket 1151
  • 3.6 GHz
  • 6 cores
  • 95 W
  • Geïntegreerde GPU
 

Intel Core i9 7900X Boxed

  • Socket 2066
  • 3.3 GHz
  • 10 cores
  • 140 W
 

AMD Ryzen 7 2700 Boxed

  • Socket AM4
  • 3.2 GHz
  • 8 cores
  • 65 W
 
0