Getest

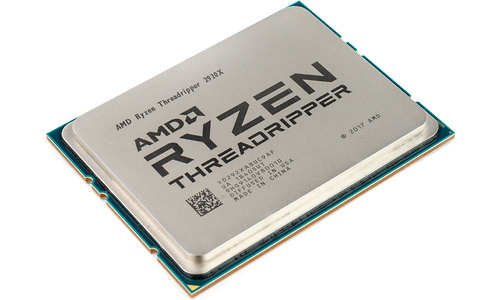
AMD Ryzen Threadripper 2970WX Boxed

Prijsverloop

Dit product is niet (meer) verkrijgbaar bij de bij Hardware Info aangesloten shops.

Specificaties

Belangrijkste specificaties

CPU-socket Socket TR4
Klokfrequentie 3 GHz
Aantal cores totaal 24 cores
Thermal design power 250 W
Geïntegreerde GPU

Processor

Processorserie Ryzen Threadripper
CPU-core Pinnacle Ridge
CPU-socket Socket TR4
Klokfrequentie 3 GHz
Alle cores turbo klokfrequentie 3,55 GHz
Max. turbo klokfrequentie 4,2 GHz
Aantal cores totaal 24 cores
Aantal threads 48
HyperThreading / SMT
Multiplier 30 x
Multiplier unlocked
Bussnelheid / bClk 100 MHz
Geïntegreerde geheugencontroller DDR4-2933 (Quad Channel)
Thermal design power 250 W
Productie-procedé 12 nm
Die-grootte 852 mm²
Aantal PCIe lanes 64
Uitvoering Boxed
Koeler meegeleverd

Geheugencontroller

Geïntegreerde geheugencontroller
Geheugentype DDR4
Geheugensnelheid 2.933 MHz
Geheugenkanalen 4

Video

Geïntegreerde GPU

Cache

L2-cache 12.288 kB
L3-cache 64 MB

Instructieset

IA-64
MMX
SSE
SSE2
SSE3
SSE4A
SSE4.1
SSE4.2
x86-64
XD-bit
AVX
AVX2
AVX-512
AES-NI

Productcodes

SKU YD297XAZAFWOF
EAN 0730143309400
Toegevoegd aan Hardware Info vrijdag 24 augustus 2018

Testresultaten

Dit product is door Hardware Info getest op maandag 29 oktober 2018.

Testresultaten 2018 (Windows 10) - Geïnt. GPU of GTX 1050 Ti

Cinebench 10 (Multi-CPU, 32-bit) 38.101
Testconfiguratie
  • CPU Test 2018
  • Geïnt. videokaart (GTX 1050 Ti bij CPU's zonder iGPU)
  • Windows 10
  • High performance energie profiel (tenzij anders aangegeven)
Cinebench 15 Single Threaded 170
Testconfiguratie
  • CPU Test 2018
  • Geïnt. videokaart (GTX 1050 Ti bij CPU's zonder iGPU)
  • Windows 10
  • High performance energie profiel (tenzij anders aangegeven)
Cinebench 15 Multi Threaded 4.361
Testconfiguratie
  • CPU Test 2018
  • Geïnt. videokaart (GTX 1050 Ti bij CPU's zonder iGPU)
  • Windows 10
  • High performance energie profiel (tenzij anders aangegeven)
Cinebench 20 Single Threaded 426
Testconfiguratie
  • CPU Test 2018
  • Geïnt. videokaart (GTX 1050 Ti bij CPU's zonder iGPU)
  • Windows 10
  • High performance energie profiel (tenzij anders aangegeven)
Cinebench 20 Multi Threaded 9.682
Testconfiguratie
  • CPU Test 2018
  • Geïnt. videokaart (GTX 1050 Ti bij CPU's zonder iGPU)
  • Windows 10
  • High performance energie profiel (tenzij anders aangegeven)
Blender 2.79b 31,35 sec.
Testconfiguratie
  • CPU Test 2018
  • Geïnt. videokaart (GTX 1050 Ti bij CPU's zonder iGPU)
  • Windows 10
  • High performance energie profiel (tenzij anders aangegeven)
AIDA64 (5.97) - Zlib 1.961,5 MB/s
Testconfiguratie
  • CPU Test 2018
  • Geïnt. videokaart (GTX 1050 Ti bij CPU's zonder iGPU)
  • Windows 10
  • High performance energie profiel (tenzij anders aangegeven)
AIDA64 (5.97) - AES 185.057 MB/s
Testconfiguratie
  • CPU Test 2018
  • Geïnt. videokaart (GTX 1050 Ti bij CPU's zonder iGPU)
  • Windows 10
  • High performance energie profiel (tenzij anders aangegeven)
AIDA64 (5.97) - Hash 64.151 MB/s
Testconfiguratie
  • CPU Test 2018
  • Geïnt. videokaart (GTX 1050 Ti bij CPU's zonder iGPU)
  • Windows 10
  • High performance energie profiel (tenzij anders aangegeven)
AIDA64 (5.97) - Julia 110.728
Testconfiguratie
  • CPU Test 2018
  • Geïnt. videokaart (GTX 1050 Ti bij CPU's zonder iGPU)
  • Windows 10
  • High performance energie profiel (tenzij anders aangegeven)
AIDA64 (5.97) - Mandel 58.073
Testconfiguratie
  • CPU Test 2018
  • Geïnt. videokaart (GTX 1050 Ti bij CPU's zonder iGPU)
  • Windows 10
  • High performance energie profiel (tenzij anders aangegeven)
Geekbench 4.2.3 - CPU Single-Core 4.866
Testconfiguratie
  • CPU Test 2018
  • Geïnt. videokaart (GTX 1050 Ti bij CPU's zonder iGPU)
  • Windows 10
  • High performance energie profiel (tenzij anders aangegeven)
Geekbench 4.2.3 - CPU Multi-Core 32.217
Testconfiguratie
  • CPU Test 2018
  • Geïnt. videokaart (GTX 1050 Ti bij CPU's zonder iGPU)
  • Windows 10
  • High performance energie profiel (tenzij anders aangegeven)
Geekbench 4.2.3 - CPU Single-Core - Crypto 6.277
Testconfiguratie
  • CPU Test 2018
  • Geïnt. videokaart (GTX 1050 Ti bij CPU's zonder iGPU)
  • Windows 10
  • High performance energie profiel (tenzij anders aangegeven)
Geekbench 4.2.3 - CPU Single-Core - Integer 4.520
Testconfiguratie
  • CPU Test 2018
  • Geïnt. videokaart (GTX 1050 Ti bij CPU's zonder iGPU)
  • Windows 10
  • High performance energie profiel (tenzij anders aangegeven)
Geekbench 4.2.3 - CPU Single-Core - Floating Point 4.495
Testconfiguratie
  • CPU Test 2018
  • Geïnt. videokaart (GTX 1050 Ti bij CPU's zonder iGPU)
  • Windows 10
  • High performance energie profiel (tenzij anders aangegeven)
Adobe Lightroom CC - Export 41,9 sec.
Testconfiguratie
  • CPU Test 2018
  • Geïnt. videokaart (GTX 1050 Ti bij CPU's zonder iGPU)
  • Windows 10
  • High performance energie profiel (tenzij anders aangegeven)
Adobe Photoshop CC - Panorama 39,8 sec.
Testconfiguratie
  • CPU Test 2018
  • Geïnt. videokaart (GTX 1050 Ti bij CPU's zonder iGPU)
  • Windows 10
  • High performance energie profiel (tenzij anders aangegeven)
Adobe Photoshop CC - Fotobewerking 54,4 sec.
Testconfiguratie
  • CPU Test 2018
  • Geïnt. videokaart (GTX 1050 Ti bij CPU's zonder iGPU)
  • Windows 10
  • High performance energie profiel (tenzij anders aangegeven)
Adobe Premiere Pro CC - 4K HWI TV 746 sec.
Testconfiguratie
  • CPU Test 2018
  • Geïnt. videokaart (GTX 1050 Ti bij CPU's zonder iGPU)
  • Windows 10
  • High performance energie profiel (tenzij anders aangegeven)
Staxrip - x264 (r2901) 144,03 fps
Testconfiguratie
  • CPU Test 2018
  • Geïnt. videokaart (GTX 1050 Ti bij CPU's zonder iGPU)
  • Windows 10
  • High performance energie profiel (tenzij anders aangegeven)
Staxrip - x265 (2.8.24) 47,41 fps
Testconfiguratie
  • CPU Test 2018
  • Geïnt. videokaart (GTX 1050 Ti bij CPU's zonder iGPU)
  • Windows 10
  • High performance energie profiel (tenzij anders aangegeven)
Flac - 1 uur WAV naar Flac 229 sec.
Testconfiguratie
  • CPU Test 2018
  • Geïnt. videokaart (GTX 1050 Ti bij CPU's zonder iGPU)
  • Windows 10
  • High performance energie profiel (tenzij anders aangegeven)
Microsoft Word 2016 - 1000 pagina's naar PDF 66,4 sec.
Testconfiguratie
  • CPU Test 2018
  • Geïnt. videokaart (GTX 1050 Ti bij CPU's zonder iGPU)
  • Windows 10
  • High performance energie profiel (tenzij anders aangegeven)
Microsoft Excel 2016 - Monte Carlo 11,021 sec.
Testconfiguratie
  • CPU Test 2018
  • Geïnt. videokaart (GTX 1050 Ti bij CPU's zonder iGPU)
  • Windows 10
  • High performance energie profiel (tenzij anders aangegeven)
Winrar 5.60 - 4GB inpakken 303 sec.
Testconfiguratie
  • CPU Test 2018
  • Geïnt. videokaart (GTX 1050 Ti bij CPU's zonder iGPU)
  • Windows 10
  • High performance energie profiel (tenzij anders aangegeven)
7-Zip v18.05 - 4GB inpakken 176 sec.
Testconfiguratie
  • CPU Test 2018
  • Geïnt. videokaart (GTX 1050 Ti bij CPU's zonder iGPU)
  • Windows 10
  • High performance energie profiel (tenzij anders aangegeven)
Chrome 67 - Jetstream 187,69
Testconfiguratie
  • CPU Test 2018
  • Geïnt. videokaart (GTX 1050 Ti bij CPU's zonder iGPU)
  • Windows 10
  • High performance energie profiel (tenzij anders aangegeven)
Chrome 75 - Jetstream 2 103,912
Testconfiguratie
  • CPU Test 2018
  • Geïnt. videokaart (GTX 1050 Ti bij CPU's zonder iGPU)
  • Windows 10
  • High performance energie profiel (tenzij anders aangegeven)
AIDA64 (6.00) - Zlib 1.999,2 MB/s
Testconfiguratie
  • CPU Test 2018
  • Geïnt. videokaart (GTX 1050 Ti bij CPU's zonder iGPU)
  • Windows 10
  • High performance energie profiel (tenzij anders aangegeven)
AIDA64 (6.00) - AES 185.565 MB/s
Testconfiguratie
  • CPU Test 2018
  • Geïnt. videokaart (GTX 1050 Ti bij CPU's zonder iGPU)
  • Windows 10
  • High performance energie profiel (tenzij anders aangegeven)
AIDA64 (6.00) - SHA3 6.081 MB/s
Testconfiguratie
  • CPU Test 2018
  • Geïnt. videokaart (GTX 1050 Ti bij CPU's zonder iGPU)
  • Windows 10
  • High performance energie profiel (tenzij anders aangegeven)
AIDA64 (6.00) - Julia 110.769
Testconfiguratie
  • CPU Test 2018
  • Geïnt. videokaart (GTX 1050 Ti bij CPU's zonder iGPU)
  • Windows 10
  • High performance energie profiel (tenzij anders aangegeven)
AIDA64 (6.00) - Mandel 58.083
Testconfiguratie
  • CPU Test 2018
  • Geïnt. videokaart (GTX 1050 Ti bij CPU's zonder iGPU)
  • Windows 10
  • High performance energie profiel (tenzij anders aangegeven)
Systeemverbruik - Cinebench 15 - Max 370 W
Testconfiguratie
  • CPU Test 2018
  • Geïnt. videokaart (GTX 1050 Ti bij CPU's zonder iGPU)
  • Windows 10
  • High performance energie profiel (tenzij anders aangegeven)

Testresultaten 2018 (Windows 10) - GTX 1080 Ti

Far Cry 5 – 1920x1080 – Medium 68 fps
Testconfiguratie
  • CPU Test 2018
  • Icm. GeForce GTX 1080 Ti
  • Windows 10
  • High performance energie profiel
Far Cry 5 – 1920x1080 – Ultra 65 fps
Testconfiguratie
  • CPU Test 2018
  • Icm. GeForce GTX 1080 Ti
  • Windows 10
  • High performance energie profiel
Assassin’s Creed: Origins – 1920x1080 – Medium 83 fps
Testconfiguratie
  • CPU Test 2018
  • Icm. GeForce GTX 1080 Ti
  • Windows 10
  • High performance energie profiel
Assassin’s Creed: Origins – 1920x1080 – Ultra 71 fps
Testconfiguratie
  • CPU Test 2018
  • Icm. GeForce GTX 1080 Ti
  • Windows 10
  • High performance energie profiel
The Witcher 3: Blood & Wine - 1920x1080 - Medium 200,4 fps
Testconfiguratie
  • CPU Test 2018
  • Icm. GeForce GTX 1080 Ti
  • Windows 10
  • High performance energie profiel
The Witcher 3: Blood & Wine - 1920x1080 - Ultra 111,6 fps
Testconfiguratie
  • CPU Test 2018
  • Icm. GeForce GTX 1080 Ti
  • Windows 10
  • High performance energie profiel
GTA V - 1920x1080 – Medium 84,3 fps
Testconfiguratie
  • CPU Test 2018
  • Icm. GeForce GTX 1080 Ti
  • Windows 10
  • High performance energie profiel
GTA V - 1920x1080 - Ultra (2x MSAA, 2x Refl. MSAA) 64,8 fps
Testconfiguratie
  • CPU Test 2018
  • Icm. GeForce GTX 1080 Ti
  • Windows 10
  • High performance energie profiel
Battlefield 1 (DX11) - 1920x1080 – Medium 158,1 fps
Testconfiguratie
  • CPU Test 2018
  • Icm. GeForce GTX 1080 Ti
  • Windows 10
  • High performance energie profiel
Battlefield 1 (DX11) - 1920x1080 – Ultra 136,4 fps
Testconfiguratie
  • CPU Test 2018
  • Icm. GeForce GTX 1080 Ti
  • Windows 10
  • High performance energie profiel
Rise of the Tombraider (DX12) - 1920x1080 - Medium 151,5 fps
Testconfiguratie
  • CPU Test 2018
  • Icm. GeForce GTX 1080 Ti
  • Windows 10
  • High performance energie profiel
Rise of the Tombraider (DX12) - 1920x1080 - Ultra 118,8 fps
Testconfiguratie
  • CPU Test 2018
  • Icm. GeForce GTX 1080 Ti
  • Windows 10
  • High performance energie profiel
The Division (DX12) - 1920x1080 - Medium 164,3 fps
Testconfiguratie
  • CPU Test 2018
  • Icm. GeForce GTX 1080 Ti
  • Windows 10
  • High performance energie profiel
The Division (DX12) - 1920x1080 - Ultra 128,1 fps
Testconfiguratie
  • CPU Test 2018
  • Icm. GeForce GTX 1080 Ti
  • Windows 10
  • High performance energie profiel

Testresultaten 2018 (Windows 10) - GTX 1080 Ti - Frametimes

The Witcher 3: Blood & Wine - 1920x1080 - Medium (99p) 7,9 ms
Testconfiguratie
  • CPU Test 2018
  • Icm. GeForce GTX 1080 Ti
  • Windows 10
  • High performance energie profiel
The Witcher 3: Blood & Wine - 1920x1080 - Ultra (99p) 18,4 ms
Testconfiguratie
  • CPU Test 2018
  • Icm. GeForce GTX 1080 Ti
  • Windows 10
  • High performance energie profiel
GTA V - 1920x1080 - Medium (99p) 21 ms
Testconfiguratie
  • CPU Test 2018
  • Icm. GeForce GTX 1080 Ti
  • Windows 10
  • High performance energie profiel
GTA V - 1920x1080 - Ultra (2x MSAA, 2xRefl. MSAA) (99p) 22 ms
Testconfiguratie
  • CPU Test 2018
  • Icm. GeForce GTX 1080 Ti
  • Windows 10
  • High performance energie profiel
Battlefield 1 (DX11) - 1920x1080 - Medium (99p) 10,5 ms
Testconfiguratie
  • CPU Test 2018
  • Icm. GeForce GTX 1080 Ti
  • Windows 10
  • High performance energie profiel
Battlefield 1 (DX11) - 1920x1080 - Ultra (99p) 12,2 ms
Testconfiguratie
  • CPU Test 2018
  • Icm. GeForce GTX 1080 Ti
  • Windows 10
  • High performance energie profiel
Rise of the Tombraider (DX12) - 1920x1080 - Medium (99p) 11,1 ms
Testconfiguratie
  • CPU Test 2018
  • Icm. GeForce GTX 1080 Ti
  • Windows 10
  • High performance energie profiel
Rise of the Tombraider (DX12) - 1920x1080 - Ultra (99p) 17,5 ms
Testconfiguratie
  • CPU Test 2018
  • Icm. GeForce GTX 1080 Ti
  • Windows 10
  • High performance energie profiel

Stroomverbruik 2019 (Enkel CPU)

Stroomverbruik idle - Minimaal 2,07 W
Testconfiguratie
  • Stroomverbruik processors (enkel CPU) (2019)
Stroomverbruik idle - Gemiddelde 5 min. 2,64 W
Testconfiguratie
  • Stroomverbruik processors (enkel CPU) (2019)
Stroomverbruik - Cinebench 15 - Gemiddeld 176,7 W
Testconfiguratie
  • Stroomverbruik processors (enkel CPU) (2019)
Stroomverbruik - Cinebench 15 - Maximaal 236,57 W
Testconfiguratie
  • Stroomverbruik processors (enkel CPU) (2019)
Adobe Premiere Pro - Verbruik - Gemiddeld 95,1 W
Testconfiguratie
  • Stroomverbruik processors (enkel CPU) (2019)
Adobe Premiere Pro - Verbruik - Totaal (Wh) 20,49 Wh
Testconfiguratie
  • Stroomverbruik processors (enkel CPU) (2019)

SpecWorkstation 3 (2018)

Media & Entertainment - Score 2,62
Testconfiguratie
  • CPU Test 2018
  • Workstation benchmarks
Media & Entertainment - CPU - Score 3,08
Testconfiguratie
  • CPU Test 2018
  • Workstation benchmarks
Media & Entertainment - CPU - Blender 2,29
Testconfiguratie
  • CPU Test 2018
  • Workstation benchmarks
Media & Entertainment - CPU - Handbrake 2,26
Testconfiguratie
  • CPU Test 2018
  • Workstation benchmarks
Media & Entertainment - CPU - LuxRender 5,66
Testconfiguratie
  • CPU Test 2018
  • Workstation benchmarks
Media & Entertainment - Graphics - Score 1,26
Testconfiguratie
  • CPU Test 2018
  • Workstation benchmarks
Media & Entertainment - Graphics - Maya-05 1,21
Testconfiguratie
  • CPU Test 2018
  • Workstation benchmarks
Media & Entertainment - Graphics - 3DSMax-06 1,31
Testconfiguratie
  • CPU Test 2018
  • Workstation benchmarks
Media & Entertainment - Storage - Score 3,36
Testconfiguratie
  • CPU Test 2018
  • Workstation benchmarks
Media & Entertainment - Storage - CCX 2,87
Testconfiguratie
  • CPU Test 2018
  • Workstation benchmarks
Media & Entertainment - Storage - SPECapcMaya 3,27
Testconfiguratie
  • CPU Test 2018
  • Workstation benchmarks
Media & Entertainment - Storage - MayaVenice 3,5
Testconfiguratie
  • CPU Test 2018
  • Workstation benchmarks
Media & Entertainment - Storage - MandE 3,01
Testconfiguratie
  • CPU Test 2018
  • Workstation benchmarks
Media & Entertainment - Storage - Handbrake 3,16
Testconfiguratie
  • CPU Test 2018
  • Workstation benchmarks
Media & Entertainment - Storage - 3DSM 4,57
Testconfiguratie
  • CPU Test 2018
  • Workstation benchmarks
Product Development - Score 2,09
Testconfiguratie
  • CPU Test 2018
  • Workstation benchmarks
Product Development - CPU - Score 2,35
Testconfiguratie
  • CPU Test 2018
  • Workstation benchmarks
Product Development - CPU - CalculiX 1
Testconfiguratie
  • CPU Test 2018
  • Workstation benchmarks
Product Development - CPU - WPCcfd 3,81
Testconfiguratie
  • CPU Test 2018
  • Workstation benchmarks
Product Development - CPU - RodiniaCFD 3,39
Testconfiguratie
  • CPU Test 2018
  • Workstation benchmarks
Product Development - Graphics - Score 0,45
Testconfiguratie
  • CPU Test 2018
  • Workstation benchmarks
Product Development - Graphics - Catia-05 0,52
Testconfiguratie
  • CPU Test 2018
  • Workstation benchmarks
Product Development - Graphics - Creo-02 0,55
Testconfiguratie
  • CPU Test 2018
  • Workstation benchmarks
Product Development - Graphics - SNX-03 0,09
Testconfiguratie
  • CPU Test 2018
  • Workstation benchmarks
Product Development - Graphics - SW-04 0,54
Testconfiguratie
  • CPU Test 2018
  • Workstation benchmarks
Product Development - Graphics - Showcase-02 1,26
Testconfiguratie
  • CPU Test 2018
  • Workstation benchmarks
Product Development - Storage - Score 6,88
Testconfiguratie
  • CPU Test 2018
  • Workstation benchmarks
Product Development - Storage - WpcCFD 7,34
Testconfiguratie
  • CPU Test 2018
  • Workstation benchmarks
Product Development - Storage - ProdDev 6,45
Testconfiguratie
  • CPU Test 2018
  • Workstation benchmarks
Life Sciences - Score 2,66
Testconfiguratie
  • CPU Test 2018
  • Workstation benchmarks
Life Sciences - CPU - Score 3,7
Testconfiguratie
  • CPU Test 2018
  • Workstation benchmarks
Life Sciences - CPU - Iammps 4,81
Testconfiguratie
  • CPU Test 2018
  • Workstation benchmarks
Life Sciences - CPU - Namd 4,72
Testconfiguratie
  • CPU Test 2018
  • Workstation benchmarks
Life Sciences - CPU - RodiniaLifeSci 2,24
Testconfiguratie
  • CPU Test 2018
  • Workstation benchmarks
Life Sciences - Graphics - Score 1,47
Testconfiguratie
  • CPU Test 2018
  • Workstation benchmarks
Life Sciences - Graphics - Medical-02 1,47
Testconfiguratie
  • CPU Test 2018
  • Workstation benchmarks
Life Sciences - Storage - Score 1,78
Testconfiguratie
  • CPU Test 2018
  • Workstation benchmarks
Life Sciences - Storage - Namd 2,27
Testconfiguratie
  • CPU Test 2018
  • Workstation benchmarks
Life Sciences - Storage - Iammps 1,4
Testconfiguratie
  • CPU Test 2018
  • Workstation benchmarks
Financial Services - Score 6,72
Testconfiguratie
  • CPU Test 2018
  • Workstation benchmarks
Financial Services - CPU - Score 6,72
Testconfiguratie
  • CPU Test 2018
  • Workstation benchmarks
Financial Services - CPU - FSI 6,72
Testconfiguratie
  • CPU Test 2018
  • Workstation benchmarks
Energy - Score 0,89
Testconfiguratie
  • CPU Test 2018
  • Workstation benchmarks
Energy - CPU - Score 0,72
Testconfiguratie
  • CPU Test 2018
  • Workstation benchmarks
Energy - CPU - Convolution 7,24
Testconfiguratie
  • CPU Test 2018
  • Workstation benchmarks
Energy - CPU -FFTW 1,46
Testconfiguratie
  • CPU Test 2018
  • Workstation benchmarks
Energy - CPU - Kirchhoff 2,55
Testconfiguratie
  • CPU Test 2018
  • Workstation benchmarks
Energy - CPU - Poisson 0,21
Testconfiguratie
  • CPU Test 2018
  • Workstation benchmarks
Energy - CPU - Srmp 0,03
Testconfiguratie
  • CPU Test 2018
  • Workstation benchmarks
Energy - Graphics - Score 0,53
Testconfiguratie
  • CPU Test 2018
  • Workstation benchmarks
Energy - Graphics - Energy-02 0,53
Testconfiguratie
  • CPU Test 2018
  • Workstation benchmarks
Energy - Storage - Score 4,48
Testconfiguratie
  • CPU Test 2018
  • Workstation benchmarks
Energy - Storage - Energy-02 4,48
Testconfiguratie
  • CPU Test 2018
  • Workstation benchmarks
General Operations - CPU - 7zip 1,53
Testconfiguratie
  • CPU Test 2018
  • Workstation benchmarks
General Operations - CPU - Python36 1,59
Testconfiguratie
  • CPU Test 2018
  • Workstation benchmarks
General Operations - Storage - Score 5,41
Testconfiguratie
  • CPU Test 2018
  • Workstation benchmarks
General Operations - Storage - MozillaVS 10,12
Testconfiguratie
  • CPU Test 2018
  • Workstation benchmarks
General Operations - Storage - Mcad 5
Testconfiguratie
  • CPU Test 2018
  • Workstation benchmarks
General Operations - Storage - IcePack 3,03
Testconfiguratie
  • CPU Test 2018
  • Workstation benchmarks
General Operations - Storage - 7z 5,6
Testconfiguratie
  • CPU Test 2018
  • Workstation benchmarks
GPU Compute - GPU - Score 1,41
Testconfiguratie
  • CPU Test 2018
  • Workstation benchmarks
GPU Compute - GPU - LuxRender 1,41
Testconfiguratie
  • CPU Test 2018
  • Workstation benchmarks

Stroomverbruik 2017 (Enkel CPU)

Idle - Verbruik 0,136 Ah
Testconfiguratie
  • Stroomverbruik processors (enkel CPU)
Stroomverbruik idle - Gemiddelde 5 min. 19,6 W
Testconfiguratie
  • Stroomverbruik processors (enkel CPU)
Cinebench 15 - Load - Verbruik 0,045 Ah
Testconfiguratie
  • Stroomverbruik processors (enkel CPU)
Stroomverbruik - Cinebench 15 - Gemiddeld 169,0 W
Testconfiguratie
  • Stroomverbruik processors (enkel CPU)
Adobe Premiere Pro (2018) - Verbruik 1,401 Ah
Testconfiguratie
  • Stroomverbruik processors (enkel CPU)
Stroomverbruik Premiere Pro (2018) - 4K HWI TV - Gemiddeld 53,6 W
Testconfiguratie
  • Stroomverbruik processors (enkel CPU)

Reviews

Processors

AMD Ryzen Threadripper 2920X & 2970WX review

Bij de introductie van AMD's Threadripper 2 werd al duidelijk dat er nog twee modellen op de planning stonden, maar we hebben tot vandaag moeten wachten vooraleer die daadwerkelijk verkrijgbaar werden.

29 oktober 2018 14:00

Alternatieven

AMD Ryzen Threadripper 2990WX Boxed

  • Socket TR4
  • 3.0 GHz
  • 32 cores
  • 250 W
 

AMD Ryzen Threadripper 2950X Boxed

  • Socket TR4
  • 3.5 GHz
  • 16 cores
  • 180 W
 

Intel Core i9 9900K Boxed

  • Socket 1151
  • 3.6 GHz
  • 8 cores
  • 95 W
  • Geïntegreerde GPU
 

AMD Ryzen Threadripper 2920X Boxed

  • Socket TR4
  • 3.5 GHz
  • 12 cores
  • 180 W
 

Intel Core i7 9700K Boxed

  • Socket 1151
  • 3.6 GHz
  • 8 cores
  • 95 W
  • Geïntegreerde GPU
 

AMD Ryzen 5 2600X Boxed

  • Socket AM4
  • 3.6 GHz
  • 6 cores
  • 95 W
 

AMD Ryzen 7 2700X Boxed

  • Socket AM4
  • 3.7 GHz
  • 8 cores
  • 105 W
 

Intel Core i5 8600K Boxed

  • Socket 1151
  • 3.6 GHz
  • 6 cores
  • 95 W
  • Geïntegreerde GPU
 

Intel Core i9 7980XE Boxed

  • Socket 2066
  • 2.6 GHz
  • 18 cores
  • 165 W
 

Intel Core i9 7900X Boxed

  • Socket 2066
  • 3.3 GHz
  • 10 cores
  • 140 W
 

AMD Ryzen 3 2200G Boxed

  • Socket AM4
  • 3.5 GHz
  • 4 cores
  • 65 W
  • Geïntegreerde GPU
 

AMD Athlon 200GE Boxed

  • Socket AM4
  • 3.2 GHz
  • 2 cores
  • 35 W
  • Geïntegreerde GPU
 
0