Ultimate

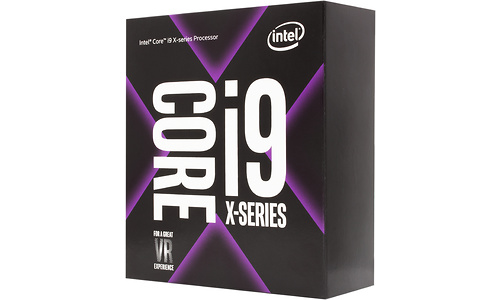
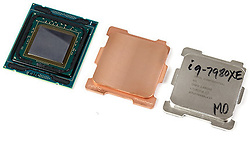
Intel Core i9 7980XE Boxed

Prijsverloop

Dit product is niet (meer) verkrijgbaar bij de bij Hardware Info aangesloten shops.

Specificaties

Belangrijkste specificaties

CPU-socket Socket 2066
Klokfrequentie 2,6 GHz
Aantal cores totaal 18 cores
Thermal design power 165 W
Geïntegreerde GPU

Processor

Processorserie Core i9
CPU-core Skylake-X
CPU-socket Socket 2066
Klokfrequentie 2,6 GHz
Alle cores turbo klokfrequentie 3,4 GHz
Max. turbo klokfrequentie 4,4 GHz
Aantal cores totaal 18 cores
Aantal threads 36
HyperThreading / SMT
Multiplier 26 x
Multiplier unlocked
Bussnelheid / bClk 100 MHz
Geïntegreerde geheugencontroller DDR4-2667 (Quad Channel)
Thermal design power 165 W
Productie-procedé 14 nm
Aantal PCIe lanes 44
Uitvoering Boxed
Koeler meegeleverd

Geheugencontroller

Geïntegreerde geheugencontroller
Geheugentype DDR4
Geheugensnelheid 2.667 MHz
Geheugenkanalen 4

Video

Geïntegreerde GPU

Cache

L2-cache 18.432 kB
L3-cache 24,75 MB

Instructieset

IA-64
MMX
SSE
SSE2
SSE3
SSE4A
SSE4.1
SSE4.2
x86-64
XD-bit
AVX
AVX2
AVX-512
AES-NI

Virtualisatie type

Intel VT-d
Intel VT-x

Productcodes

SKU BX80673I97980X
EAN 5032037114905, 0735858357487
Toegevoegd aan Hardware Info vrijdag 25 augustus 2017

Testresultaten

Dit product is door Hardware Info getest op woensdag 17 oktober 2018.

Testresultaten 2018 (Windows 10) - Geïnt. GPU of GTX 1050 Ti

Cinebench 10 (Multi-CPU, 32-bit) 51.287
Testconfiguratie
  • CPU Test 2018
  • Geïnt. videokaart (GTX 1050 Ti bij CPU's zonder iGPU)
  • Windows 10
  • High performance energie profiel (tenzij anders aangegeven)
Cinebench 15 Single Threaded 191
Testconfiguratie
  • CPU Test 2018
  • Geïnt. videokaart (GTX 1050 Ti bij CPU's zonder iGPU)
  • Windows 10
  • High performance energie profiel (tenzij anders aangegeven)
Cinebench 15 Multi Threaded 3.230
Testconfiguratie
  • CPU Test 2018
  • Geïnt. videokaart (GTX 1050 Ti bij CPU's zonder iGPU)
  • Windows 10
  • High performance energie profiel (tenzij anders aangegeven)
Cinebench 20 Single Threaded 446
Testconfiguratie
  • CPU Test 2018
  • Geïnt. videokaart (GTX 1050 Ti bij CPU's zonder iGPU)
  • Windows 10
  • High performance energie profiel (tenzij anders aangegeven)
Cinebench 20 Multi Threaded 7.902
Testconfiguratie
  • CPU Test 2018
  • Geïnt. videokaart (GTX 1050 Ti bij CPU's zonder iGPU)
  • Windows 10
  • High performance energie profiel (tenzij anders aangegeven)
Blender 2.79b 41,4 sec.
Testconfiguratie
  • CPU Test 2018
  • Geïnt. videokaart (GTX 1050 Ti bij CPU's zonder iGPU)
  • Windows 10
  • High performance energie profiel (tenzij anders aangegeven)
AIDA64 (5.97) - Zlib 1.311,3 MB/s
Testconfiguratie
  • CPU Test 2018
  • Geïnt. videokaart (GTX 1050 Ti bij CPU's zonder iGPU)
  • Windows 10
  • High performance energie profiel (tenzij anders aangegeven)
AIDA64 (5.97) - AES 66.809 MB/s
Testconfiguratie
  • CPU Test 2018
  • Geïnt. videokaart (GTX 1050 Ti bij CPU's zonder iGPU)
  • Windows 10
  • High performance energie profiel (tenzij anders aangegeven)
AIDA64 (5.97) - Hash 17.540 MB/s
Testconfiguratie
  • CPU Test 2018
  • Geïnt. videokaart (GTX 1050 Ti bij CPU's zonder iGPU)
  • Windows 10
  • High performance energie profiel (tenzij anders aangegeven)
AIDA64 (5.97) - Julia 134.893
Testconfiguratie
  • CPU Test 2018
  • Geïnt. videokaart (GTX 1050 Ti bij CPU's zonder iGPU)
  • Windows 10
  • High performance energie profiel (tenzij anders aangegeven)
AIDA64 (5.97) - Mandel 76.619
Testconfiguratie
  • CPU Test 2018
  • Geïnt. videokaart (GTX 1050 Ti bij CPU's zonder iGPU)
  • Windows 10
  • High performance energie profiel (tenzij anders aangegeven)
Geekbench 4.2.3 - CPU Single-Core 5.080
Testconfiguratie
  • CPU Test 2018
  • Geïnt. videokaart (GTX 1050 Ti bij CPU's zonder iGPU)
  • Windows 10
  • High performance energie profiel (tenzij anders aangegeven)
Geekbench 4.2.3 - CPU Multi-Core 38.659
Testconfiguratie
  • CPU Test 2018
  • Geïnt. videokaart (GTX 1050 Ti bij CPU's zonder iGPU)
  • Windows 10
  • High performance energie profiel (tenzij anders aangegeven)
Geekbench 4.2.3 - CPU Single-Core - Crypto 4.575
Testconfiguratie
  • CPU Test 2018
  • Geïnt. videokaart (GTX 1050 Ti bij CPU's zonder iGPU)
  • Windows 10
  • High performance energie profiel (tenzij anders aangegeven)
Geekbench 4.2.3 - CPU Single-Core - Integer 5.284
Testconfiguratie
  • CPU Test 2018
  • Geïnt. videokaart (GTX 1050 Ti bij CPU's zonder iGPU)
  • Windows 10
  • High performance energie profiel (tenzij anders aangegeven)
Geekbench 4.2.3 - CPU Single-Core - Floating Point 5.482
Testconfiguratie
  • CPU Test 2018
  • Geïnt. videokaart (GTX 1050 Ti bij CPU's zonder iGPU)
  • Windows 10
  • High performance energie profiel (tenzij anders aangegeven)
Adobe Lightroom CC - Export 39,1 sec.
Testconfiguratie
  • CPU Test 2018
  • Geïnt. videokaart (GTX 1050 Ti bij CPU's zonder iGPU)
  • Windows 10
  • High performance energie profiel (tenzij anders aangegeven)
Adobe Photoshop CC - Panorama 38,8 sec.
Testconfiguratie
  • CPU Test 2018
  • Geïnt. videokaart (GTX 1050 Ti bij CPU's zonder iGPU)
  • Windows 10
  • High performance energie profiel (tenzij anders aangegeven)
Adobe Photoshop CC - Fotobewerking 44,6 sec.
Testconfiguratie
  • CPU Test 2018
  • Geïnt. videokaart (GTX 1050 Ti bij CPU's zonder iGPU)
  • Windows 10
  • High performance energie profiel (tenzij anders aangegeven)
Adobe Premiere Pro CC - 4K HWI TV 685 sec.
Testconfiguratie
  • CPU Test 2018
  • Geïnt. videokaart (GTX 1050 Ti bij CPU's zonder iGPU)
  • Windows 10
  • High performance energie profiel (tenzij anders aangegeven)
Staxrip - x264 (r2901) 174 fps
Testconfiguratie
  • CPU Test 2018
  • Geïnt. videokaart (GTX 1050 Ti bij CPU's zonder iGPU)
  • Windows 10
  • High performance energie profiel (tenzij anders aangegeven)
Staxrip - x265 (2.8.24) 67,3 fps
Testconfiguratie
  • CPU Test 2018
  • Geïnt. videokaart (GTX 1050 Ti bij CPU's zonder iGPU)
  • Windows 10
  • High performance energie profiel (tenzij anders aangegeven)
Flac - 1 uur WAV naar Flac 209 sec.
Testconfiguratie
  • CPU Test 2018
  • Geïnt. videokaart (GTX 1050 Ti bij CPU's zonder iGPU)
  • Windows 10
  • High performance energie profiel (tenzij anders aangegeven)
Microsoft Word 2016 - 1000 pagina's naar PDF 66,4 sec.
Testconfiguratie
  • CPU Test 2018
  • Geïnt. videokaart (GTX 1050 Ti bij CPU's zonder iGPU)
  • Windows 10
  • High performance energie profiel (tenzij anders aangegeven)
Microsoft Excel 2016 - Monte Carlo 6,888 sec.
Testconfiguratie
  • CPU Test 2018
  • Geïnt. videokaart (GTX 1050 Ti bij CPU's zonder iGPU)
  • Windows 10
  • High performance energie profiel (tenzij anders aangegeven)
Winrar 5.60 - 4GB inpakken 159 sec.
Testconfiguratie
  • CPU Test 2018
  • Geïnt. videokaart (GTX 1050 Ti bij CPU's zonder iGPU)
  • Windows 10
  • High performance energie profiel (tenzij anders aangegeven)
7-Zip v18.05 - 4GB inpakken 69 sec.
Testconfiguratie
  • CPU Test 2018
  • Geïnt. videokaart (GTX 1050 Ti bij CPU's zonder iGPU)
  • Windows 10
  • High performance energie profiel (tenzij anders aangegeven)
Chrome 67 - Jetstream 174,5
Testconfiguratie
  • CPU Test 2018
  • Geïnt. videokaart (GTX 1050 Ti bij CPU's zonder iGPU)
  • Windows 10
  • High performance energie profiel (tenzij anders aangegeven)
Chrome 75 - Jetstream 2 112,766
Testconfiguratie
  • CPU Test 2018
  • Geïnt. videokaart (GTX 1050 Ti bij CPU's zonder iGPU)
  • Windows 10
  • High performance energie profiel (tenzij anders aangegeven)
Systeemverbruik - Cinebench 15 - Max 256 W
Testconfiguratie
  • CPU Test 2018
  • Geïnt. videokaart (GTX 1050 Ti bij CPU's zonder iGPU)
  • Windows 10
  • High performance energie profiel (tenzij anders aangegeven)

Testresultaten 2018 (Windows 10) - GTX 1080 Ti

Far Cry 5 – 1920x1080 – Medium 113 fps
Testconfiguratie
  • CPU Test 2018
  • Icm. GeForce GTX 1080 Ti
  • Windows 10
  • High performance energie profiel
Far Cry 5 – 1920x1080 – Ultra 104 fps
Testconfiguratie
  • CPU Test 2018
  • Icm. GeForce GTX 1080 Ti
  • Windows 10
  • High performance energie profiel
Assassin’s Creed: Origins – 1920x1080 – Medium 113 fps
Testconfiguratie
  • CPU Test 2018
  • Icm. GeForce GTX 1080 Ti
  • Windows 10
  • High performance energie profiel
Assassin’s Creed: Origins – 1920x1080 – Ultra 96 fps
Testconfiguratie
  • CPU Test 2018
  • Icm. GeForce GTX 1080 Ti
  • Windows 10
  • High performance energie profiel
The Witcher 3: Blood & Wine - 1920x1080 - Medium 218,8 fps
Testconfiguratie
  • CPU Test 2018
  • Icm. GeForce GTX 1080 Ti
  • Windows 10
  • High performance energie profiel
The Witcher 3: Blood & Wine - 1920x1080 - Ultra 111,7 fps
Testconfiguratie
  • CPU Test 2018
  • Icm. GeForce GTX 1080 Ti
  • Windows 10
  • High performance energie profiel
GTA V - 1920x1080 – Medium 117,3 fps
Testconfiguratie
  • CPU Test 2018
  • Icm. GeForce GTX 1080 Ti
  • Windows 10
  • High performance energie profiel
GTA V - 1920x1080 - Ultra (2x MSAA, 2x Refl. MSAA) 87,9 fps
Testconfiguratie
  • CPU Test 2018
  • Icm. GeForce GTX 1080 Ti
  • Windows 10
  • High performance energie profiel
Battlefield 1 (DX11) - 1920x1080 – Medium 167,6 fps
Testconfiguratie
  • CPU Test 2018
  • Icm. GeForce GTX 1080 Ti
  • Windows 10
  • High performance energie profiel
Battlefield 1 (DX11) - 1920x1080 – Ultra 152,2 fps
Testconfiguratie
  • CPU Test 2018
  • Icm. GeForce GTX 1080 Ti
  • Windows 10
  • High performance energie profiel
Rise of the Tombraider (DX12) - 1920x1080 - Medium 183,7 fps
Testconfiguratie
  • CPU Test 2018
  • Icm. GeForce GTX 1080 Ti
  • Windows 10
  • High performance energie profiel
Rise of the Tombraider (DX12) - 1920x1080 - Ultra 117,3 fps
Testconfiguratie
  • CPU Test 2018
  • Icm. GeForce GTX 1080 Ti
  • Windows 10
  • High performance energie profiel
The Division (DX12) - 1920x1080 - Medium 200,4 fps
Testconfiguratie
  • CPU Test 2018
  • Icm. GeForce GTX 1080 Ti
  • Windows 10
  • High performance energie profiel
The Division (DX12) - 1920x1080 - Ultra 131,6 fps
Testconfiguratie
  • CPU Test 2018
  • Icm. GeForce GTX 1080 Ti
  • Windows 10
  • High performance energie profiel

Testresultaten 2018 (Windows 10) - GTX 1080 Ti - Frametimes

The Witcher 3: Blood & Wine - 1920x1080 - Medium (99p) 8,2 ms
Testconfiguratie
  • CPU Test 2018
  • Icm. GeForce GTX 1080 Ti
  • Windows 10
  • High performance energie profiel
The Witcher 3: Blood & Wine - 1920x1080 - Ultra (99p) 12 ms
Testconfiguratie
  • CPU Test 2018
  • Icm. GeForce GTX 1080 Ti
  • Windows 10
  • High performance energie profiel
GTA V - 1920x1080 - Medium (99p) 14 ms
Testconfiguratie
  • CPU Test 2018
  • Icm. GeForce GTX 1080 Ti
  • Windows 10
  • High performance energie profiel
GTA V - 1920x1080 - Ultra (2x MSAA, 2xRefl. MSAA) (99p) 15 ms
Testconfiguratie
  • CPU Test 2018
  • Icm. GeForce GTX 1080 Ti
  • Windows 10
  • High performance energie profiel
Battlefield 1 (DX11) - 1920x1080 - Medium (99p) 10,2 ms
Testconfiguratie
  • CPU Test 2018
  • Icm. GeForce GTX 1080 Ti
  • Windows 10
  • High performance energie profiel
Battlefield 1 (DX11) - 1920x1080 - Ultra (99p) 11 ms
Testconfiguratie
  • CPU Test 2018
  • Icm. GeForce GTX 1080 Ti
  • Windows 10
  • High performance energie profiel
Rise of the Tombraider (DX12) - 1920x1080 - Medium (99p) 8,1 ms
Testconfiguratie
  • CPU Test 2018
  • Icm. GeForce GTX 1080 Ti
  • Windows 10
  • High performance energie profiel
Rise of the Tombraider (DX12) - 1920x1080 - Ultra (99p) 12,7 ms
Testconfiguratie
  • CPU Test 2018
  • Icm. GeForce GTX 1080 Ti
  • Windows 10
  • High performance energie profiel

Stroomverbruik 2019 (Enkel CPU)

Stroomverbruik idle - Minimaal 17,85 W
Testconfiguratie
  • Stroomverbruik processors (enkel CPU) (2019)
Stroomverbruik idle - Gemiddelde 5 min. 17,88 W
Testconfiguratie
  • Stroomverbruik processors (enkel CPU) (2019)
Stroomverbruik - Cinebench 15 - Gemiddeld 177,6 W
Testconfiguratie
  • Stroomverbruik processors (enkel CPU) (2019)
Stroomverbruik - Cinebench 15 - Maximaal 215,5 W
Testconfiguratie
  • Stroomverbruik processors (enkel CPU) (2019)
Adobe Premiere Pro - Verbruik - Gemiddeld 129,0 W
Testconfiguratie
  • Stroomverbruik processors (enkel CPU) (2019)
Adobe Premiere Pro - Verbruik - Totaal (Wh) 24,97 Wh
Testconfiguratie
  • Stroomverbruik processors (enkel CPU) (2019)

SpecWorkstation 3 (2018)

Media & Entertainment - Score 2,85
Testconfiguratie
  • CPU Test 2018
  • Workstation benchmarks
Media & Entertainment - CPU - Score 3,65
Testconfiguratie
  • CPU Test 2018
  • Workstation benchmarks
Media & Entertainment - CPU - Blender 2,45
Testconfiguratie
  • CPU Test 2018
  • Workstation benchmarks
Media & Entertainment - CPU - Handbrake 3,13
Testconfiguratie
  • CPU Test 2018
  • Workstation benchmarks
Media & Entertainment - CPU - LuxRender 6,35
Testconfiguratie
  • CPU Test 2018
  • Workstation benchmarks
Media & Entertainment - Graphics - Score 1,24
Testconfiguratie
  • CPU Test 2018
  • Workstation benchmarks
Media & Entertainment - Graphics - Maya-05 1,19
Testconfiguratie
  • CPU Test 2018
  • Workstation benchmarks
Media & Entertainment - Graphics - 3DSMax-06 1,3
Testconfiguratie
  • CPU Test 2018
  • Workstation benchmarks
Media & Entertainment - Storage - Score 3,09
Testconfiguratie
  • CPU Test 2018
  • Workstation benchmarks
Media & Entertainment - Storage - CCX 1,83
Testconfiguratie
  • CPU Test 2018
  • Workstation benchmarks
Media & Entertainment - Storage - SPECapcMaya 3,08
Testconfiguratie
  • CPU Test 2018
  • Workstation benchmarks
Media & Entertainment - Storage - MayaVenice 2,73
Testconfiguratie
  • CPU Test 2018
  • Workstation benchmarks
Media & Entertainment - Storage - MandE 2,95
Testconfiguratie
  • CPU Test 2018
  • Workstation benchmarks
Media & Entertainment - Storage - Handbrake 4,31
Testconfiguratie
  • CPU Test 2018
  • Workstation benchmarks
Media & Entertainment - Storage - 3DSM 4,44
Testconfiguratie
  • CPU Test 2018
  • Workstation benchmarks
Product Development - Score 2,2
Testconfiguratie
  • CPU Test 2018
  • Workstation benchmarks
Product Development - CPU - Score 2,69
Testconfiguratie
  • CPU Test 2018
  • Workstation benchmarks
Product Development - CPU - CalculiX 1,21
Testconfiguratie
  • CPU Test 2018
  • Workstation benchmarks
Product Development - CPU - WPCcfd 3,53
Testconfiguratie
  • CPU Test 2018
  • Workstation benchmarks
Product Development - CPU - RodiniaCFD 4,57
Testconfiguratie
  • CPU Test 2018
  • Workstation benchmarks
Product Development - Graphics - Score 0,45
Testconfiguratie
  • CPU Test 2018
  • Workstation benchmarks
Product Development - Graphics - Catia-05 0,52
Testconfiguratie
  • CPU Test 2018
  • Workstation benchmarks
Product Development - Graphics - Creo-02 0,54
Testconfiguratie
  • CPU Test 2018
  • Workstation benchmarks
Product Development - Graphics - SNX-03 0,09
Testconfiguratie
  • CPU Test 2018
  • Workstation benchmarks
Product Development - Graphics - SW-04 0,56
Testconfiguratie
  • CPU Test 2018
  • Workstation benchmarks
Product Development - Graphics - Showcase-02 1,23
Testconfiguratie
  • CPU Test 2018
  • Workstation benchmarks
Product Development - Storage - Score 5,9
Testconfiguratie
  • CPU Test 2018
  • Workstation benchmarks
Product Development - Storage - WpcCFD 7,14
Testconfiguratie
  • CPU Test 2018
  • Workstation benchmarks
Product Development - Storage - ProdDev 4,87
Testconfiguratie
  • CPU Test 2018
  • Workstation benchmarks
Life Sciences - Score 2,29
Testconfiguratie
  • CPU Test 2018
  • Workstation benchmarks
Life Sciences - CPU - Score 3,13
Testconfiguratie
  • CPU Test 2018
  • Workstation benchmarks
Life Sciences - CPU - Iammps 3,84
Testconfiguratie
  • CPU Test 2018
  • Workstation benchmarks
Life Sciences - CPU - Namd 3,4
Testconfiguratie
  • CPU Test 2018
  • Workstation benchmarks
Life Sciences - CPU - RodiniaLifeSci 2,35
Testconfiguratie
  • CPU Test 2018
  • Workstation benchmarks
Life Sciences - Graphics - Score 1,45
Testconfiguratie
  • CPU Test 2018
  • Workstation benchmarks
Life Sciences - Graphics - Medical-02 1,45
Testconfiguratie
  • CPU Test 2018
  • Workstation benchmarks
Life Sciences - Storage - Score 1,41
Testconfiguratie
  • CPU Test 2018
  • Workstation benchmarks
Life Sciences - Storage - Namd 2,48
Testconfiguratie
  • CPU Test 2018
  • Workstation benchmarks
Life Sciences - Storage - Iammps 0,8
Testconfiguratie
  • CPU Test 2018
  • Workstation benchmarks
Financial Services - Score 3,91
Testconfiguratie
  • CPU Test 2018
  • Workstation benchmarks
Financial Services - CPU - Score 3,91
Testconfiguratie
  • CPU Test 2018
  • Workstation benchmarks
Financial Services - CPU - FSI 3,91
Testconfiguratie
  • CPU Test 2018
  • Workstation benchmarks
Energy - Score 1,3
Testconfiguratie
  • CPU Test 2018
  • Workstation benchmarks
Energy - CPU - Score 1,17
Testconfiguratie
  • CPU Test 2018
  • Workstation benchmarks
Energy - CPU - Convolution 3,92
Testconfiguratie
  • CPU Test 2018
  • Workstation benchmarks
Energy - CPU -FFTW 3,88
Testconfiguratie
  • CPU Test 2018
  • Workstation benchmarks
Energy - CPU - Kirchhoff 4,07
Testconfiguratie
  • CPU Test 2018
  • Workstation benchmarks
Energy - CPU - Poisson 0,27
Testconfiguratie
  • CPU Test 2018
  • Workstation benchmarks
Energy - CPU - Srmp 0,13
Testconfiguratie
  • CPU Test 2018
  • Workstation benchmarks
Energy - Graphics - Score 0,58
Testconfiguratie
  • CPU Test 2018
  • Workstation benchmarks
Energy - Graphics - Energy-02 0,58
Testconfiguratie
  • CPU Test 2018
  • Workstation benchmarks
Energy - Storage - Score 4,79
Testconfiguratie
  • CPU Test 2018
  • Workstation benchmarks
Energy - Storage - Energy-02 4,79
Testconfiguratie
  • CPU Test 2018
  • Workstation benchmarks
General Operations - Score 2,38
Testconfiguratie
  • CPU Test 2018
  • Workstation benchmarks
General Operations - CPU - Score 1,77
Testconfiguratie
  • CPU Test 2018
  • Workstation benchmarks
General Operations - CPU - 7zip 2,01
Testconfiguratie
  • CPU Test 2018
  • Workstation benchmarks
General Operations - CPU - Octave 1,51
Testconfiguratie
  • CPU Test 2018
  • Workstation benchmarks
General Operations - CPU - Python36 1,83
Testconfiguratie
  • CPU Test 2018
  • Workstation benchmarks
General Operations - Storage - Score 5,73
Testconfiguratie
  • CPU Test 2018
  • Workstation benchmarks
General Operations - Storage - MozillaVS 10,54
Testconfiguratie
  • CPU Test 2018
  • Workstation benchmarks
General Operations - Storage - Mcad 4,99
Testconfiguratie
  • CPU Test 2018
  • Workstation benchmarks
General Operations - Storage - IcePack 3,82
Testconfiguratie
  • CPU Test 2018
  • Workstation benchmarks
General Operations - Storage - 7z 5,38
Testconfiguratie
  • CPU Test 2018
  • Workstation benchmarks
GPU Compute - Score 1,37
Testconfiguratie
  • CPU Test 2018
  • Workstation benchmarks
GPU Compute - GPU - Score 1,37
Testconfiguratie
  • CPU Test 2018
  • Workstation benchmarks
GPU Compute - GPU - LuxRender 1,39
Testconfiguratie
  • CPU Test 2018
  • Workstation benchmarks
GPU Compute - GPU - Caffe 1,33
Testconfiguratie
  • CPU Test 2018
  • Workstation benchmarks
GPU Compute - GPU - Fah 1,4
Testconfiguratie
  • CPU Test 2018
  • Workstation benchmarks

Testresultaten 2017 (Windows 10) - Geïnt. GPU of GTX 1050 Ti

Cinebench 10 (Multi-CPU, 32-bit) 49.060
Testconfiguratie
  • CPU Test 2017
  • Geïnt. videokaart (GTX 1050 Ti bij CPU's zonder iGPU)
  • Windows 10
  • High performance energie profiel (tenzij anders aangegeven)
Cinebench 15 Single Threaded 194
Testconfiguratie
  • CPU Test 2017
  • Geïnt. videokaart (GTX 1050 Ti bij CPU's zonder iGPU)
  • Windows 10
  • High performance energie profiel (tenzij anders aangegeven)
Cinebench 15 Multi Threaded 3.342
Testconfiguratie
  • CPU Test 2017
  • Geïnt. videokaart (GTX 1050 Ti bij CPU's zonder iGPU)
  • Windows 10
  • High performance energie profiel (tenzij anders aangegeven)
Cinebench 15 Multi Threaded (Energie profiel balanced) 3.326
Testconfiguratie
  • CPU Test 2017
  • Geïnt. videokaart (GTX 1050 Ti bij CPU's zonder iGPU)
  • Windows 10
  • High performance energie profiel (tenzij anders aangegeven)
Cinebench 15 multi-core schaling 95,7 %
Testconfiguratie
  • CPU Test 2017
  • Geïnt. videokaart (GTX 1050 Ti bij CPU's zonder iGPU)
  • Windows 10
  • High performance energie profiel (tenzij anders aangegeven)
Blender 2.78c 38 sec.
Testconfiguratie
  • CPU Test 2017
  • Geïnt. videokaart (GTX 1050 Ti bij CPU's zonder iGPU)
  • Windows 10
  • High performance energie profiel (tenzij anders aangegeven)
AIDA64 (5.90.4247) - Zlib 1.355,1 MB/s
Testconfiguratie
  • CPU Test 2017
  • Geïnt. videokaart (GTX 1050 Ti bij CPU's zonder iGPU)
  • Windows 10
  • High performance energie profiel (tenzij anders aangegeven)
AIDA64 (5.90.4247) - AES 69.010 MB/s
Testconfiguratie
  • CPU Test 2017
  • Geïnt. videokaart (GTX 1050 Ti bij CPU's zonder iGPU)
  • Windows 10
  • High performance energie profiel (tenzij anders aangegeven)
AIDA64 (5.90.4247) - Hash 17.345 MB/s
Testconfiguratie
  • CPU Test 2017
  • Geïnt. videokaart (GTX 1050 Ti bij CPU's zonder iGPU)
  • Windows 10
  • High performance energie profiel (tenzij anders aangegeven)
AIDA64 (5.90.4247) - VP8 8.610
Testconfiguratie
  • CPU Test 2017
  • Geïnt. videokaart (GTX 1050 Ti bij CPU's zonder iGPU)
  • Windows 10
  • High performance energie profiel (tenzij anders aangegeven)
AIDA64 (5.90.4247) - Julia 126.872
Testconfiguratie
  • CPU Test 2017
  • Geïnt. videokaart (GTX 1050 Ti bij CPU's zonder iGPU)
  • Windows 10
  • High performance energie profiel (tenzij anders aangegeven)
AIDA64 (5.90.4247) - Mandel 67.711
Testconfiguratie
  • CPU Test 2017
  • Geïnt. videokaart (GTX 1050 Ti bij CPU's zonder iGPU)
  • Windows 10
  • High performance energie profiel (tenzij anders aangegeven)
PCMark 8 - Home 4.577
Testconfiguratie
  • CPU Test 2017
  • Geïnt. videokaart (GTX 1050 Ti bij CPU's zonder iGPU)
  • Windows 10
  • High performance energie profiel (tenzij anders aangegeven)
PCMark 8 - Work 3.885
Testconfiguratie
  • CPU Test 2017
  • Geïnt. videokaart (GTX 1050 Ti bij CPU's zonder iGPU)
  • Windows 10
  • High performance energie profiel (tenzij anders aangegeven)
Adobe Lightroom 6 - Export 22 sec.
Testconfiguratie
  • CPU Test 2017
  • Geïnt. videokaart (GTX 1050 Ti bij CPU's zonder iGPU)
  • Windows 10
  • High performance energie profiel (tenzij anders aangegeven)
Adobe Photoshop CC 2017 - Panorama 36 sec.
Testconfiguratie
  • CPU Test 2017
  • Geïnt. videokaart (GTX 1050 Ti bij CPU's zonder iGPU)
  • Windows 10
  • High performance energie profiel (tenzij anders aangegeven)
Adobe Photoshop CC 2017 - Fotobewerking 45 sec.
Testconfiguratie
  • CPU Test 2017
  • Geïnt. videokaart (GTX 1050 Ti bij CPU's zonder iGPU)
  • Windows 10
  • High performance energie profiel (tenzij anders aangegeven)
Adobe Premiere Pro 2017 - 4K HWI TV 110 sec.
Testconfiguratie
  • CPU Test 2017
  • Geïnt. videokaart (GTX 1050 Ti bij CPU's zonder iGPU)
  • Windows 10
  • High performance energie profiel (tenzij anders aangegeven)
Staxrip - x264 196,52 fps
Testconfiguratie
  • CPU Test 2017
  • Geïnt. videokaart (GTX 1050 Ti bij CPU's zonder iGPU)
  • Windows 10
  • High performance energie profiel (tenzij anders aangegeven)
Staxrip - x265 74,45 fps
Testconfiguratie
  • CPU Test 2017
  • Geïnt. videokaart (GTX 1050 Ti bij CPU's zonder iGPU)
  • Windows 10
  • High performance energie profiel (tenzij anders aangegeven)
Flac - 1 uur WAV naar Flac 220 sec.
Testconfiguratie
  • CPU Test 2017
  • Geïnt. videokaart (GTX 1050 Ti bij CPU's zonder iGPU)
  • Windows 10
  • High performance energie profiel (tenzij anders aangegeven)
Microsoft Word 2016 - 1000 pagina's naar PDF 49 sec.
Testconfiguratie
  • CPU Test 2017
  • Geïnt. videokaart (GTX 1050 Ti bij CPU's zonder iGPU)
  • Windows 10
  • High performance energie profiel (tenzij anders aangegeven)
Microsoft Excel 2016 - Monte Carlo 1,382 sec.
Testconfiguratie
  • CPU Test 2017
  • Geïnt. videokaart (GTX 1050 Ti bij CPU's zonder iGPU)
  • Windows 10
  • High performance energie profiel (tenzij anders aangegeven)
Winrar 5.40 - 2GB inpakken 41 sec.
Testconfiguratie
  • CPU Test 2017
  • Geïnt. videokaart (GTX 1050 Ti bij CPU's zonder iGPU)
  • Windows 10
  • High performance energie profiel (tenzij anders aangegeven)
7-Zip - 2GB inpakken 40 sec.
Testconfiguratie
  • CPU Test 2017
  • Geïnt. videokaart (GTX 1050 Ti bij CPU's zonder iGPU)
  • Windows 10
  • High performance energie profiel (tenzij anders aangegeven)
Chrome 58 - Jetstream 258,9
Testconfiguratie
  • CPU Test 2017
  • Geïnt. videokaart (GTX 1050 Ti bij CPU's zonder iGPU)
  • Windows 10
  • High performance energie profiel (tenzij anders aangegeven)
Stroomverbruik - Cinebench 15 - Max 273 W
Testconfiguratie
  • CPU Test 2017
  • Geïnt. videokaart (GTX 1050 Ti bij CPU's zonder iGPU)
  • Windows 10
  • High performance energie profiel (tenzij anders aangegeven)
Stroomverbruik - Cinebench 15 - Max (Energie prof. balanced) 271 W
Testconfiguratie
  • CPU Test 2017
  • Geïnt. videokaart (GTX 1050 Ti bij CPU's zonder iGPU)
  • Windows 10
  • High performance energie profiel (tenzij anders aangegeven)
Stroomverbruik idle - Gemiddelde 5 min. 39,6 W
Testconfiguratie
  • CPU Test 2017
  • Geïnt. videokaart (GTX 1050 Ti bij CPU's zonder iGPU)
  • Windows 10
  • High performance energie profiel (tenzij anders aangegeven)
Stroomverbruik idle - Gemiddelde 5 min.(Energie pr. balanced 38,4 W
Testconfiguratie
  • CPU Test 2017
  • Geïnt. videokaart (GTX 1050 Ti bij CPU's zonder iGPU)
  • Windows 10
  • High performance energie profiel (tenzij anders aangegeven)
Stroomverbruik Premiere Pro - 4K HWI TV - Verbruik 6,1 Wh
Testconfiguratie
  • CPU Test 2017
  • Geïnt. videokaart (GTX 1050 Ti bij CPU's zonder iGPU)
  • Windows 10
  • High performance energie profiel (tenzij anders aangegeven)
Stroomverbruik Premiere Pro - 4K HWI TV - Gemiddeld 199,6 W
Testconfiguratie
  • CPU Test 2017
  • Geïnt. videokaart (GTX 1050 Ti bij CPU's zonder iGPU)
  • Windows 10
  • High performance energie profiel (tenzij anders aangegeven)
Perf. / Watt - Cinebench 15 12,2 cb/W
Testconfiguratie
  • CPU Test 2017
  • Geïnt. videokaart (GTX 1050 Ti bij CPU's zonder iGPU)
  • Windows 10
  • High performance energie profiel (tenzij anders aangegeven)

Testresultaten 2017 (Windows 10) - GTX 1080 Ti

Prey - 1920x1080 - Medium 264,3 fps
Testconfiguratie
  • CPU Test 2017
  • In combinatie met GeForce GTX 1080 Ti
  • Windows 10
  • High performance energie profiel
Prey - 1920x1080 - Ultra 239 fps
Testconfiguratie
  • CPU Test 2017
  • In combinatie met GeForce GTX 1080 Ti
  • Windows 10
  • High performance energie profiel
GTA V - 1920x1080 - Medium 127,2 fps
Testconfiguratie
  • CPU Test 2017
  • In combinatie met GeForce GTX 1080 Ti
  • Windows 10
  • High performance energie profiel
GTA V - 1920x1080 - Ultra (2x MSAA, 0x Refl. MSAA) 66,3 fps
Testconfiguratie
  • CPU Test 2017
  • In combinatie met GeForce GTX 1080 Ti
  • Windows 10
  • High performance energie profiel
Battlefield 1 (DX12) - 1920x1080 - Medium 189,8 fps
Testconfiguratie
  • CPU Test 2017
  • In combinatie met GeForce GTX 1080 Ti
  • Windows 10
  • High performance energie profiel
Battlefield 1 (DX12) - 1920x1080 - Ultra 142,7 fps
Testconfiguratie
  • CPU Test 2017
  • In combinatie met GeForce GTX 1080 Ti
  • Windows 10
  • High performance energie profiel
Doom (Vulkan) - 1920x1080 - Medium 200 fps
Testconfiguratie
  • CPU Test 2017
  • In combinatie met GeForce GTX 1080 Ti
  • Windows 10
  • High performance energie profiel
Doom (Vulkan) - 1920x1080 - Ultra 200 fps
Testconfiguratie
  • CPU Test 2017
  • In combinatie met GeForce GTX 1080 Ti
  • Windows 10
  • High performance energie profiel
Rise of the Tombraider (DX12) - 1920x1080 - Medium 192,4 fps
Testconfiguratie
  • CPU Test 2017
  • In combinatie met GeForce GTX 1080 Ti
  • Windows 10
  • High performance energie profiel
Rise of the Tombraider (DX12) - 1920x1080 - Ultra 163,9 fps
Testconfiguratie
  • CPU Test 2017
  • In combinatie met GeForce GTX 1080 Ti
  • Windows 10
  • High performance energie profiel
Stroomverbruik - Cinebench 15 - Max 280 W
Testconfiguratie
  • CPU Test 2017
  • In combinatie met GeForce GTX 1080 Ti
  • Windows 10
  • High performance energie profiel
Stroomverbruik idle - Gemiddelde 5 min. 44,4 W
Testconfiguratie
  • CPU Test 2017
  • In combinatie met GeForce GTX 1080 Ti
  • Windows 10
  • High performance energie profiel

Testresultaten 2017 (Windows 10) - GTX 1080 Ti - Frametimes

Prey - 1920x1080 - Medium (99p) 6,24 ms
Testconfiguratie
  • CPU Test 2017
  • In combinatie met GeForce GTX 1080 Ti
  • Windows 10
  • High performance energie profiel
Prey - 1920x1080 - Ultra (99p) 6,58 ms
Testconfiguratie
  • CPU Test 2017
  • In combinatie met GeForce GTX 1080 Ti
  • Windows 10
  • High performance energie profiel
GTA V - 1920x1080 - Medium (99p) 12 ms
Testconfiguratie
  • CPU Test 2017
  • In combinatie met GeForce GTX 1080 Ti
  • Windows 10
  • High performance energie profiel
GTA V - 1920x1080 - Ultra (2x MSAA, 0xRefl. MSAA) (99p) 21 ms
Testconfiguratie
  • CPU Test 2017
  • In combinatie met GeForce GTX 1080 Ti
  • Windows 10
  • High performance energie profiel
Battlefield 1 (DX12) - 1920x1080 - Medium (99p) 9,5 ms
Testconfiguratie
  • CPU Test 2017
  • In combinatie met GeForce GTX 1080 Ti
  • Windows 10
  • High performance energie profiel
Battlefield 1 (DX12) - 1920x1080 - Ultra (99p) 11,6 ms
Testconfiguratie
  • CPU Test 2017
  • In combinatie met GeForce GTX 1080 Ti
  • Windows 10
  • High performance energie profiel
Doom (Vulkan) - 1920x1080 - Medium (99p) 5,6 ms
Testconfiguratie
  • CPU Test 2017
  • In combinatie met GeForce GTX 1080 Ti
  • Windows 10
  • High performance energie profiel
Doom (Vulkan) - 1920x1080 - Ultra (99p) 5,7 ms
Testconfiguratie
  • CPU Test 2017
  • In combinatie met GeForce GTX 1080 Ti
  • Windows 10
  • High performance energie profiel
Prey - 1920x1080 - Medium (min. FPS 99p) 160,3 fps
Testconfiguratie
  • CPU Test 2017
  • In combinatie met GeForce GTX 1080 Ti
  • Windows 10
  • High performance energie profiel
Prey - 1920x1080 - Ultra (min. FPS 99p) 152,0 fps
Testconfiguratie
  • CPU Test 2017
  • In combinatie met GeForce GTX 1080 Ti
  • Windows 10
  • High performance energie profiel
GTA V - 1920x1080 - Medium (min. FPS 99p) 83,3 fps
Testconfiguratie
  • CPU Test 2017
  • In combinatie met GeForce GTX 1080 Ti
  • Windows 10
  • High performance energie profiel
GTA V - 1920x1080 - Ultra (2x MSAA, 0xRefl. MSAA) (min. FPS 47,6 fps
Testconfiguratie
  • CPU Test 2017
  • In combinatie met GeForce GTX 1080 Ti
  • Windows 10
  • High performance energie profiel
Battlefield 1 (DX12) - 1920x1080 - Medium (min. FPS 99p) 105,3 fps
Testconfiguratie
  • CPU Test 2017
  • In combinatie met GeForce GTX 1080 Ti
  • Windows 10
  • High performance energie profiel
Battlefield 1 (DX12) - 1920x1080 - Ultra (min. FPS 99p) 86,2 fps
Testconfiguratie
  • CPU Test 2017
  • In combinatie met GeForce GTX 1080 Ti
  • Windows 10
  • High performance energie profiel
Doom (Vulkan) - 1920x1080 - Medium (min. FPS 99p) 178,6 fps
Testconfiguratie
  • CPU Test 2017
  • In combinatie met GeForce GTX 1080 Ti
  • Windows 10
  • High performance energie profiel
Doom (Vulkan) - 1920x1080 - Ultra (min. FPS 99p) 175,4 fps
Testconfiguratie
  • CPU Test 2017
  • In combinatie met GeForce GTX 1080 Ti
  • Windows 10
  • High performance energie profiel

Stroomverbruik 2017 (Enkel CPU)

Idle - Verbruik 0,095 Ah
Testconfiguratie
  • Stroomverbruik processors (enkel CPU)
Stroomverbruik idle - Gemiddelde 5 min. 13,7 W
Testconfiguratie
  • Stroomverbruik processors (enkel CPU)
Cinebench 15 - Load - Verbruik 0,061 Ah
Testconfiguratie
  • Stroomverbruik processors (enkel CPU)
Stroomverbruik - Cinebench 15 - Gemiddeld 186,7 W
Testconfiguratie
  • Stroomverbruik processors (enkel CPU)
Adobe Premiere Pro - Verbruik 0,362 Ah
Testconfiguratie
  • Stroomverbruik processors (enkel CPU)
Stroomverbruik Premiere Pro - 4K HWI TV - Gemiddeld 146,2 W
Testconfiguratie
  • Stroomverbruik processors (enkel CPU)
Adobe Premiere Pro (2018) - Verbruik 2,051 Ah
Testconfiguratie
  • Stroomverbruik processors (enkel CPU)
Stroomverbruik Premiere Pro (2018) - 4K HWI TV - Gemiddeld 129,3 W
Testconfiguratie
  • Stroomverbruik processors (enkel CPU)

Reviews

Processors

42 AMD en Intel CPU's review: wat is de beste processor?

AMD en Intel concurreerden in 2017 weer met elkaar, met aan de lopende band nieuwe processors. Tijd om de balans op te maken: welke processor moet je kopen voor welk gebruiksdoeleinde? Met dit artikel weet je welke CPU voor jou de beste is!

10 maart 2018 05:59
Processors

Intel Core i9 7960X / 7980XE 16 en 18 core processors video review 

Nadat AMD's Threadripper processors eerder dit jaar alle benchmarkrecords verbraken, duurde het niet lang voordat Intel haar antwoord aankondigde. Van de nieuwe Skylake-X gebaseerde processors zouden ook modellen met 12, 16 en zelfs 18 cores op de markt gaan komen. Dat moment is nu daadwerkelijk aangebroken, en wij gingen aan de slag met de nieuwe Intel Core i9 7960X en 7980XE, processors die respectievelijk 16 en 18 cores bevatten. Slaat Intel hiermee genadeloos terug, of blijft AMD de beste keuze in het high-end segment? Wij zochten het uit!

2 oktober 2017 15:02

Alternatieven

Intel Core i9 7900X Boxed

  • Socket 2066
  • 3.3 GHz
  • 10 cores
  • 140 W
 

Intel Core i7 8700K Boxed

  • Socket 1151
  • 3.7 GHz
  • 6 cores
  • 95 W
  • Geïntegreerde GPU
 

Intel Core i5 8600K Boxed

  • Socket 1151
  • 3.6 GHz
  • 6 cores
  • 95 W
  • Geïntegreerde GPU
 

AMD Ryzen Threadripper 1920X Boxed

  • Socket TR4
  • 3.5 GHz
  • 12 cores
  • 180 W
 

AMD Ryzen Threadripper 1950X Boxed

  • Socket TR4
  • 3.4 GHz
  • 16 cores
  • 180 W
 

Intel Core i7 7820X Boxed

  • Socket 2066
  • 3.6 GHz
  • 8 cores
  • 140 W
 

AMD Ryzen 7 1800X Boxed

  • Socket AM4
  • 3.6 GHz
  • 8 cores
  • 95 W
 

Intel Core i5 8400 Boxed

  • Socket 1151
  • 2.8 GHz
  • 6 cores
  • 65 W
  • Geïntegreerde GPU
 

Intel Core i3 8350K Boxed

  • Socket 1151
  • 4.0 GHz
  • 4 cores
  • 91 W
  • Geïntegreerde GPU
 

AMD Ryzen 5 1600 Boxed

  • Socket AM4
  • 3.2 GHz
  • 6 cores
  • 65 W
 

AMD Ryzen 7 1700 Boxed

  • Socket AM4
  • 3.0 GHz
  • 8 cores
  • 65 W
 

AMD Ryzen 5 2600 Boxed

  • Socket AM4
  • 3.4 GHz
  • 6 cores
  • 65 W
 
0