Prijsverloop

Dit product is niet (meer) verkrijgbaar bij de bij Hardware Info aangesloten shops.

Specificaties

Belangrijkste specificaties

CPU-socket Socket 1150
Klokfrequentie 3,4 GHz
Aantal cores totaal 4 cores
Thermal design power 84 W
Geïntegreerde GPU

Processor

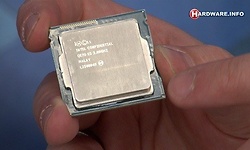
Processorserie Core i5
CPU-core Haswell
CPU-socket Socket 1150
Klokfrequentie 3,4 GHz
Max. turbo klokfrequentie 3,8 GHz
Aantal cores totaal 4 cores
Aantal threads 4
HyperThreading / SMT
Multiplier 34 x
Multiplier unlocked
Bustype Direct Media Interface
Bussnelheid / bClk 100 MHz
Geïntegreerde geheugencontroller DDR3-1600 (Dual Channel)
Thermal design power 84 W
Productie-procedé 22 nm
Die-grootte 177 mm²
Aantal transistors 1.400 mln
Aantal PCIe lanes 16
Uitvoering Boxed
Koeler meegeleverd

Geheugencontroller

Geïntegreerde geheugencontroller
Geheugentype DDR3
Geheugensnelheid 1.600 MHz
Geheugenkanalen 2

Video

Geïntegreerde GPU
GPU type Intel HD Graphics 4600
GPU klokfrequentie 1.200 MHz
DirectX versie DirectX 11.1
Intel Quick Sync

Cache

L2-cache 1.024 kB
L3-cache 6 MB

Instructieset

IA-64
MMX
SSE
SSE2
SSE3
SSE4A
SSE4.1
SSE4.2
x86-64
XD-bit
AVX
AVX2
AVX-512
AES-NI

Virtualisatie type

Intel VT-d
Intel VT-x

Productcodes

SKU BX80646I54670K
EAN 5032037051156, 0675901219082, 0735858260664, 5032037051163
Toegevoegd aan Hardware Info zaterdag 1 juni 2013

Testresultaten

Dit product is door Hardware Info getest op maandag 26 maart 2018.

Testresultaten 2018 (Windows 10) - Geïnt. GPU of GTX 1050 Ti

Cinebench 20 Single Threaded 364
Testconfiguratie
  • CPU Test 2018
  • Geïnt. videokaart (GTX 1050 Ti bij CPU's zonder iGPU)
  • Windows 10
  • High performance energie profiel (tenzij anders aangegeven)
Cinebench 20 Multi Threaded 1.349
Testconfiguratie
  • CPU Test 2018
  • Geïnt. videokaart (GTX 1050 Ti bij CPU's zonder iGPU)
  • Windows 10
  • High performance energie profiel (tenzij anders aangegeven)

Testresultaten 2017 (Windows 10) - Geïnt. GPU of GTX 1050 Ti

3DMark Skydiver 3.654
Testconfiguratie
  • CPU Test 2017
  • Geïnt. videokaart (GTX 1050 Ti bij CPU's zonder iGPU)
  • Windows 10
  • High performance energie profiel (tenzij anders aangegeven)
Counterstrike: Global Offensive - 1920x1080 - Low 50,4 fps
Testconfiguratie
  • CPU Test 2017
  • Geïnt. videokaart (GTX 1050 Ti bij CPU's zonder iGPU)
  • Windows 10
  • High performance energie profiel (tenzij anders aangegeven)
Counterstrike: Global Offensive - 1920x1080 - Medium 38,4 fps
Testconfiguratie
  • CPU Test 2017
  • Geïnt. videokaart (GTX 1050 Ti bij CPU's zonder iGPU)
  • Windows 10
  • High performance energie profiel (tenzij anders aangegeven)
Minecraft - 1920x1080 - Fast 77 fps
Testconfiguratie
  • CPU Test 2017
  • Geïnt. videokaart (GTX 1050 Ti bij CPU's zonder iGPU)
  • Windows 10
  • High performance energie profiel (tenzij anders aangegeven)
Minecraft - 1920x1080 - Fancy 65,9 fps
Testconfiguratie
  • CPU Test 2017
  • Geïnt. videokaart (GTX 1050 Ti bij CPU's zonder iGPU)
  • Windows 10
  • High performance energie profiel (tenzij anders aangegeven)
Dota 2 - 1920x1080 - Low 81,2 fps
Testconfiguratie
  • CPU Test 2017
  • Geïnt. videokaart (GTX 1050 Ti bij CPU's zonder iGPU)
  • Windows 10
  • High performance energie profiel (tenzij anders aangegeven)
Dota 2 - 1920x1080 - Medium 17,1 fps
Testconfiguratie
  • CPU Test 2017
  • Geïnt. videokaart (GTX 1050 Ti bij CPU's zonder iGPU)
  • Windows 10
  • High performance energie profiel (tenzij anders aangegeven)
Cinebench 10 (Multi-CPU, 32-bit) 19.512
Testconfiguratie
  • CPU Test 2017
  • Geïnt. videokaart (GTX 1050 Ti bij CPU's zonder iGPU)
  • Windows 10
  • High performance energie profiel (tenzij anders aangegeven)
Cinebench 15 Single Threaded 147
Testconfiguratie
  • CPU Test 2017
  • Geïnt. videokaart (GTX 1050 Ti bij CPU's zonder iGPU)
  • Windows 10
  • High performance energie profiel (tenzij anders aangegeven)
Cinebench 15 Multi Threaded 551
Testconfiguratie
  • CPU Test 2017
  • Geïnt. videokaart (GTX 1050 Ti bij CPU's zonder iGPU)
  • Windows 10
  • High performance energie profiel (tenzij anders aangegeven)
Cinebench 15 Multi Threaded (Energie profiel balanced) 548
Testconfiguratie
  • CPU Test 2017
  • Geïnt. videokaart (GTX 1050 Ti bij CPU's zonder iGPU)
  • Windows 10
  • High performance energie profiel (tenzij anders aangegeven)
Cinebench 15 multi-core schaling 93,7 %
Testconfiguratie
  • CPU Test 2017
  • Geïnt. videokaart (GTX 1050 Ti bij CPU's zonder iGPU)
  • Windows 10
  • High performance energie profiel (tenzij anders aangegeven)
Blender 2.78c 192 sec.
Testconfiguratie
  • CPU Test 2017
  • Geïnt. videokaart (GTX 1050 Ti bij CPU's zonder iGPU)
  • Windows 10
  • High performance energie profiel (tenzij anders aangegeven)
AIDA64 (5.90.4247) - Zlib 252,5 MB/s
Testconfiguratie
  • CPU Test 2017
  • Geïnt. videokaart (GTX 1050 Ti bij CPU's zonder iGPU)
  • Windows 10
  • High performance energie profiel (tenzij anders aangegeven)
AIDA64 (5.90.4247) - AES 15.885 MB/s
Testconfiguratie
  • CPU Test 2017
  • Geïnt. videokaart (GTX 1050 Ti bij CPU's zonder iGPU)
  • Windows 10
  • High performance energie profiel (tenzij anders aangegeven)
AIDA64 (5.90.4247) - Hash 3.866 MB/s
Testconfiguratie
  • CPU Test 2017
  • Geïnt. videokaart (GTX 1050 Ti bij CPU's zonder iGPU)
  • Windows 10
  • High performance energie profiel (tenzij anders aangegeven)
AIDA64 (5.90.4247) - VP8 6.195
Testconfiguratie
  • CPU Test 2017
  • Geïnt. videokaart (GTX 1050 Ti bij CPU's zonder iGPU)
  • Windows 10
  • High performance energie profiel (tenzij anders aangegeven)
AIDA64 (5.90.4247) - Julia 27.740
Testconfiguratie
  • CPU Test 2017
  • Geïnt. videokaart (GTX 1050 Ti bij CPU's zonder iGPU)
  • Windows 10
  • High performance energie profiel (tenzij anders aangegeven)
AIDA64 (5.90.4247) - Mandel 15.126
Testconfiguratie
  • CPU Test 2017
  • Geïnt. videokaart (GTX 1050 Ti bij CPU's zonder iGPU)
  • Windows 10
  • High performance energie profiel (tenzij anders aangegeven)
PCMark 8 - Home 3.180
Testconfiguratie
  • CPU Test 2017
  • Geïnt. videokaart (GTX 1050 Ti bij CPU's zonder iGPU)
  • Windows 10
  • High performance energie profiel (tenzij anders aangegeven)
PCMark 8 - Creativity 3.329
Testconfiguratie
  • CPU Test 2017
  • Geïnt. videokaart (GTX 1050 Ti bij CPU's zonder iGPU)
  • Windows 10
  • High performance energie profiel (tenzij anders aangegeven)
PCMark 8 - Work 3.428
Testconfiguratie
  • CPU Test 2017
  • Geïnt. videokaart (GTX 1050 Ti bij CPU's zonder iGPU)
  • Windows 10
  • High performance energie profiel (tenzij anders aangegeven)
Adobe Lightroom 6 - Export 48 sec.
Testconfiguratie
  • CPU Test 2017
  • Geïnt. videokaart (GTX 1050 Ti bij CPU's zonder iGPU)
  • Windows 10
  • High performance energie profiel (tenzij anders aangegeven)
Adobe Photoshop CC 2017 - Panorama 50 sec.
Testconfiguratie
  • CPU Test 2017
  • Geïnt. videokaart (GTX 1050 Ti bij CPU's zonder iGPU)
  • Windows 10
  • High performance energie profiel (tenzij anders aangegeven)
Adobe Photoshop CC 2017 - Fotobewerking 154 sec.
Testconfiguratie
  • CPU Test 2017
  • Geïnt. videokaart (GTX 1050 Ti bij CPU's zonder iGPU)
  • Windows 10
  • High performance energie profiel (tenzij anders aangegeven)
Adobe Photoshop CC 2017 - Fotobewerking - OpenCL 153 sec.
Testconfiguratie
  • CPU Test 2017
  • Geïnt. videokaart (GTX 1050 Ti bij CPU's zonder iGPU)
  • Windows 10
  • High performance energie profiel (tenzij anders aangegeven)
Adobe Premiere Pro 2017 - 4K HWI TV 326 sec.
Testconfiguratie
  • CPU Test 2017
  • Geïnt. videokaart (GTX 1050 Ti bij CPU's zonder iGPU)
  • Windows 10
  • High performance energie profiel (tenzij anders aangegeven)
Staxrip - x264 45,9 fps
Testconfiguratie
  • CPU Test 2017
  • Geïnt. videokaart (GTX 1050 Ti bij CPU's zonder iGPU)
  • Windows 10
  • High performance energie profiel (tenzij anders aangegeven)
Staxrip - x265 22,21 fps
Testconfiguratie
  • CPU Test 2017
  • Geïnt. videokaart (GTX 1050 Ti bij CPU's zonder iGPU)
  • Windows 10
  • High performance energie profiel (tenzij anders aangegeven)
Staxrip - H.264 (QS/VCE) 203,65 fps
Testconfiguratie
  • CPU Test 2017
  • Geïnt. videokaart (GTX 1050 Ti bij CPU's zonder iGPU)
  • Windows 10
  • High performance energie profiel (tenzij anders aangegeven)
Flac - 1 uur WAV naar Flac 234 sec.
Testconfiguratie
  • CPU Test 2017
  • Geïnt. videokaart (GTX 1050 Ti bij CPU's zonder iGPU)
  • Windows 10
  • High performance energie profiel (tenzij anders aangegeven)
Microsoft Word 2016 - 1000 pagina's naar PDF 60 sec.
Testconfiguratie
  • CPU Test 2017
  • Geïnt. videokaart (GTX 1050 Ti bij CPU's zonder iGPU)
  • Windows 10
  • High performance energie profiel (tenzij anders aangegeven)
Microsoft Excel 2016 - Monte Carlo 7 sec.
Testconfiguratie
  • CPU Test 2017
  • Geïnt. videokaart (GTX 1050 Ti bij CPU's zonder iGPU)
  • Windows 10
  • High performance energie profiel (tenzij anders aangegeven)
Winrar 5.40 - 2GB inpakken 145 sec.
Testconfiguratie
  • CPU Test 2017
  • Geïnt. videokaart (GTX 1050 Ti bij CPU's zonder iGPU)
  • Windows 10
  • High performance energie profiel (tenzij anders aangegeven)
7-Zip - 2GB inpakken 204 sec.
Testconfiguratie
  • CPU Test 2017
  • Geïnt. videokaart (GTX 1050 Ti bij CPU's zonder iGPU)
  • Windows 10
  • High performance energie profiel (tenzij anders aangegeven)
Chrome 58 - Jetstream 207,28
Testconfiguratie
  • CPU Test 2017
  • Geïnt. videokaart (GTX 1050 Ti bij CPU's zonder iGPU)
  • Windows 10
  • High performance energie profiel (tenzij anders aangegeven)
Stroomverbruik - Cinebench 15 - Max 82 W
Testconfiguratie
  • CPU Test 2017
  • Geïnt. videokaart (GTX 1050 Ti bij CPU's zonder iGPU)
  • Windows 10
  • High performance energie profiel (tenzij anders aangegeven)
Stroomverbruik - Cinebench 15 - Max (Energie prof. balanced) 81,9 W
Testconfiguratie
  • CPU Test 2017
  • Geïnt. videokaart (GTX 1050 Ti bij CPU's zonder iGPU)
  • Windows 10
  • High performance energie profiel (tenzij anders aangegeven)
Stroomverbruik idle - Gemiddelde 5 min. 20,4 W
Testconfiguratie
  • CPU Test 2017
  • Geïnt. videokaart (GTX 1050 Ti bij CPU's zonder iGPU)
  • Windows 10
  • High performance energie profiel (tenzij anders aangegeven)
Stroomverbruik idle - Gemiddelde 5 min.(Energie pr. balanced 19,2 W
Testconfiguratie
  • CPU Test 2017
  • Geïnt. videokaart (GTX 1050 Ti bij CPU's zonder iGPU)
  • Windows 10
  • High performance energie profiel (tenzij anders aangegeven)
Stroomverbruik 3DMark Skydiver - Gemiddeld 61,7 W
Testconfiguratie
  • CPU Test 2017
  • Geïnt. videokaart (GTX 1050 Ti bij CPU's zonder iGPU)
  • Windows 10
  • High performance energie profiel (tenzij anders aangegeven)
Stroomverbruik Premiere Pro - 4K HWI TV - Verbruik 8 Wh
Testconfiguratie
  • CPU Test 2017
  • Geïnt. videokaart (GTX 1050 Ti bij CPU's zonder iGPU)
  • Windows 10
  • High performance energie profiel (tenzij anders aangegeven)
Stroomverbruik Premiere Pro - 4K HWI TV - Gemiddeld 88,3 W
Testconfiguratie
  • CPU Test 2017
  • Geïnt. videokaart (GTX 1050 Ti bij CPU's zonder iGPU)
  • Windows 10
  • High performance energie profiel (tenzij anders aangegeven)
Perf. / Watt - Cinebench 15 6,7 cb/W
Testconfiguratie
  • CPU Test 2017
  • Geïnt. videokaart (GTX 1050 Ti bij CPU's zonder iGPU)
  • Windows 10
  • High performance energie profiel (tenzij anders aangegeven)

Testresultaten 2017 (Windows 10) - GTX 1080 Ti

Prey - 1920x1080 - Medium 193,4 fps
Testconfiguratie
  • CPU Test 2017
  • In combinatie met GeForce GTX 1080 Ti
  • Windows 10
  • High performance energie profiel
Prey - 1920x1080 - Ultra 186,2 fps
Testconfiguratie
  • CPU Test 2017
  • In combinatie met GeForce GTX 1080 Ti
  • Windows 10
  • High performance energie profiel
GTA V - 1920x1080 - Medium 94,1 fps
Testconfiguratie
  • CPU Test 2017
  • In combinatie met GeForce GTX 1080 Ti
  • Windows 10
  • High performance energie profiel
GTA V - 1920x1080 - Ultra (2x MSAA, 0x Refl. MSAA) 55,9 fps
Testconfiguratie
  • CPU Test 2017
  • In combinatie met GeForce GTX 1080 Ti
  • Windows 10
  • High performance energie profiel
Battlefield 1 (DX12) - 1920x1080 - Medium 124,2 fps
Testconfiguratie
  • CPU Test 2017
  • In combinatie met GeForce GTX 1080 Ti
  • Windows 10
  • High performance energie profiel
Battlefield 1 (DX12) - 1920x1080 - Ultra 114,9 fps
Testconfiguratie
  • CPU Test 2017
  • In combinatie met GeForce GTX 1080 Ti
  • Windows 10
  • High performance energie profiel
Doom (Vulkan) - 1920x1080 - Medium 198,3 fps
Testconfiguratie
  • CPU Test 2017
  • In combinatie met GeForce GTX 1080 Ti
  • Windows 10
  • High performance energie profiel
Doom (Vulkan) - 1920x1080 - Ultra 196,8 fps
Testconfiguratie
  • CPU Test 2017
  • In combinatie met GeForce GTX 1080 Ti
  • Windows 10
  • High performance energie profiel
Rise of the Tombraider (DX12) - 1920x1080 - Medium 174,9 fps
Testconfiguratie
  • CPU Test 2017
  • In combinatie met GeForce GTX 1080 Ti
  • Windows 10
  • High performance energie profiel
Rise of the Tombraider (DX12) - 1920x1080 - Ultra 152,5 fps
Testconfiguratie
  • CPU Test 2017
  • In combinatie met GeForce GTX 1080 Ti
  • Windows 10
  • High performance energie profiel
The Division (DX12) - 1920x1080 - Medium 146,3 fps
Testconfiguratie
  • CPU Test 2017
  • In combinatie met GeForce GTX 1080 Ti
  • Windows 10
  • High performance energie profiel
The Division (DX12) - 1920x1080 - Ultra 119,4 fps
Testconfiguratie
  • CPU Test 2017
  • In combinatie met GeForce GTX 1080 Ti
  • Windows 10
  • High performance energie profiel
Stroomverbruik - Cinebench 15 - Max 93,9 W
Testconfiguratie
  • CPU Test 2017
  • In combinatie met GeForce GTX 1080 Ti
  • Windows 10
  • High performance energie profiel
Stroomverbruik idle - Gemiddelde 5 min. 36,0 W
Testconfiguratie
  • CPU Test 2017
  • In combinatie met GeForce GTX 1080 Ti
  • Windows 10
  • High performance energie profiel

Testresultaten 2017 (Windows 10) - GTX 1080 Ti - Frametimes

Prey - 1920x1080 - Medium (99p) 7,7 ms
Testconfiguratie
  • CPU Test 2017
  • In combinatie met GeForce GTX 1080 Ti
  • Windows 10
  • High performance energie profiel
Prey - 1920x1080 - Ultra (99p) 10 ms
Testconfiguratie
  • CPU Test 2017
  • In combinatie met GeForce GTX 1080 Ti
  • Windows 10
  • High performance energie profiel
GTA V - 1920x1080 - Medium (99p) 14 ms
Testconfiguratie
  • CPU Test 2017
  • In combinatie met GeForce GTX 1080 Ti
  • Windows 10
  • High performance energie profiel
GTA V - 1920x1080 - Ultra (2x MSAA, 0xRefl. MSAA) (99p) 23 ms
Testconfiguratie
  • CPU Test 2017
  • In combinatie met GeForce GTX 1080 Ti
  • Windows 10
  • High performance energie profiel
Battlefield 1 (DX12) - 1920x1080 - Medium (99p) 14,4 ms
Testconfiguratie
  • CPU Test 2017
  • In combinatie met GeForce GTX 1080 Ti
  • Windows 10
  • High performance energie profiel
Battlefield 1 (DX12) - 1920x1080 - Ultra (99p) 15,1 ms
Testconfiguratie
  • CPU Test 2017
  • In combinatie met GeForce GTX 1080 Ti
  • Windows 10
  • High performance energie profiel
Doom (Vulkan) - 1920x1080 - Medium (99p) 6,2 ms
Testconfiguratie
  • CPU Test 2017
  • In combinatie met GeForce GTX 1080 Ti
  • Windows 10
  • High performance energie profiel
Doom (Vulkan) - 1920x1080 - Ultra (99p) 6,4 ms
Testconfiguratie
  • CPU Test 2017
  • In combinatie met GeForce GTX 1080 Ti
  • Windows 10
  • High performance energie profiel
Prey - 1920x1080 - Medium (min. FPS 99p) 129,9 fps
Testconfiguratie
  • CPU Test 2017
  • In combinatie met GeForce GTX 1080 Ti
  • Windows 10
  • High performance energie profiel
Prey - 1920x1080 - Ultra (min. FPS 99p) 100,0 fps
Testconfiguratie
  • CPU Test 2017
  • In combinatie met GeForce GTX 1080 Ti
  • Windows 10
  • High performance energie profiel
GTA V - 1920x1080 - Medium (min. FPS 99p) 71,4 fps
Testconfiguratie
  • CPU Test 2017
  • In combinatie met GeForce GTX 1080 Ti
  • Windows 10
  • High performance energie profiel
GTA V - 1920x1080 - Ultra (2x MSAA, 0xRefl. MSAA) (min. FPS 43,5 fps
Testconfiguratie
  • CPU Test 2017
  • In combinatie met GeForce GTX 1080 Ti
  • Windows 10
  • High performance energie profiel
Battlefield 1 (DX12) - 1920x1080 - Medium (min. FPS 99p) 69,4 fps
Testconfiguratie
  • CPU Test 2017
  • In combinatie met GeForce GTX 1080 Ti
  • Windows 10
  • High performance energie profiel
Battlefield 1 (DX12) - 1920x1080 - Ultra (min. FPS 99p) 66,2 fps
Testconfiguratie
  • CPU Test 2017
  • In combinatie met GeForce GTX 1080 Ti
  • Windows 10
  • High performance energie profiel
Doom (Vulkan) - 1920x1080 - Medium (min. FPS 99p) 161,3 fps
Testconfiguratie
  • CPU Test 2017
  • In combinatie met GeForce GTX 1080 Ti
  • Windows 10
  • High performance energie profiel
Doom (Vulkan) - 1920x1080 - Ultra (min. FPS 99p) 156,3 fps
Testconfiguratie
  • CPU Test 2017
  • In combinatie met GeForce GTX 1080 Ti
  • Windows 10
  • High performance energie profiel

Testresultaten 2016 (Windows 10) - Geïnt. GPU of GTX 750 Ti

3DMark Cloudgate 7.459
Testconfiguratie
  • CPU Test 2016
  • Geïnt. videokaart (GTX 750 Ti bij CPU's zonder iGPU)
  • Windows 10
3DMark FireStrike 848
Testconfiguratie
  • CPU Test 2016
  • Geïnt. videokaart (GTX 750 Ti bij CPU's zonder iGPU)
  • Windows 10
CounterStrike Global Offensive - 1920x1080 - Low 52,5 fps
Testconfiguratie
  • CPU Test 2016
  • Geïnt. videokaart (GTX 750 Ti bij CPU's zonder iGPU)
  • Windows 10
CounterStrike Global Offensive - 1920x1080 - Medium 40,5 fps
Testconfiguratie
  • CPU Test 2016
  • Geïnt. videokaart (GTX 750 Ti bij CPU's zonder iGPU)
  • Windows 10
MineCraft - 1920x1080 - Fast 84,4 fps
Testconfiguratie
  • CPU Test 2016
  • Geïnt. videokaart (GTX 750 Ti bij CPU's zonder iGPU)
  • Windows 10
MineCraft - 1920x1080 - Fancy 78,8 fps
Testconfiguratie
  • CPU Test 2016
  • Geïnt. videokaart (GTX 750 Ti bij CPU's zonder iGPU)
  • Windows 10
Dota 2 - 1920x1080 - Low 101,6 fps
Testconfiguratie
  • CPU Test 2016
  • Geïnt. videokaart (GTX 750 Ti bij CPU's zonder iGPU)
  • Windows 10
Dota 2 - 1920x1080 - Medium 22,9 fps
Testconfiguratie
  • CPU Test 2016
  • Geïnt. videokaart (GTX 750 Ti bij CPU's zonder iGPU)
  • Windows 10
Gemiddelde fps met IGP 56,6
Testconfiguratie
  • CPU Test 2016
  • Geïnt. videokaart (GTX 750 Ti bij CPU's zonder iGPU)
  • Windows 10
Cinebench 10 (Multi-CPU, 32-bit) 19.622
Testconfiguratie
  • CPU Test 2016
  • Geïnt. videokaart (GTX 750 Ti bij CPU's zonder iGPU)
  • Windows 10
Cinebench 15 Single Threaded 152
Testconfiguratie
  • CPU Test 2016
  • Geïnt. videokaart (GTX 750 Ti bij CPU's zonder iGPU)
  • Windows 10
Cinebench 15 Multi Threaded 552
Testconfiguratie
  • CPU Test 2016
  • Geïnt. videokaart (GTX 750 Ti bij CPU's zonder iGPU)
  • Windows 10
AIDA64 - Zlib 252,6 MB/s
Testconfiguratie
  • CPU Test 2016
  • Geïnt. videokaart (GTX 750 Ti bij CPU's zonder iGPU)
  • Windows 10
AIDA64 - AES 15.932 MB/s
Testconfiguratie
  • CPU Test 2016
  • Geïnt. videokaart (GTX 750 Ti bij CPU's zonder iGPU)
  • Windows 10
AIDA64 - Hash 3.881 MB/s
Testconfiguratie
  • CPU Test 2016
  • Geïnt. videokaart (GTX 750 Ti bij CPU's zonder iGPU)
  • Windows 10
AIDA64 - VP8 6.056
Testconfiguratie
  • CPU Test 2016
  • Geïnt. videokaart (GTX 750 Ti bij CPU's zonder iGPU)
  • Windows 10
AIDA64 - Julia 27.799
Testconfiguratie
  • CPU Test 2016
  • Geïnt. videokaart (GTX 750 Ti bij CPU's zonder iGPU)
  • Windows 10
AIDA64 - Mandel 15.416
Testconfiguratie
  • CPU Test 2016
  • Geïnt. videokaart (GTX 750 Ti bij CPU's zonder iGPU)
  • Windows 10
Handbrake - 30 min. 1080p (x264) 75,49 fps
Testconfiguratie
  • CPU Test 2016
  • Geïnt. videokaart (GTX 750 Ti bij CPU's zonder iGPU)
  • Windows 10
Handbrake - 30 min. 1080p (H.264 QS/VCE) 214 fps
Testconfiguratie
  • CPU Test 2016
  • Geïnt. videokaart (GTX 750 Ti bij CPU's zonder iGPU)
  • Windows 10
Handbrake - 30 min. 1080p (x265) 25,97 fps
Testconfiguratie
  • CPU Test 2016
  • Geïnt. videokaart (GTX 750 Ti bij CPU's zonder iGPU)
  • Windows 10
Adobe Photoshop CC 2015 - HWI Bench 27 sec.
Testconfiguratie
  • CPU Test 2016
  • Geïnt. videokaart (GTX 750 Ti bij CPU's zonder iGPU)
  • Windows 10
Adobe Photoshop CC 2015 - HWI OpenCL Bench 65 sec.
Testconfiguratie
  • CPU Test 2016
  • Geïnt. videokaart (GTX 750 Ti bij CPU's zonder iGPU)
  • Windows 10
Adobe Premiere CC 2015 - HWI Bench (zonder versnelling) 294 sec.
Testconfiguratie
  • CPU Test 2016
  • Geïnt. videokaart (GTX 750 Ti bij CPU's zonder iGPU)
  • Windows 10
Adobe Premiere CC 2015 - HWI Bench (met versnelling) 268 sec.
Testconfiguratie
  • CPU Test 2016
  • Geïnt. videokaart (GTX 750 Ti bij CPU's zonder iGPU)
  • Windows 10
7Zip - Encoding benchmark 14.343 kByte/s
Testconfiguratie
  • CPU Test 2016
  • Geïnt. videokaart (GTX 750 Ti bij CPU's zonder iGPU)
  • Windows 10
WinRAR 5.20 - Encoding benchmark 5.013 kByte/s
Testconfiguratie
  • CPU Test 2016
  • Geïnt. videokaart (GTX 750 Ti bij CPU's zonder iGPU)
  • Windows 10
Word 2016 - 1000 pagina's PDF 60 sec.
Testconfiguratie
  • CPU Test 2016
  • Geïnt. videokaart (GTX 750 Ti bij CPU's zonder iGPU)
  • Windows 10
Excel 2016 - Monte Carlo 6 sec.
Testconfiguratie
  • CPU Test 2016
  • Geïnt. videokaart (GTX 750 Ti bij CPU's zonder iGPU)
  • Windows 10
Google Chrome 44 - Mozilla Kraken 1.1 953 ms
Testconfiguratie
  • CPU Test 2016
  • Geïnt. videokaart (GTX 750 Ti bij CPU's zonder iGPU)
  • Windows 10
Stroomverbruik - Cinebench 15 - Max 87,7 W
Testconfiguratie
  • CPU Test 2016
  • Geïnt. videokaart (GTX 750 Ti bij CPU's zonder iGPU)
  • Windows 10
Stroomverbruik idle - Gemiddelde 5 min. 27,6 W
Testconfiguratie
  • CPU Test 2016
  • Geïnt. videokaart (GTX 750 Ti bij CPU's zonder iGPU)
  • Windows 10
Stroomverbruik 3DMark Cloud Gate - Gemiddeld 68,9 W
Testconfiguratie
  • CPU Test 2016
  • Geïnt. videokaart (GTX 750 Ti bij CPU's zonder iGPU)
  • Windows 10

Testresultaten 2016 (Windows 10) - I.c.m. GTX 960

F1 2015 - 1920x1080 - Medium 84,9 fps
Testconfiguratie
  • CPU Test 2016
  • In combinatie met GeForce GTX 960
  • Windows 10
F1 2015 - 1920x1080 - Ultra 59,8 fps
Testconfiguratie
  • CPU Test 2016
  • In combinatie met GeForce GTX 960
  • Windows 10
GTA V - 1920x1080 - Medium 99,9 fps
Testconfiguratie
  • CPU Test 2016
  • In combinatie met GeForce GTX 960
  • Windows 10
GTA V - 1920x1080 - Ultra(4x AA, 0x Refl. AA) 9,2 fps
Testconfiguratie
  • CPU Test 2016
  • In combinatie met GeForce GTX 960
  • Windows 10
Mad Max - 1920x1080 - Medium 101,7 fps
Testconfiguratie
  • CPU Test 2016
  • In combinatie met GeForce GTX 960
  • Windows 10
Mad Max - 1920x1080 - Ultra 71,3 fps
Testconfiguratie
  • CPU Test 2016
  • In combinatie met GeForce GTX 960
  • Windows 10
Gemiddelde fps (GTX 960) 56,9
Testconfiguratie
  • CPU Test 2016
  • In combinatie met GeForce GTX 960
  • Windows 10
Stroomverbruik idle - Gemiddelde 5 min. 40,8 W
Testconfiguratie
  • CPU Test 2016
  • In combinatie met GeForce GTX 960
  • Windows 10
Stroomverbruik - Cinebench 15 - Max 100 W
Testconfiguratie
  • CPU Test 2016
  • In combinatie met GeForce GTX 960
  • Windows 10

Testresultaten 2016 (Windows 10) - I.c.m. GTX 980

F1 2015 - 1920x1080 - Medium 129,2 fps
Testconfiguratie
  • CPU Test 2016
  • In combinatie met GeForce GTX 980
  • Windows 10
F1 2015 - 1920x1080 - Ultra 108,3 fps
Testconfiguratie
  • CPU Test 2016
  • In combinatie met GeForce GTX 980
  • Windows 10
GTA V - 1920x1080 - Medium 99,5 fps
Testconfiguratie
  • CPU Test 2016
  • In combinatie met GeForce GTX 980
  • Windows 10
GTA V - 1920x1080 - Ultra(4x AA, 0x Refl. AA) 38,5 fps
Testconfiguratie
  • CPU Test 2016
  • In combinatie met GeForce GTX 980
  • Windows 10
Mad Max - 1920x1080 - Medium 184,4 fps
Testconfiguratie
  • CPU Test 2016
  • In combinatie met GeForce GTX 980
  • Windows 10
Mad Max - 1920x1080 - Ultra 133,4 fps
Testconfiguratie
  • CPU Test 2016
  • In combinatie met GeForce GTX 980
  • Windows 10
Gemiddelde fps (GTX 980) 104,7
Testconfiguratie
  • CPU Test 2016
  • In combinatie met GeForce GTX 980
  • Windows 10

Testresultaten 2013 (Windows 8) - Geïnt. GPU of Radeon HD 7750

3DMark Fire Strike 874
Testconfiguratie
  • CPU Test 2013
  • Zonder losse videokaart (Radeon HD 7750 bij CPU's zonder iGPU)
  • Windows 8
3DMark Cloud Gate 6.770
Testconfiguratie
  • CPU Test 2013
  • Zonder losse videokaart (Radeon HD 7750 bij CPU's zonder iGPU)
  • Windows 8
Crysis 3 - 1920x1080 Low 13,2 fps
Testconfiguratie
  • CPU Test 2013
  • Zonder losse videokaart (Radeon HD 7750 bij CPU's zonder iGPU)
  • Windows 8
Crysis 3 - 1920x1080 Medium 10,3 fps
Testconfiguratie
  • CPU Test 2013
  • Zonder losse videokaart (Radeon HD 7750 bij CPU's zonder iGPU)
  • Windows 8
Hitman: Absolution - 1920x1080 Low 18,1 fps
Testconfiguratie
  • CPU Test 2013
  • Zonder losse videokaart (Radeon HD 7750 bij CPU's zonder iGPU)
  • Windows 8
Hitman: Absolution - 1920x1080 Medium 15,2 fps
Testconfiguratie
  • CPU Test 2013
  • Zonder losse videokaart (Radeon HD 7750 bij CPU's zonder iGPU)
  • Windows 8
TombRaider - 1920x1080 Low 32,2 fps
Testconfiguratie
  • CPU Test 2013
  • Zonder losse videokaart (Radeon HD 7750 bij CPU's zonder iGPU)
  • Windows 8
TombRaider - 1920x1080 Medium 21,5 fps
Testconfiguratie
  • CPU Test 2013
  • Zonder losse videokaart (Radeon HD 7750 bij CPU's zonder iGPU)
  • Windows 8
Word 2013 - 1000 pagina's PDF opslaan 58 sec.
Testconfiguratie
  • CPU Test 2013
  • Zonder losse videokaart (Radeon HD 7750 bij CPU's zonder iGPU)
  • Windows 8
Excel 2013 - MonteCarlo benchmark 5,8 sec.
Testconfiguratie
  • CPU Test 2013
  • Zonder losse videokaart (Radeon HD 7750 bij CPU's zonder iGPU)
  • Windows 8
Cinebench 11.5 6,51
Testconfiguratie
  • CPU Test 2013
  • Zonder losse videokaart (Radeon HD 7750 bij CPU's zonder iGPU)
  • Windows 8
Internet Explorer 10 - Mozilla Kraken 3.804,2 ms
Testconfiguratie
  • CPU Test 2013
  • Zonder losse videokaart (Radeon HD 7750 bij CPU's zonder iGPU)
  • Windows 8
Interner Explorer 10 - Futuremark Peacekeeper 3.563
Testconfiguratie
  • CPU Test 2013
  • Zonder losse videokaart (Radeon HD 7750 bij CPU's zonder iGPU)
  • Windows 8
WinRAR 4.20 - 512 MB bestand 27 sec.
Testconfiguratie
  • CPU Test 2013
  • Zonder losse videokaart (Radeon HD 7750 bij CPU's zonder iGPU)
  • Windows 8
TrueCrypt 7.1 - AES Encryption 696 MB/s
Testconfiguratie
  • CPU Test 2013
  • Zonder losse videokaart (Radeon HD 7750 bij CPU's zonder iGPU)
  • Windows 8
TrueCrypt 7.1 - AES Encryption (+ AES-NI) 3.300 MB/s
Testconfiguratie
  • CPU Test 2013
  • Zonder losse videokaart (Radeon HD 7750 bij CPU's zonder iGPU)
  • Windows 8
Adobe Photoshop CS6 - HWI Bench 2013 25 sec.
Testconfiguratie
  • CPU Test 2013
  • Zonder losse videokaart (Radeon HD 7750 bij CPU's zonder iGPU)
  • Windows 8
Adobe Photoshop CS6 - HWI OpenCL Bench 2013 87 sec.
Testconfiguratie
  • CPU Test 2013
  • Zonder losse videokaart (Radeon HD 7750 bij CPU's zonder iGPU)
  • Windows 8
Cyberlink Espresso 6.7 - 30 min. 1080p => 720p (geen acc.) 463 sec.
Testconfiguratie
  • CPU Test 2013
  • Zonder losse videokaart (Radeon HD 7750 bij CPU's zonder iGPU)
  • Windows 8
Cyberlink Espresso 6.7 - 30 min. 1080p => 720p (+ QS/GPU) 72 sec.
Testconfiguratie
  • CPU Test 2013
  • Zonder losse videokaart (Radeon HD 7750 bij CPU's zonder iGPU)
  • Windows 8
Cyberlink PowerDirector - HWI Bench 2013 (geen acc.) 132 sec.
Testconfiguratie
  • CPU Test 2013
  • Zonder losse videokaart (Radeon HD 7750 bij CPU's zonder iGPU)
  • Windows 8
Cyberlink PowerDirector - HWI Bench 2013 (+ QS/GPU) 99 sec.
Testconfiguratie
  • CPU Test 2013
  • Zonder losse videokaart (Radeon HD 7750 bij CPU's zonder iGPU)
  • Windows 8
Tech Arp x264 HD Benchmark 5.0.1 - Pass 1 46,84 fps
Testconfiguratie
  • CPU Test 2013
  • Zonder losse videokaart (Radeon HD 7750 bij CPU's zonder iGPU)
  • Windows 8
Tech Arp x264 HD Benchmark 5.0.1 - Pass 2 13,67 fps
Testconfiguratie
  • CPU Test 2013
  • Zonder losse videokaart (Radeon HD 7750 bij CPU's zonder iGPU)
  • Windows 8
PCMark8 v2 - Work - Accelerated 3.988
Testconfiguratie
  • CPU Test 2013
  • Zonder losse videokaart (Radeon HD 7750 bij CPU's zonder iGPU)
  • Windows 8
PCMark8 v2 - Home - Accelerated 3.035
Testconfiguratie
  • CPU Test 2013
  • Zonder losse videokaart (Radeon HD 7750 bij CPU's zonder iGPU)
  • Windows 8
PCMark8 v2 - Creative - Accelerated 3.688
Testconfiguratie
  • CPU Test 2013
  • Zonder losse videokaart (Radeon HD 7750 bij CPU's zonder iGPU)
  • Windows 8
PCMark8 v2 - Work - Conventional 3.262
Testconfiguratie
  • CPU Test 2013
  • Zonder losse videokaart (Radeon HD 7750 bij CPU's zonder iGPU)
  • Windows 8
PCMark8 v2 - Home - Conventional 3.050
Testconfiguratie
  • CPU Test 2013
  • Zonder losse videokaart (Radeon HD 7750 bij CPU's zonder iGPU)
  • Windows 8
PCMark8 v2 - Creative - Conventional 3.276
Testconfiguratie
  • CPU Test 2013
  • Zonder losse videokaart (Radeon HD 7750 bij CPU's zonder iGPU)
  • Windows 8
Stroomverbruik idle - Gemiddelde 5 min. 33,6 W
Testconfiguratie
  • CPU Test 2013
  • Zonder losse videokaart (Radeon HD 7750 bij CPU's zonder iGPU)
  • Windows 8
Stroomverbruik Cinebench 11.5 - Max 84,3 W
Testconfiguratie
  • CPU Test 2013
  • Zonder losse videokaart (Radeon HD 7750 bij CPU's zonder iGPU)
  • Windows 8
Stroomverbruik 3DMark Cloud Gate - Gemiddeld 62,7 W
Testconfiguratie
  • CPU Test 2013
  • Zonder losse videokaart (Radeon HD 7750 bij CPU's zonder iGPU)
  • Windows 8

Testresultaten 2013 (Windows 8) - I.c.m. Radeon HD 7970 GHz

Crysis 3 - 1920x1080 Medium 86 fps
Testconfiguratie
  • CPU Test 2013
  • In combinatie met AMD Radeon HD 7970 GHz Edition
  • Windows 8
Crysis 3 - 1920x1080 High 64 fps
Testconfiguratie
  • CPU Test 2013
  • In combinatie met AMD Radeon HD 7970 GHz Edition
  • Windows 8
Hitman: Absolution - 1920x1080 Medium 71,1 fps
Testconfiguratie
  • CPU Test 2013
  • In combinatie met AMD Radeon HD 7970 GHz Edition
  • Windows 8
Hitman: Absolution - 1920x1080 High 64,2 fps
Testconfiguratie
  • CPU Test 2013
  • In combinatie met AMD Radeon HD 7970 GHz Edition
  • Windows 8
TombRaider - 1920x1080 Medium 196,2 fps
Testconfiguratie
  • CPU Test 2013
  • In combinatie met AMD Radeon HD 7970 GHz Edition
  • Windows 8
TombRaider - 1920x1080 High 135,3 fps
Testconfiguratie
  • CPU Test 2013
  • In combinatie met AMD Radeon HD 7970 GHz Edition
  • Windows 8
Stroomverbruik idle - Gemiddelde 5 min. 48,0 W
Testconfiguratie
  • CPU Test 2013
  • In combinatie met AMD Radeon HD 7970 GHz Edition
  • Windows 8
Stroomverbruik Cinebench 11.5 - Max 97,5 W
Testconfiguratie
  • CPU Test 2013
  • In combinatie met AMD Radeon HD 7970 GHz Edition
  • Windows 8

Stroomverbruik 2017 (Enkel CPU)

Idle - Verbruik 0,027 Ah
Testconfiguratie
  • Stroomverbruik processors (enkel CPU)
Stroomverbruik idle - Gemiddelde 5 min. 3,9 W
Testconfiguratie
  • Stroomverbruik processors (enkel CPU)
Cinebench 15 - Load - Verbruik 0,099 Ah
Testconfiguratie
  • Stroomverbruik processors (enkel CPU)
Stroomverbruik - Cinebench 15 - Gemiddeld 58,6 W
Testconfiguratie
  • Stroomverbruik processors (enkel CPU)
Adobe Premiere Pro - Verbruik 0,473 Ah
Testconfiguratie
  • Stroomverbruik processors (enkel CPU)
Stroomverbruik Premiere Pro - 4K HWI TV - Gemiddeld 62,7 W
Testconfiguratie
  • Stroomverbruik processors (enkel CPU)

Reviews

Processors

42 AMD en Intel CPU's review: wat is de beste processor?

AMD en Intel concurreerden in 2017 weer met elkaar, met aan de lopende band nieuwe processors. Tijd om de balans op te maken: welke processor moet je kopen voor welk gebruiksdoeleinde? Met dit artikel weet je welke CPU voor jou de beste is!

10 maart 2018 05:59
Processors

AMD vs. Intel: 57 processors megatest

Dat Intel de snelste processors maakt, is anno 2015 een open deur. Maar heeft het ook de beste processor wanneer je 50, 100 of 150 euro wilt uitgeven? Om die vraag te beantwoorden hebben wij bijna alle courante AMD en Intel desktopprocessors (57 stuks!) getest.

23 mei 2015 05:59
Processors

Intel Haswell video review

Intel introduceerde dit weekend haar vierde generatie Core processors, beter bekend onder de codenaam Haswell. Wij konden de afgelopen weken al ruim ervaring opdoen met de nieuwe chips, en praten je in deze aflevering helemaal bij over alle veranderingen, de prestaties en het energieverbruik.

3 juni 2013 13:44

Uitgelicht

Processors

Workshop Haswell overklokken: gratis snelheidswinst!

Begin juni introduceerde Intel haar vierde generatie Core-processors, codenaam Haswell. Ook deze generatie bevat weer twee zogenaamde K-processors, die specifiek bestemd zijn voor overklokkers. In deze workshop laten we zien hoe je het beste aan de slag kunt gaan om de maximale prestaties uit je Haswell CPU te persen.

6 oktober 2013 06:00

Alternatieven

Intel Core i7 4790K Boxed

  • Socket 1150
  • 4 GHz
  • 4 cores
  • 88 W
  • Geïntegreerde GPU
 

Intel Core i7 6700K Boxed

  • Socket 1151
  • 4 GHz
  • 4 cores
  • 95 W
  • Geïntegreerde GPU
 

Intel Core i7 5775C Boxed

  • Socket 1150
  • 3.3 GHz
  • 4 cores
  • 65 W
  • Geïntegreerde GPU
 

AMD A10-7870K Boxed

  • Socket FM2+
  • 3.9 GHz
  • 4 cores
  • 95 W
  • Geïntegreerde GPU
 

Intel Core i7 2600K

  • Socket 1155
  • 3.4 GHz
  • 4 cores
  • 95 W
  • Geïntegreerde GPU
 

Intel Core i3 4330 Boxed

  • Socket 1150
  • 3.5 GHz
  • 2 cores
  • 65 W
  • Geïntegreerde GPU
 

Intel Pentium G4560 Boxed

  • Socket 1151
  • 3.5 GHz
  • 2 cores
  • 54 W
  • Geïntegreerde GPU
 

Intel Core i3 4160 Boxed

  • Socket 1150
  • 3.6 GHz
  • 2 cores
  • 54 W
  • Geïntegreerde GPU
 

Intel Core i5 2500K

  • Socket 1155
  • 3.3 GHz
  • 4 cores
  • 95 W
  • Geïntegreerde GPU
 

Intel Core i5 3570K

  • Socket 1155
  • 3.4 GHz
  • 4 cores
  • 77 W
  • Geïntegreerde GPU
 

Intel Core i3 7350K Boxed

  • Socket 1151
  • 4.2 GHz
  • 2 cores
  • 60 W
  • Geïntegreerde GPU
 

Intel Core i5 7600K Boxed

  • Socket 1151
  • 3.8 GHz
  • 4 cores
  • 95 W
  • Geïntegreerde GPU
 
0