Great Value

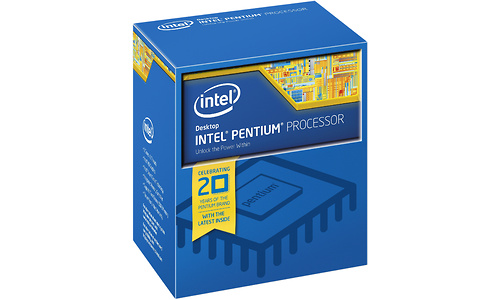
Intel Pentium G4560 Boxed

Prijsverloop

Dit product is niet (meer) verkrijgbaar bij de bij Hardware Info aangesloten shops.

Specificaties

Belangrijkste specificaties

CPU-socket Socket 1151
Klokfrequentie 3,5 GHz
Aantal cores totaal 2 cores
Thermal design power 54 W
Geïntegreerde GPU

Processor

Processorserie Pentium
CPU-core Kaby Lake
CPU-socket Socket 1151
Klokfrequentie 3,5 GHz
Aantal cores totaal 2 cores
Aantal threads 4
HyperThreading / SMT
Multiplier 35 x
Multiplier unlocked
Bustype Direct Media Interface
Bussnelheid / bClk 100 MHz
Geïntegreerde geheugencontroller DDR4-2400 (Dual Channel)
Thermal design power 54 W
Productie-procedé 14 nm
Aantal PCIe lanes 16
Uitvoering Boxed
Koeler meegeleverd

Geheugencontroller

Geïntegreerde geheugencontroller
Geheugentype DDR4
Geheugensnelheid 2.400 MHz
Geheugenkanalen 2

Video

Geïntegreerde GPU
GPU type Intel HD Graphics 610
GPU klokfrequentie 350 MHz
GPU turbo klokfrequentie 1.050 MHz
DirectX versie DirectX 12
Intel Quick Sync

Cache

L2-cache 512 kB
L3-cache 3 MB

Instructieset

IA-64
MMX
SSE
SSE2
SSE3
SSE4A
SSE4.1
SSE4.2
x86-64
XD-bit
AVX
AVX2
AVX-512
AES-NI

Virtualisatie type

Intel VT-d
Intel VT-x

Productcodes

SKU BX80677G4560
EAN 5032037095709, 0735858329620, 5032037095693
Toegevoegd aan Hardware Info vrijdag 6 januari 2017

Testresultaten

Dit product is door Hardware Info getest op maandag 25 maart 2019.

Testresultaten 2018 (Windows 10) - Geïnt. GPU of GTX 1050 Ti

3DMark Skydiver 2.767
Testconfiguratie
  • CPU Test 2018
  • Geïnt. videokaart (GTX 1050 Ti bij CPU's zonder iGPU)
  • Windows 10
  • High performance energie profiel (tenzij anders aangegeven)
3DMark Skydiver - Graphics Score 2.520
Testconfiguratie
  • CPU Test 2018
  • Geïnt. videokaart (GTX 1050 Ti bij CPU's zonder iGPU)
  • Windows 10
  • High performance energie profiel (tenzij anders aangegeven)
3DMark Skydiver - Physics Score 5.917
Testconfiguratie
  • CPU Test 2018
  • Geïnt. videokaart (GTX 1050 Ti bij CPU's zonder iGPU)
  • Windows 10
  • High performance energie profiel (tenzij anders aangegeven)
F1 2017 – 1920x1080 – Low 13 fps
Testconfiguratie
  • CPU Test 2018
  • Geïnt. videokaart (GTX 1050 Ti bij CPU's zonder iGPU)
  • Windows 10
  • High performance energie profiel (tenzij anders aangegeven)
F1 2017 – 1920x1080 - Medium 13 fps
Testconfiguratie
  • CPU Test 2018
  • Geïnt. videokaart (GTX 1050 Ti bij CPU's zonder iGPU)
  • Windows 10
  • High performance energie profiel (tenzij anders aangegeven)
Minecraft v1.12.2 - 1920x1080 – Fast 81,8 fps
Testconfiguratie
  • CPU Test 2018
  • Geïnt. videokaart (GTX 1050 Ti bij CPU's zonder iGPU)
  • Windows 10
  • High performance energie profiel (tenzij anders aangegeven)
Minecraft v1.12.2 - 1920x1080 – Fancy 46,1 fps
Testconfiguratie
  • CPU Test 2018
  • Geïnt. videokaart (GTX 1050 Ti bij CPU's zonder iGPU)
  • Windows 10
  • High performance energie profiel (tenzij anders aangegeven)
Dota 2 (Vulkan) - 1920x1080 – Low 111 fps
Testconfiguratie
  • CPU Test 2018
  • Geïnt. videokaart (GTX 1050 Ti bij CPU's zonder iGPU)
  • Windows 10
  • High performance energie profiel (tenzij anders aangegeven)
Dota 2 (Vulkan) - 1920x1080 – Medium 18,5 fps
Testconfiguratie
  • CPU Test 2018
  • Geïnt. videokaart (GTX 1050 Ti bij CPU's zonder iGPU)
  • Windows 10
  • High performance energie profiel (tenzij anders aangegeven)
Cinebench 10 (Multi-CPU, 32-bit) 12.929
Testconfiguratie
  • CPU Test 2018
  • Geïnt. videokaart (GTX 1050 Ti bij CPU's zonder iGPU)
  • Windows 10
  • High performance energie profiel (tenzij anders aangegeven)
Cinebench 15 Single Threaded 136
Testconfiguratie
  • CPU Test 2018
  • Geïnt. videokaart (GTX 1050 Ti bij CPU's zonder iGPU)
  • Windows 10
  • High performance energie profiel (tenzij anders aangegeven)
Cinebench 15 Multi Threaded 376
Testconfiguratie
  • CPU Test 2018
  • Geïnt. videokaart (GTX 1050 Ti bij CPU's zonder iGPU)
  • Windows 10
  • High performance energie profiel (tenzij anders aangegeven)
Cinebench 20 Single Threaded 323
Testconfiguratie
  • CPU Test 2018
  • Geïnt. videokaart (GTX 1050 Ti bij CPU's zonder iGPU)
  • Windows 10
  • High performance energie profiel (tenzij anders aangegeven)
Cinebench 20 Multi Threaded 851
Testconfiguratie
  • CPU Test 2018
  • Geïnt. videokaart (GTX 1050 Ti bij CPU's zonder iGPU)
  • Windows 10
  • High performance energie profiel (tenzij anders aangegeven)
Blender 2.79b 348 sec.
Testconfiguratie
  • CPU Test 2018
  • Geïnt. videokaart (GTX 1050 Ti bij CPU's zonder iGPU)
  • Windows 10
  • High performance energie profiel (tenzij anders aangegeven)
AIDA64 (5.97) - Zlib 158,5 MB/s
Testconfiguratie
  • CPU Test 2018
  • Geïnt. videokaart (GTX 1050 Ti bij CPU's zonder iGPU)
  • Windows 10
  • High performance energie profiel (tenzij anders aangegeven)
AIDA64 (5.97) - AES 8.001 MB/s
Testconfiguratie
  • CPU Test 2018
  • Geïnt. videokaart (GTX 1050 Ti bij CPU's zonder iGPU)
  • Windows 10
  • High performance energie profiel (tenzij anders aangegeven)
AIDA64 (5.97) - Hash 1.517 MB/s
Testconfiguratie
  • CPU Test 2018
  • Geïnt. videokaart (GTX 1050 Ti bij CPU's zonder iGPU)
  • Windows 10
  • High performance energie profiel (tenzij anders aangegeven)
AIDA64 (5.97) - Julia 6.164
Testconfiguratie
  • CPU Test 2018
  • Geïnt. videokaart (GTX 1050 Ti bij CPU's zonder iGPU)
  • Windows 10
  • High performance energie profiel (tenzij anders aangegeven)
AIDA64 (5.97) - Mandel 3.144
Testconfiguratie
  • CPU Test 2018
  • Geïnt. videokaart (GTX 1050 Ti bij CPU's zonder iGPU)
  • Windows 10
  • High performance energie profiel (tenzij anders aangegeven)
Geekbench 4.2.3 - CPU Single-Core 4.376
Testconfiguratie
  • CPU Test 2018
  • Geïnt. videokaart (GTX 1050 Ti bij CPU's zonder iGPU)
  • Windows 10
  • High performance energie profiel (tenzij anders aangegeven)
Geekbench 4.2.3 - CPU Multi-Core 8.575
Testconfiguratie
  • CPU Test 2018
  • Geïnt. videokaart (GTX 1050 Ti bij CPU's zonder iGPU)
  • Windows 10
  • High performance energie profiel (tenzij anders aangegeven)
Geekbench 4.2.3 - CPU Single-Core - Crypto 4.198
Testconfiguratie
  • CPU Test 2018
  • Geïnt. videokaart (GTX 1050 Ti bij CPU's zonder iGPU)
  • Windows 10
  • High performance energie profiel (tenzij anders aangegeven)
Geekbench 4.2.3 - CPU Single-Core - Integer 4.441
Testconfiguratie
  • CPU Test 2018
  • Geïnt. videokaart (GTX 1050 Ti bij CPU's zonder iGPU)
  • Windows 10
  • High performance energie profiel (tenzij anders aangegeven)
Geekbench 4.2.3 - CPU Single-Core - Floating Point 3.609
Testconfiguratie
  • CPU Test 2018
  • Geïnt. videokaart (GTX 1050 Ti bij CPU's zonder iGPU)
  • Windows 10
  • High performance energie profiel (tenzij anders aangegeven)
Adobe Lightroom CC - Export 188 sec.
Testconfiguratie
  • CPU Test 2018
  • Geïnt. videokaart (GTX 1050 Ti bij CPU's zonder iGPU)
  • Windows 10
  • High performance energie profiel (tenzij anders aangegeven)
Adobe Photoshop CC - Panorama 57 sec.
Testconfiguratie
  • CPU Test 2018
  • Geïnt. videokaart (GTX 1050 Ti bij CPU's zonder iGPU)
  • Windows 10
  • High performance energie profiel (tenzij anders aangegeven)
Adobe Photoshop CC - Fotobewerking 234 sec.
Testconfiguratie
  • CPU Test 2018
  • Geïnt. videokaart (GTX 1050 Ti bij CPU's zonder iGPU)
  • Windows 10
  • High performance energie profiel (tenzij anders aangegeven)
Adobe Premiere Pro CC - 4K HWI TV 2.579 sec.
Testconfiguratie
  • CPU Test 2018
  • Geïnt. videokaart (GTX 1050 Ti bij CPU's zonder iGPU)
  • Windows 10
  • High performance energie profiel (tenzij anders aangegeven)
Staxrip - x264 (r2901) 28,81 fps
Testconfiguratie
  • CPU Test 2018
  • Geïnt. videokaart (GTX 1050 Ti bij CPU's zonder iGPU)
  • Windows 10
  • High performance energie profiel (tenzij anders aangegeven)
Staxrip - H.264 (QS/VCE) 259,64 fps
Testconfiguratie
  • CPU Test 2018
  • Geïnt. videokaart (GTX 1050 Ti bij CPU's zonder iGPU)
  • Windows 10
  • High performance energie profiel (tenzij anders aangegeven)
Flac - 1 uur WAV naar Flac 333 sec.
Testconfiguratie
  • CPU Test 2018
  • Geïnt. videokaart (GTX 1050 Ti bij CPU's zonder iGPU)
  • Windows 10
  • High performance energie profiel (tenzij anders aangegeven)
Microsoft Word 2016 - 1000 pagina's naar PDF 78 sec.
Testconfiguratie
  • CPU Test 2018
  • Geïnt. videokaart (GTX 1050 Ti bij CPU's zonder iGPU)
  • Windows 10
  • High performance energie profiel (tenzij anders aangegeven)
Microsoft Excel 2016 - Monte Carlo 29,5 sec.
Testconfiguratie
  • CPU Test 2018
  • Geïnt. videokaart (GTX 1050 Ti bij CPU's zonder iGPU)
  • Windows 10
  • High performance energie profiel (tenzij anders aangegeven)
Winrar 5.60 - 4GB inpakken 567 sec.
Testconfiguratie
  • CPU Test 2018
  • Geïnt. videokaart (GTX 1050 Ti bij CPU's zonder iGPU)
  • Windows 10
  • High performance energie profiel (tenzij anders aangegeven)
7-Zip v18.05 - 4GB inpakken 436 sec.
Testconfiguratie
  • CPU Test 2018
  • Geïnt. videokaart (GTX 1050 Ti bij CPU's zonder iGPU)
  • Windows 10
  • High performance energie profiel (tenzij anders aangegeven)
Chrome 67 - Jetstream 151,83
Testconfiguratie
  • CPU Test 2018
  • Geïnt. videokaart (GTX 1050 Ti bij CPU's zonder iGPU)
  • Windows 10
  • High performance energie profiel (tenzij anders aangegeven)
Chrome 75 - Jetstream 2 108,127
Testconfiguratie
  • CPU Test 2018
  • Geïnt. videokaart (GTX 1050 Ti bij CPU's zonder iGPU)
  • Windows 10
  • High performance energie profiel (tenzij anders aangegeven)
Systeemverbruik - Cinebench 15 - Max 55,6 W
Testconfiguratie
  • CPU Test 2018
  • Geïnt. videokaart (GTX 1050 Ti bij CPU's zonder iGPU)
  • Windows 10
  • High performance energie profiel (tenzij anders aangegeven)

Testresultaten 2018 (Windows 10) - GTX 1080 Ti

Far Cry 5 – 1920x1080 – Medium 78 fps
Testconfiguratie
  • CPU Test 2018
  • Icm. GeForce GTX 1080 Ti
  • Windows 10
  • High performance energie profiel
Far Cry 5 – 1920x1080 – Ultra 72 fps
Testconfiguratie
  • CPU Test 2018
  • Icm. GeForce GTX 1080 Ti
  • Windows 10
  • High performance energie profiel
Assassin’s Creed: Origins – 1920x1080 – Medium 51 fps
Testconfiguratie
  • CPU Test 2018
  • Icm. GeForce GTX 1080 Ti
  • Windows 10
  • High performance energie profiel
Assassin’s Creed: Origins – 1920x1080 – Ultra 43 fps
Testconfiguratie
  • CPU Test 2018
  • Icm. GeForce GTX 1080 Ti
  • Windows 10
  • High performance energie profiel
The Witcher 3: Blood & Wine - 1920x1080 - Medium 134,4 fps
Testconfiguratie
  • CPU Test 2018
  • Icm. GeForce GTX 1080 Ti
  • Windows 10
  • High performance energie profiel
The Witcher 3: Blood & Wine - 1920x1080 - Ultra 96,5 fps
Testconfiguratie
  • CPU Test 2018
  • Icm. GeForce GTX 1080 Ti
  • Windows 10
  • High performance energie profiel
GTA V - 1920x1080 – Medium 76,6 fps
Testconfiguratie
  • CPU Test 2018
  • Icm. GeForce GTX 1080 Ti
  • Windows 10
  • High performance energie profiel
GTA V - 1920x1080 - Ultra (2x MSAA, 2x Refl. MSAA) 56,6 fps
Testconfiguratie
  • CPU Test 2018
  • Icm. GeForce GTX 1080 Ti
  • Windows 10
  • High performance energie profiel
Battlefield 1 (DX11) - 1920x1080 – Medium 95,8 fps
Testconfiguratie
  • CPU Test 2018
  • Icm. GeForce GTX 1080 Ti
  • Windows 10
  • High performance energie profiel
Battlefield 1 (DX11) - 1920x1080 – Ultra 88,3 fps
Testconfiguratie
  • CPU Test 2018
  • Icm. GeForce GTX 1080 Ti
  • Windows 10
  • High performance energie profiel
Rise of the Tombraider (DX12) - 1920x1080 - Medium 81,8 fps
Testconfiguratie
  • CPU Test 2018
  • Icm. GeForce GTX 1080 Ti
  • Windows 10
  • High performance energie profiel
Rise of the Tombraider (DX12) - 1920x1080 - Ultra 73 fps
Testconfiguratie
  • CPU Test 2018
  • Icm. GeForce GTX 1080 Ti
  • Windows 10
  • High performance energie profiel
The Division (DX12) - 1920x1080 - Medium 125,8 fps
Testconfiguratie
  • CPU Test 2018
  • Icm. GeForce GTX 1080 Ti
  • Windows 10
  • High performance energie profiel
The Division (DX12) - 1920x1080 - Ultra 96 fps
Testconfiguratie
  • CPU Test 2018
  • Icm. GeForce GTX 1080 Ti
  • Windows 10
  • High performance energie profiel

Testresultaten 2018 (Windows 10) - GTX 1080 Ti - Frametimes

The Witcher 3: Blood & Wine - 1920x1080 - Medium (99p) 12,1 ms
Testconfiguratie
  • CPU Test 2018
  • Icm. GeForce GTX 1080 Ti
  • Windows 10
  • High performance energie profiel
The Witcher 3: Blood & Wine - 1920x1080 - Ultra (99p) 13,6 ms
Testconfiguratie
  • CPU Test 2018
  • Icm. GeForce GTX 1080 Ti
  • Windows 10
  • High performance energie profiel
GTA V - 1920x1080 - Medium (99p) 22 ms
Testconfiguratie
  • CPU Test 2018
  • Icm. GeForce GTX 1080 Ti
  • Windows 10
  • High performance energie profiel
GTA V - 1920x1080 - Ultra (2x MSAA, 2xRefl. MSAA) (99p) 25 ms
Testconfiguratie
  • CPU Test 2018
  • Icm. GeForce GTX 1080 Ti
  • Windows 10
  • High performance energie profiel
Battlefield 1 (DX11) - 1920x1080 - Medium (99p) 18,6 ms
Testconfiguratie
  • CPU Test 2018
  • Icm. GeForce GTX 1080 Ti
  • Windows 10
  • High performance energie profiel
Battlefield 1 (DX11) - 1920x1080 - Ultra (99p) 20,6 ms
Testconfiguratie
  • CPU Test 2018
  • Icm. GeForce GTX 1080 Ti
  • Windows 10
  • High performance energie profiel
Rise of the Tombraider (DX12) - 1920x1080 - Medium (99p) 28,3 ms
Testconfiguratie
  • CPU Test 2018
  • Icm. GeForce GTX 1080 Ti
  • Windows 10
  • High performance energie profiel
Rise of the Tombraider (DX12) - 1920x1080 - Ultra (99p) 28,3 ms
Testconfiguratie
  • CPU Test 2018
  • Icm. GeForce GTX 1080 Ti
  • Windows 10
  • High performance energie profiel

Stroomverbruik 2019 (Enkel CPU)

Stroomverbruik idle - Minimaal 1 W
Testconfiguratie
  • Stroomverbruik processors (enkel CPU) (2019)
Stroomverbruik idle - Gemiddelde 5 min. 1,92 W
Testconfiguratie
  • Stroomverbruik processors (enkel CPU) (2019)
Stroomverbruik - Cinebench 15 - Gemiddeld 23,0 W
Testconfiguratie
  • Stroomverbruik processors (enkel CPU) (2019)
Stroomverbruik - Cinebench 15 - Maximaal 23,11 W
Testconfiguratie
  • Stroomverbruik processors (enkel CPU) (2019)
Adobe Premiere Pro - Verbruik - Gemiddeld 22,7 W
Testconfiguratie
  • Stroomverbruik processors (enkel CPU) (2019)
Adobe Premiere Pro - Verbruik - Totaal (Wh) 17,79 Wh
Testconfiguratie
  • Stroomverbruik processors (enkel CPU) (2019)

Testresultaten 2017 (Windows 10) - Geïnt. GPU of GTX 1050 Ti

3DMark Skydiver 2.844
Testconfiguratie
  • CPU Test 2017
  • Geïnt. videokaart (GTX 1050 Ti bij CPU's zonder iGPU)
  • Windows 10
  • High performance energie profiel (tenzij anders aangegeven)
Counterstrike: Global Offensive - 1920x1080 - Low 33,5 fps
Testconfiguratie
  • CPU Test 2017
  • Geïnt. videokaart (GTX 1050 Ti bij CPU's zonder iGPU)
  • Windows 10
  • High performance energie profiel (tenzij anders aangegeven)
Counterstrike: Global Offensive - 1920x1080 - Medium 28,9 fps
Testconfiguratie
  • CPU Test 2017
  • Geïnt. videokaart (GTX 1050 Ti bij CPU's zonder iGPU)
  • Windows 10
  • High performance energie profiel (tenzij anders aangegeven)
Minecraft - 1920x1080 - Fast 63,7 fps
Testconfiguratie
  • CPU Test 2017
  • Geïnt. videokaart (GTX 1050 Ti bij CPU's zonder iGPU)
  • Windows 10
  • High performance energie profiel (tenzij anders aangegeven)
Minecraft - 1920x1080 - Fancy 51,3 fps
Testconfiguratie
  • CPU Test 2017
  • Geïnt. videokaart (GTX 1050 Ti bij CPU's zonder iGPU)
  • Windows 10
  • High performance energie profiel (tenzij anders aangegeven)
Dota 2 - 1920x1080 - Low 41 fps
Testconfiguratie
  • CPU Test 2017
  • Geïnt. videokaart (GTX 1050 Ti bij CPU's zonder iGPU)
  • Windows 10
  • High performance energie profiel (tenzij anders aangegeven)
Dota 2 - 1920x1080 - Medium 12,4 fps
Testconfiguratie
  • CPU Test 2017
  • Geïnt. videokaart (GTX 1050 Ti bij CPU's zonder iGPU)
  • Windows 10
  • High performance energie profiel (tenzij anders aangegeven)
Cinebench 10 (Multi-CPU, 32-bit) 12.928
Testconfiguratie
  • CPU Test 2017
  • Geïnt. videokaart (GTX 1050 Ti bij CPU's zonder iGPU)
  • Windows 10
  • High performance energie profiel (tenzij anders aangegeven)
Cinebench 15 Single Threaded 148
Testconfiguratie
  • CPU Test 2017
  • Geïnt. videokaart (GTX 1050 Ti bij CPU's zonder iGPU)
  • Windows 10
  • High performance energie profiel (tenzij anders aangegeven)
Cinebench 15 Multi Threaded 378
Testconfiguratie
  • CPU Test 2017
  • Geïnt. videokaart (GTX 1050 Ti bij CPU's zonder iGPU)
  • Windows 10
  • High performance energie profiel (tenzij anders aangegeven)
Cinebench 15 Multi Threaded (Energie profiel balanced) 378
Testconfiguratie
  • CPU Test 2017
  • Geïnt. videokaart (GTX 1050 Ti bij CPU's zonder iGPU)
  • Windows 10
  • High performance energie profiel (tenzij anders aangegeven)
Cinebench 15 multi-core schaling 127,7 %
Testconfiguratie
  • CPU Test 2017
  • Geïnt. videokaart (GTX 1050 Ti bij CPU's zonder iGPU)
  • Windows 10
  • High performance energie profiel (tenzij anders aangegeven)
Blender 2.78c 372 sec.
Testconfiguratie
  • CPU Test 2017
  • Geïnt. videokaart (GTX 1050 Ti bij CPU's zonder iGPU)
  • Windows 10
  • High performance energie profiel (tenzij anders aangegeven)
AIDA64 (5.90.4247) - Zlib 161,3 MB/s
Testconfiguratie
  • CPU Test 2017
  • Geïnt. videokaart (GTX 1050 Ti bij CPU's zonder iGPU)
  • Windows 10
  • High performance energie profiel (tenzij anders aangegeven)
AIDA64 (5.90.4247) - AES 8.002 MB/s
Testconfiguratie
  • CPU Test 2017
  • Geïnt. videokaart (GTX 1050 Ti bij CPU's zonder iGPU)
  • Windows 10
  • High performance energie profiel (tenzij anders aangegeven)
AIDA64 (5.90.4247) - Hash 1.516 MB/s
Testconfiguratie
  • CPU Test 2017
  • Geïnt. videokaart (GTX 1050 Ti bij CPU's zonder iGPU)
  • Windows 10
  • High performance energie profiel (tenzij anders aangegeven)
AIDA64 (5.90.4247) - VP8 4.469
Testconfiguratie
  • CPU Test 2017
  • Geïnt. videokaart (GTX 1050 Ti bij CPU's zonder iGPU)
  • Windows 10
  • High performance energie profiel (tenzij anders aangegeven)
AIDA64 (5.90.4247) - Julia 6.169
Testconfiguratie
  • CPU Test 2017
  • Geïnt. videokaart (GTX 1050 Ti bij CPU's zonder iGPU)
  • Windows 10
  • High performance energie profiel (tenzij anders aangegeven)
AIDA64 (5.90.4247) - Mandel 3.145
Testconfiguratie
  • CPU Test 2017
  • Geïnt. videokaart (GTX 1050 Ti bij CPU's zonder iGPU)
  • Windows 10
  • High performance energie profiel (tenzij anders aangegeven)
PCMark 8 - Home 3.035
Testconfiguratie
  • CPU Test 2017
  • Geïnt. videokaart (GTX 1050 Ti bij CPU's zonder iGPU)
  • Windows 10
  • High performance energie profiel (tenzij anders aangegeven)
PCMark 8 - Creativity 2.991
Testconfiguratie
  • CPU Test 2017
  • Geïnt. videokaart (GTX 1050 Ti bij CPU's zonder iGPU)
  • Windows 10
  • High performance energie profiel (tenzij anders aangegeven)
PCMark 8 - Work 3.426
Testconfiguratie
  • CPU Test 2017
  • Geïnt. videokaart (GTX 1050 Ti bij CPU's zonder iGPU)
  • Windows 10
  • High performance energie profiel (tenzij anders aangegeven)
Adobe Lightroom 6 - Export 72 sec.
Testconfiguratie
  • CPU Test 2017
  • Geïnt. videokaart (GTX 1050 Ti bij CPU's zonder iGPU)
  • Windows 10
  • High performance energie profiel (tenzij anders aangegeven)
Adobe Photoshop CC 2017 - Panorama 63 sec.
Testconfiguratie
  • CPU Test 2017
  • Geïnt. videokaart (GTX 1050 Ti bij CPU's zonder iGPU)
  • Windows 10
  • High performance energie profiel (tenzij anders aangegeven)
Adobe Photoshop CC 2017 - Fotobewerking 275 sec.
Testconfiguratie
  • CPU Test 2017
  • Geïnt. videokaart (GTX 1050 Ti bij CPU's zonder iGPU)
  • Windows 10
  • High performance energie profiel (tenzij anders aangegeven)
Adobe Photoshop CC 2017 - Fotobewerking - OpenCL 95 sec.
Testconfiguratie
  • CPU Test 2017
  • Geïnt. videokaart (GTX 1050 Ti bij CPU's zonder iGPU)
  • Windows 10
  • High performance energie profiel (tenzij anders aangegeven)
Adobe Premiere Pro 2017 - 4K HWI TV 478 sec.
Testconfiguratie
  • CPU Test 2017
  • Geïnt. videokaart (GTX 1050 Ti bij CPU's zonder iGPU)
  • Windows 10
  • High performance energie profiel (tenzij anders aangegeven)
Staxrip - x264 28,6 fps
Testconfiguratie
  • CPU Test 2017
  • Geïnt. videokaart (GTX 1050 Ti bij CPU's zonder iGPU)
  • Windows 10
  • High performance energie profiel (tenzij anders aangegeven)
Staxrip - x265 10,67 fps
Testconfiguratie
  • CPU Test 2017
  • Geïnt. videokaart (GTX 1050 Ti bij CPU's zonder iGPU)
  • Windows 10
  • High performance energie profiel (tenzij anders aangegeven)
Staxrip - H.264 (QS/VCE) 262,26 fps
Testconfiguratie
  • CPU Test 2017
  • Geïnt. videokaart (GTX 1050 Ti bij CPU's zonder iGPU)
  • Windows 10
  • High performance energie profiel (tenzij anders aangegeven)
Flac - 1 uur WAV naar Flac 324 sec.
Testconfiguratie
  • CPU Test 2017
  • Geïnt. videokaart (GTX 1050 Ti bij CPU's zonder iGPU)
  • Windows 10
  • High performance energie profiel (tenzij anders aangegeven)
Microsoft Word 2016 - 1000 pagina's naar PDF 65 sec.
Testconfiguratie
  • CPU Test 2017
  • Geïnt. videokaart (GTX 1050 Ti bij CPU's zonder iGPU)
  • Windows 10
  • High performance energie profiel (tenzij anders aangegeven)
Microsoft Excel 2016 - Monte Carlo 10 sec.
Testconfiguratie
  • CPU Test 2017
  • Geïnt. videokaart (GTX 1050 Ti bij CPU's zonder iGPU)
  • Windows 10
  • High performance energie profiel (tenzij anders aangegeven)
Winrar 5.40 - 2GB inpakken 162 sec.
Testconfiguratie
  • CPU Test 2017
  • Geïnt. videokaart (GTX 1050 Ti bij CPU's zonder iGPU)
  • Windows 10
  • High performance energie profiel (tenzij anders aangegeven)
7-Zip - 2GB inpakken 231 sec.
Testconfiguratie
  • CPU Test 2017
  • Geïnt. videokaart (GTX 1050 Ti bij CPU's zonder iGPU)
  • Windows 10
  • High performance energie profiel (tenzij anders aangegeven)
Chrome 58 - Jetstream 181,2
Testconfiguratie
  • CPU Test 2017
  • Geïnt. videokaart (GTX 1050 Ti bij CPU's zonder iGPU)
  • Windows 10
  • High performance energie profiel (tenzij anders aangegeven)
Stroomverbruik - Cinebench 15 - Max 44,6 W
Testconfiguratie
  • CPU Test 2017
  • Geïnt. videokaart (GTX 1050 Ti bij CPU's zonder iGPU)
  • Windows 10
  • High performance energie profiel (tenzij anders aangegeven)
Stroomverbruik - Cinebench 15 - Max (Energie prof. balanced) 44,4 W
Testconfiguratie
  • CPU Test 2017
  • Geïnt. videokaart (GTX 1050 Ti bij CPU's zonder iGPU)
  • Windows 10
  • High performance energie profiel (tenzij anders aangegeven)
Stroomverbruik idle - Gemiddelde 5 min. 20,4 W
Testconfiguratie
  • CPU Test 2017
  • Geïnt. videokaart (GTX 1050 Ti bij CPU's zonder iGPU)
  • Windows 10
  • High performance energie profiel (tenzij anders aangegeven)
Stroomverbruik idle - Gemiddelde 5 min.(Energie pr. balanced 20,4 W
Testconfiguratie
  • CPU Test 2017
  • Geïnt. videokaart (GTX 1050 Ti bij CPU's zonder iGPU)
  • Windows 10
  • High performance energie profiel (tenzij anders aangegeven)
Stroomverbruik 3DMark Skydiver - Gemiddeld 38,8 W
Testconfiguratie
  • CPU Test 2017
  • Geïnt. videokaart (GTX 1050 Ti bij CPU's zonder iGPU)
  • Windows 10
  • High performance energie profiel (tenzij anders aangegeven)
Stroomverbruik Premiere Pro - 4K HWI TV - Verbruik 6,1 Wh
Testconfiguratie
  • CPU Test 2017
  • Geïnt. videokaart (GTX 1050 Ti bij CPU's zonder iGPU)
  • Windows 10
  • High performance energie profiel (tenzij anders aangegeven)
Stroomverbruik Premiere Pro - 4K HWI TV - Gemiddeld 45,9 W
Testconfiguratie
  • CPU Test 2017
  • Geïnt. videokaart (GTX 1050 Ti bij CPU's zonder iGPU)
  • Windows 10
  • High performance energie profiel (tenzij anders aangegeven)
Perf. / Watt - Cinebench 15 8,5 cb/W
Testconfiguratie
  • CPU Test 2017
  • Geïnt. videokaart (GTX 1050 Ti bij CPU's zonder iGPU)
  • Windows 10
  • High performance energie profiel (tenzij anders aangegeven)

Testresultaten 2017 (Windows 10) - GTX 1080 Ti

Prey - 1920x1080 - Medium 181,3 fps
Testconfiguratie
  • CPU Test 2017
  • In combinatie met GeForce GTX 1080 Ti
  • Windows 10
  • High performance energie profiel
Prey - 1920x1080 - Ultra 168,7 fps
Testconfiguratie
  • CPU Test 2017
  • In combinatie met GeForce GTX 1080 Ti
  • Windows 10
  • High performance energie profiel
GTA V - 1920x1080 - Medium 84,1 fps
Testconfiguratie
  • CPU Test 2017
  • In combinatie met GeForce GTX 1080 Ti
  • Windows 10
  • High performance energie profiel
GTA V - 1920x1080 - Ultra (2x MSAA, 0x Refl. MSAA) 51,7 fps
Testconfiguratie
  • CPU Test 2017
  • In combinatie met GeForce GTX 1080 Ti
  • Windows 10
  • High performance energie profiel
Battlefield 1 (DX12) - 1920x1080 - Medium 105,2 fps
Testconfiguratie
  • CPU Test 2017
  • In combinatie met GeForce GTX 1080 Ti
  • Windows 10
  • High performance energie profiel
Battlefield 1 (DX12) - 1920x1080 - Ultra 94,7 fps
Testconfiguratie
  • CPU Test 2017
  • In combinatie met GeForce GTX 1080 Ti
  • Windows 10
  • High performance energie profiel
Doom (Vulkan) - 1920x1080 - Medium 199,2 fps
Testconfiguratie
  • CPU Test 2017
  • In combinatie met GeForce GTX 1080 Ti
  • Windows 10
  • High performance energie profiel
Doom (Vulkan) - 1920x1080 - Ultra 198,7 fps
Testconfiguratie
  • CPU Test 2017
  • In combinatie met GeForce GTX 1080 Ti
  • Windows 10
  • High performance energie profiel
Rise of the Tombraider (DX12) - 1920x1080 - Medium 153 fps
Testconfiguratie
  • CPU Test 2017
  • In combinatie met GeForce GTX 1080 Ti
  • Windows 10
  • High performance energie profiel
Rise of the Tombraider (DX12) - 1920x1080 - Ultra 141 fps
Testconfiguratie
  • CPU Test 2017
  • In combinatie met GeForce GTX 1080 Ti
  • Windows 10
  • High performance energie profiel
Stroomverbruik - Cinebench 15 - Max 54,7 W
Testconfiguratie
  • CPU Test 2017
  • In combinatie met GeForce GTX 1080 Ti
  • Windows 10
  • High performance energie profiel
Stroomverbruik idle - Gemiddelde 5 min. 30,0 W
Testconfiguratie
  • CPU Test 2017
  • In combinatie met GeForce GTX 1080 Ti
  • Windows 10
  • High performance energie profiel

Testresultaten 2017 (Windows 10) - GTX 1080 Ti - Frametimes

Prey - 1920x1080 - Medium (99p) 8,2 ms
Testconfiguratie
  • CPU Test 2017
  • In combinatie met GeForce GTX 1080 Ti
  • Windows 10
  • High performance energie profiel
Prey - 1920x1080 - Ultra (99p) 11,9 ms
Testconfiguratie
  • CPU Test 2017
  • In combinatie met GeForce GTX 1080 Ti
  • Windows 10
  • High performance energie profiel
GTA V - 1920x1080 - Medium (99p) 17 ms
Testconfiguratie
  • CPU Test 2017
  • In combinatie met GeForce GTX 1080 Ti
  • Windows 10
  • High performance energie profiel
GTA V - 1920x1080 - Ultra (2x MSAA, 0xRefl. MSAA) (99p) 31 ms
Testconfiguratie
  • CPU Test 2017
  • In combinatie met GeForce GTX 1080 Ti
  • Windows 10
  • High performance energie profiel
Battlefield 1 (DX12) - 1920x1080 - Medium (99p) 17,5 ms
Testconfiguratie
  • CPU Test 2017
  • In combinatie met GeForce GTX 1080 Ti
  • Windows 10
  • High performance energie profiel
Battlefield 1 (DX12) - 1920x1080 - Ultra (99p) 19 ms
Testconfiguratie
  • CPU Test 2017
  • In combinatie met GeForce GTX 1080 Ti
  • Windows 10
  • High performance energie profiel
Doom (Vulkan) - 1920x1080 - Medium (99p) 6,6 ms
Testconfiguratie
  • CPU Test 2017
  • In combinatie met GeForce GTX 1080 Ti
  • Windows 10
  • High performance energie profiel
Doom (Vulkan) - 1920x1080 - Ultra (99p) 6,6 ms
Testconfiguratie
  • CPU Test 2017
  • In combinatie met GeForce GTX 1080 Ti
  • Windows 10
  • High performance energie profiel
Prey - 1920x1080 - Medium (min. FPS 99p) 122,0 fps
Testconfiguratie
  • CPU Test 2017
  • In combinatie met GeForce GTX 1080 Ti
  • Windows 10
  • High performance energie profiel
Prey - 1920x1080 - Ultra (min. FPS 99p) 84,0 fps
Testconfiguratie
  • CPU Test 2017
  • In combinatie met GeForce GTX 1080 Ti
  • Windows 10
  • High performance energie profiel
GTA V - 1920x1080 - Medium (min. FPS 99p) 58,8 fps
Testconfiguratie
  • CPU Test 2017
  • In combinatie met GeForce GTX 1080 Ti
  • Windows 10
  • High performance energie profiel
GTA V - 1920x1080 - Ultra (2x MSAA, 0xRefl. MSAA) (min. FPS 32,3 fps
Testconfiguratie
  • CPU Test 2017
  • In combinatie met GeForce GTX 1080 Ti
  • Windows 10
  • High performance energie profiel
Battlefield 1 (DX12) - 1920x1080 - Medium (min. FPS 99p) 57,1 fps
Testconfiguratie
  • CPU Test 2017
  • In combinatie met GeForce GTX 1080 Ti
  • Windows 10
  • High performance energie profiel
Battlefield 1 (DX12) - 1920x1080 - Ultra (min. FPS 99p) 52,6 fps
Testconfiguratie
  • CPU Test 2017
  • In combinatie met GeForce GTX 1080 Ti
  • Windows 10
  • High performance energie profiel
Doom (Vulkan) - 1920x1080 - Medium (min. FPS 99p) 151,5 fps
Testconfiguratie
  • CPU Test 2017
  • In combinatie met GeForce GTX 1080 Ti
  • Windows 10
  • High performance energie profiel
Doom (Vulkan) - 1920x1080 - Ultra (min. FPS 99p) 151,5 fps
Testconfiguratie
  • CPU Test 2017
  • In combinatie met GeForce GTX 1080 Ti
  • Windows 10
  • High performance energie profiel

Testresultaten 2016 (Windows 10) - Geïnt. GPU of GTX 750 Ti

3DMark Cloudgate 5.544
Testconfiguratie
  • CPU Test 2016
  • Geïnt. videokaart (GTX 750 Ti bij CPU's zonder iGPU)
  • Windows 10
3DMark FireStrike 681
Testconfiguratie
  • CPU Test 2016
  • Geïnt. videokaart (GTX 750 Ti bij CPU's zonder iGPU)
  • Windows 10
CounterStrike Global Offensive - 1920x1080 - Low 33,1 fps
Testconfiguratie
  • CPU Test 2016
  • Geïnt. videokaart (GTX 750 Ti bij CPU's zonder iGPU)
  • Windows 10
CounterStrike Global Offensive - 1920x1080 - Medium 26,89 fps
Testconfiguratie
  • CPU Test 2016
  • Geïnt. videokaart (GTX 750 Ti bij CPU's zonder iGPU)
  • Windows 10
MineCraft - 1920x1080 - Fast 72,8 fps
Testconfiguratie
  • CPU Test 2016
  • Geïnt. videokaart (GTX 750 Ti bij CPU's zonder iGPU)
  • Windows 10
MineCraft - 1920x1080 - Fancy 57,2 fps
Testconfiguratie
  • CPU Test 2016
  • Geïnt. videokaart (GTX 750 Ti bij CPU's zonder iGPU)
  • Windows 10
Dota 2 - 1920x1080 - Low 61,9 fps
Testconfiguratie
  • CPU Test 2016
  • Geïnt. videokaart (GTX 750 Ti bij CPU's zonder iGPU)
  • Windows 10
Dota 2 - 1920x1080 - Medium 14,8 fps
Testconfiguratie
  • CPU Test 2016
  • Geïnt. videokaart (GTX 750 Ti bij CPU's zonder iGPU)
  • Windows 10
Gemiddelde fps met IGP 38,8
Testconfiguratie
  • CPU Test 2016
  • Geïnt. videokaart (GTX 750 Ti bij CPU's zonder iGPU)
  • Windows 10
Cinebench 10 (Multi-CPU, 32-bit) 12.987
Testconfiguratie
  • CPU Test 2016
  • Geïnt. videokaart (GTX 750 Ti bij CPU's zonder iGPU)
  • Windows 10
Cinebench 15 Single Threaded 148
Testconfiguratie
  • CPU Test 2016
  • Geïnt. videokaart (GTX 750 Ti bij CPU's zonder iGPU)
  • Windows 10
Cinebench 15 Multi Threaded 381
Testconfiguratie
  • CPU Test 2016
  • Geïnt. videokaart (GTX 750 Ti bij CPU's zonder iGPU)
  • Windows 10
AIDA64 - Zlib 158,8 MB/s
Testconfiguratie
  • CPU Test 2016
  • Geïnt. videokaart (GTX 750 Ti bij CPU's zonder iGPU)
  • Windows 10
AIDA64 - AES 629 MB/s
Testconfiguratie
  • CPU Test 2016
  • Geïnt. videokaart (GTX 750 Ti bij CPU's zonder iGPU)
  • Windows 10
AIDA64 - Hash 1.163 MB/s
Testconfiguratie
  • CPU Test 2016
  • Geïnt. videokaart (GTX 750 Ti bij CPU's zonder iGPU)
  • Windows 10
AIDA64 - VP8 3.573
Testconfiguratie
  • CPU Test 2016
  • Geïnt. videokaart (GTX 750 Ti bij CPU's zonder iGPU)
  • Windows 10
AIDA64 - Julia 4.376
Testconfiguratie
  • CPU Test 2016
  • Geïnt. videokaart (GTX 750 Ti bij CPU's zonder iGPU)
  • Windows 10
AIDA64 - Mandel 2.149
Testconfiguratie
  • CPU Test 2016
  • Geïnt. videokaart (GTX 750 Ti bij CPU's zonder iGPU)
  • Windows 10
Handbrake - 30 min. 1080p (x264) 47,52 fps
Testconfiguratie
  • CPU Test 2016
  • Geïnt. videokaart (GTX 750 Ti bij CPU's zonder iGPU)
  • Windows 10
Handbrake - 30 min. 1080p (H.264 QS/VCE) 260,65 fps
Testconfiguratie
  • CPU Test 2016
  • Geïnt. videokaart (GTX 750 Ti bij CPU's zonder iGPU)
  • Windows 10
Handbrake - 30 min. 1080p (x265) 14,8 fps
Testconfiguratie
  • CPU Test 2016
  • Geïnt. videokaart (GTX 750 Ti bij CPU's zonder iGPU)
  • Windows 10
Adobe Photoshop CC 2015 - HWI Bench 49 sec.
Testconfiguratie
  • CPU Test 2016
  • Geïnt. videokaart (GTX 750 Ti bij CPU's zonder iGPU)
  • Windows 10
Adobe Photoshop CC 2015 - HWI OpenCL Bench 74 sec.
Testconfiguratie
  • CPU Test 2016
  • Geïnt. videokaart (GTX 750 Ti bij CPU's zonder iGPU)
  • Windows 10
Adobe Premiere CC 2015 - HWI Bench (zonder versnelling) 486 sec.
Testconfiguratie
  • CPU Test 2016
  • Geïnt. videokaart (GTX 750 Ti bij CPU's zonder iGPU)
  • Windows 10
7Zip - Encoding benchmark 9.400 kByte/s
Testconfiguratie
  • CPU Test 2016
  • Geïnt. videokaart (GTX 750 Ti bij CPU's zonder iGPU)
  • Windows 10
WinRAR 5.20 - Encoding benchmark 2.859 kByte/s
Testconfiguratie
  • CPU Test 2016
  • Geïnt. videokaart (GTX 750 Ti bij CPU's zonder iGPU)
  • Windows 10
Word 2016 - 1000 pagina's PDF 60 sec.
Testconfiguratie
  • CPU Test 2016
  • Geïnt. videokaart (GTX 750 Ti bij CPU's zonder iGPU)
  • Windows 10
Excel 2016 - Monte Carlo 10,798 sec.
Testconfiguratie
  • CPU Test 2016
  • Geïnt. videokaart (GTX 750 Ti bij CPU's zonder iGPU)
  • Windows 10
Google Chrome 44 - Mozilla Kraken 1.1 1.016,6 ms
Testconfiguratie
  • CPU Test 2016
  • Geïnt. videokaart (GTX 750 Ti bij CPU's zonder iGPU)
  • Windows 10
Stroomverbruik - Cinebench 15 - Max 58,1 W
Testconfiguratie
  • CPU Test 2016
  • Geïnt. videokaart (GTX 750 Ti bij CPU's zonder iGPU)
  • Windows 10
Stroomverbruik idle - Gemiddelde 5 min. 28,8 W
Testconfiguratie
  • CPU Test 2016
  • Geïnt. videokaart (GTX 750 Ti bij CPU's zonder iGPU)
  • Windows 10
Stroomverbruik 3DMark Cloud Gate - Gemiddeld 55,6 W
Testconfiguratie
  • CPU Test 2016
  • Geïnt. videokaart (GTX 750 Ti bij CPU's zonder iGPU)
  • Windows 10

Testresultaten 2016 (Windows 10) - I.c.m. GTX 960

F1 2015 - 1920x1080 - Medium 86,9 fps
Testconfiguratie
  • CPU Test 2016
  • In combinatie met GeForce GTX 960
  • Windows 10
F1 2015 - 1920x1080 - Ultra 56,4 fps
Testconfiguratie
  • CPU Test 2016
  • In combinatie met GeForce GTX 960
  • Windows 10
GTA V - 1920x1080 - Medium 83,2 fps
Testconfiguratie
  • CPU Test 2016
  • In combinatie met GeForce GTX 960
  • Windows 10
GTA V - 1920x1080 - Ultra(4x AA, 0x Refl. AA) 22,6 fps
Testconfiguratie
  • CPU Test 2016
  • In combinatie met GeForce GTX 960
  • Windows 10
Mad Max - 1920x1080 - Medium 101,8 fps
Testconfiguratie
  • CPU Test 2016
  • In combinatie met GeForce GTX 960
  • Windows 10
Mad Max - 1920x1080 - Ultra 70,6 fps
Testconfiguratie
  • CPU Test 2016
  • In combinatie met GeForce GTX 960
  • Windows 10
Gemiddelde fps (GTX 960) 63,6
Testconfiguratie
  • CPU Test 2016
  • In combinatie met GeForce GTX 960
  • Windows 10
Stroomverbruik idle - Gemiddelde 5 min. 43,2 W
Testconfiguratie
  • CPU Test 2016
  • In combinatie met GeForce GTX 960
  • Windows 10
Stroomverbruik - Cinebench 15 - Max 69,6 W
Testconfiguratie
  • CPU Test 2016
  • In combinatie met GeForce GTX 960
  • Windows 10

Testresultaten 2016 (Windows 10) - I.c.m. GTX 980

F1 2015 - 1920x1080 - Medium 134,4 fps
Testconfiguratie
  • CPU Test 2016
  • In combinatie met GeForce GTX 980
  • Windows 10
F1 2015 - 1920x1080 - Ultra 107,5 fps
Testconfiguratie
  • CPU Test 2016
  • In combinatie met GeForce GTX 980
  • Windows 10
GTA V - 1920x1080 - Medium 82,1 fps
Testconfiguratie
  • CPU Test 2016
  • In combinatie met GeForce GTX 980
  • Windows 10
GTA V - 1920x1080 - Ultra(4x AA, 0x Refl. AA) 37,2 fps
Testconfiguratie
  • CPU Test 2016
  • In combinatie met GeForce GTX 980
  • Windows 10
Mad Max - 1920x1080 - Medium 187,2 fps
Testconfiguratie
  • CPU Test 2016
  • In combinatie met GeForce GTX 980
  • Windows 10
Mad Max - 1920x1080 - Ultra 131,7 fps
Testconfiguratie
  • CPU Test 2016
  • In combinatie met GeForce GTX 980
  • Windows 10
Gemiddelde fps (GTX 980) 101,4
Testconfiguratie
  • CPU Test 2016
  • In combinatie met GeForce GTX 980
  • Windows 10

Stroomverbruik 2017 (Enkel CPU)

Idle - Verbruik 0,012 Ah
Testconfiguratie
  • Stroomverbruik processors (enkel CPU)
Stroomverbruik idle - Gemiddelde 5 min. 1,7 W
Testconfiguratie
  • Stroomverbruik processors (enkel CPU)
Cinebench 15 - Load - Verbruik 0,049 Ah
Testconfiguratie
  • Stroomverbruik processors (enkel CPU)
Stroomverbruik - Cinebench 15 - Gemiddeld 24,1 W
Testconfiguratie
  • Stroomverbruik processors (enkel CPU)
Adobe Premiere Pro - Verbruik 0,28 Ah
Testconfiguratie
  • Stroomverbruik processors (enkel CPU)
Stroomverbruik Premiere Pro - 4K HWI TV - Gemiddeld 25,2 W
Testconfiguratie
  • Stroomverbruik processors (enkel CPU)

Reviews

Processors

42 AMD en Intel CPU's review: wat is de beste processor?

AMD en Intel concurreerden in 2017 weer met elkaar, met aan de lopende band nieuwe processors. Tijd om de balans op te maken: welke processor moet je kopen voor welk gebruiksdoeleinde? Met dit artikel weet je welke CPU voor jou de beste is!

10 maart 2018 05:59
Processors

Intel Pentium G4560 review: de ultieme budgetprocessor

De interessantste Kaby Lake-processor is misschien wel een Pentium van gemiddeld nog geen 70 euro. Een relatief hoge kloksnelheid en ondersteuning voor HyperThreading maken van deze Pentium G4560 een razend interessante budgetprocessor.

25 april 2017 05:59

Alternatieven

Intel Core i7 6700K Boxed

  • Socket 1151
  • 4 GHz
  • 4 cores
  • 95 W
  • Geïntegreerde GPU
 

Intel Core i5 8400 Boxed

  • Socket 1151
  • 2.8 GHz
  • 6 cores
  • 65 W
  • Geïntegreerde GPU
 

Intel Core i3 8350K Boxed

  • Socket 1151
  • 4.0 GHz
  • 4 cores
  • 91 W
  • Geïntegreerde GPU
 

Intel Core i7 8700K Boxed

  • Socket 1151
  • 3.7 GHz
  • 6 cores
  • 95 W
  • Geïntegreerde GPU
 

Intel Core i5 8600K Boxed

  • Socket 1151
  • 3.6 GHz
  • 6 cores
  • 95 W
  • Geïntegreerde GPU
 

AMD Ryzen 7 1800X Boxed

  • Socket AM4
  • 3.6 GHz
  • 8 cores
  • 95 W
 

AMD Ryzen 5 1600 Boxed

  • Socket AM4
  • 3.2 GHz
  • 6 cores
  • 65 W
 

AMD Ryzen 7 1700 Boxed

  • Socket AM4
  • 3.0 GHz
  • 8 cores
  • 65 W
 

AMD Ryzen 3 2200G Boxed

  • Socket AM4
  • 3.5 GHz
  • 4 cores
  • 65 W
  • Geïntegreerde GPU
 

Intel Core i7 2600K

  • Socket 1155
  • 3.4 GHz
  • 4 cores
  • 95 W
  • Geïntegreerde GPU
 

Intel Core i7 8700 Boxed

  • Socket 1151
  • 3.2 GHz
  • 6 cores
  • 65 W
  • Geïntegreerde GPU
 

Intel Core i3 8100 Boxed

  • Socket 1151
  • 3.6 GHz
  • 4 cores
  • 65 W
  • Geïntegreerde GPU
 
0