

SLI Benchmarks
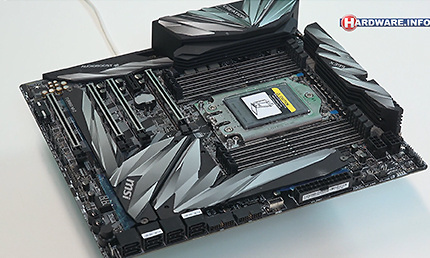
Beide moederborden hebben we getest met nVidia GeForce 6600 GT, GeForce 6800 GT en 6800 Ultra videokaarten, zowel in single- als in SLI-modus. Als benchmarks maakten we gebruik van Doom 3, Aquamark 3, FarCry 1.3, 3DMark03 en 3DMark05. Bij deze test is gebruik gemaakt van een AMD Athlon 64 FX-55 processor met 1 GB A-Data DDR400 geheugen en een Western Digital Raptor 74 GB harddisk. Alle scores zijn in onderstaande tabel terug te vinden
| ASUS | SLI | SLI | SLI | Speedup | Speedup | Speedup | ||||
| A8N-SLI Deluxe | 1x 6600 | 2x 6600 | 1x 6800 | 2x 6800 | 6800u | 2x6800u | 6600 | 6800 | 6800u | |
| Doom 3 [1024x768] | 83,9 | 99,9 | 108,4 | 113 | 111,2 | 110,7 | 119,1% | 104,2% | 99,6% | |
| Doom 3 [1024x768 - 4x AA 8x AF] | 40,5 | 65,8 | 73,2 | 104,8 | 80,7 | 107,1 | 162,5% | 143,2% | 132,7% | |
| Doom 3 [1600x1200] | 43,2 | 70,1 | 69,1 | 102,5 | 78,3 | 106,5 | 162,3% | 148,3% | 136,0% | |
| Doom 3 [1600x1200 - 4x AA 8x AF] | 17,9 | 28,7 | 35,3 | 62 | 38,9 | 51 | 160,3% | 175,6% | 131,1% | |
| Aquamark 3 [1024x768] | 62,21 | 77,23 | 71,41 | 82 | 75,34 | 82,57 | 124,1% | 114,8% | 109,6% | |
| Aquamark 3 [1024x768 - 4x AA 8x AF] | 44,89 | 69,12 | 54,77 | 75,38 | 61,32 | 77,32 | 154,0% | 137,6% | 126,1% | |
| Aquamark 3 [1600x1200] | 41,7 | 65,77 | 56,88 | 76,14 | 63,22 | 78,67 | 157,7% | 133,9% | 124,4% | |
| Aquamark 3 [1600x1200 - 4x AA 8x AF] | 23,49 | 44,84 | 34,47 | 60,33 | 39,04 | 63,72 | 190,9% | 175,0% | 163,2% | |
| FarCry 1.3 [1024x768] | 87,62 | 83,98 | 94,97 | 90,48 | 94,14 | 88,49 | 95,8% | 95,3% | 94,0% | |
| FarCry 1.3 [1024x768 - 4x AA 8x AF] | 53,35 | 59,61 | 83,23 | 90,27 | 88,43 | 88,59 | 111,7% | 108,5% | 100,2% | |
| FarCry 1.3 [1600x1200] | 49,99 | 65,02 | 78,21 | 89,61 | 85,89 | 88,81 | 130,1% | 114,6% | 103,4% | |
| FarCry 1.3 [1600x1200 - 4x AA 8x AF] | 23,94 | 34,96 | 42,26 | 61,82 | 47,18 | 65,82 |
7. Conclusie
Advertentie
Bekijk ook deze moederbord artikelen op Hardware Info
Moederborden
AM5 voor een prikkie: AMD’s A620-chipset en de eerste moederborden op een rijtje
17 mei 2023 18:35
Moederborden
AMD Ryzen 7000: de acht goedkoopste B650 ATX-moederborden op een rijtje - Update
12 februari 2023 09:00


|