Getest

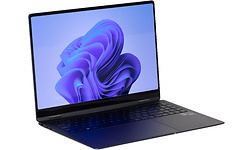
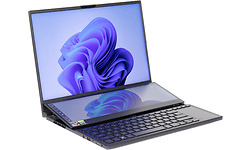
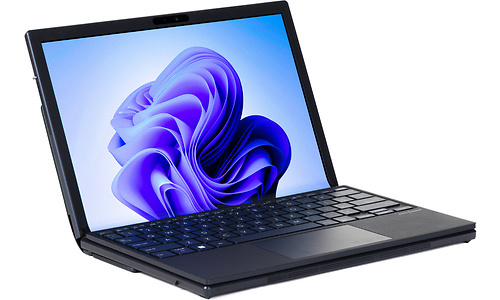
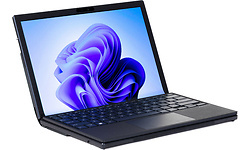
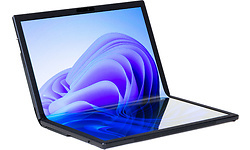
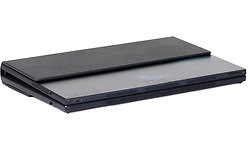
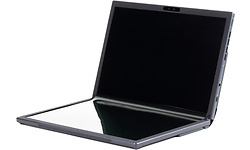
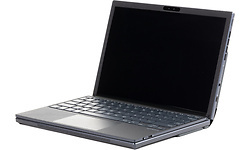
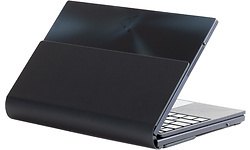
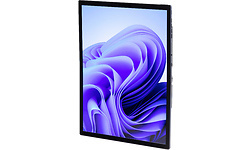
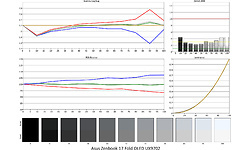
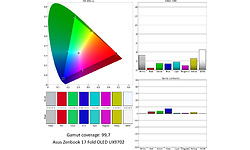
Asus Zenbook 17 Fold OLED UX9702

Specificaties

Belangrijkste specificaties

Processor type Intel Core i7 1250U
Geheugen capaciteit 16 GB
Scherm diagonaal 17,3 inch
Resolutie 2560x1920
Touchscreen
GPU type Intel Iris Xe Graphics G7 (Tiger Lake 96 EU)
Totale opslagcapaciteit 1.024 GB
Toetsenbordindeling Qwerty
Gewicht totaal 1,83 kg
Besturingssysteem (serie) Windows

Processor / Chipset / Geheugen

Processor serie Intel Core i7
Processor type Intel Core i7 1250U
Processor klokfrequentie 4,7 GHz
Processor klokfrequentie (max. turbo) 4,7 GHz
Configureerbare TDP-down 9 W
Configureerbare TDP-up 29 W
Aantal processorcores 10
Geheugen capaciteit 16 GB
Type geheugen LPDDR5
Geheugen klokfrequentie 5.200 MHz
Geheugen form factor On-board
SODIMM sloten 0
Vrije SODIMM sloten 0

Scherm

Scherm diagonaal 17,3 inch
Resolutie 2560x1920
Verhouding 4:3
Pixeldichtheid 185 ppi
Scherm type (mat/glans) Glanzend
Paneeltype OLED
Touchscreen
Aanraakpunten touchscreen 10 aanraakpunten
Touchscreen type Capacitief
Maximale verversingsfrequentie 60 Hz

Graphics

GPU type Intel Iris Xe Graphics G7 (Tiger Lake 96 EU)
Geïntegreerde / losse GPU Geïntegreerd

Opslag

Totale opslagcapaciteit 1.024 GB
SSD opslagcapaciteit 1.024 GB
Beschikbaar opslaggeheugen 907,3 GB
Aantal harddisks / SSD's 1
Harddisk/SSD 1 capaciteit 1.024 GB
Harddisk/SSD 1 soort SSD/Flash
Harddisk/SSD 1 form factor M.2
DVD branden
Blu-ray lezen
Blu-ray branden

Connectiviteit / Netwerk

Netwerkaansluiting (bedraad)
WiFi standaard 802.11ax (Wi-Fi 6E)
WiFi adapter Intel(R) Wi-Fi 6E AX211 160Mhz
Bluetooth
Bluetooth-versie Bluetooth 5.2
4G (LTE)
5G

Aansluitingen

Smartcard
Thunderbolt 4 (Type-C) 2
Cardreader - SD
Cardreader - MicroSD
DVI-uitgang
VGA-uitgang
HDMI-uitgang
Micro HDMI-uitgang
DisplayPort-uitgang
Mini DisplayPort-uitgang
Aansluiting dockingstation
Kensingtonslot

Toetsenbord en touchpad

Toetsenbordindeling Qwerty
Numeriek toetsenbord
Touchpad afzonderlijke muistoetsen

Camera

Webcam
Webcam resolutie 4,9 MPixel
Tweede camera
Tweede cameraresolutie 0,9 MPixel
Flitser
Camera Windows Hello compatible
Webcamschuifje

Sensors

Accelerometer
Vingerafdruklezer
NFC

Overige hardware

Geïntegreerde microfoon

Maten en gewichten

Accu capaciteit (mAh) 74,7 mAh
Verwisselbare accu
Gewicht totaal 1,83 kg
Afmeting - Breedte 29,7 cm
Afmeting - Diepte 19,6 cm
Afmeting - Hoogte/Dikte 3,54 cm
Passief gekoeld

Software

Besturingssysteem Microsoft Windows 11 Home
Besturingssysteem (serie) Windows
Windows versie 22H2
Windows OS Build 22.621,819
Aantal bits OS 64 bit

Fabrikantsopgave eigenschappen

Garantie 2 jaar

Productcodes

SKU 90NB0WX1-M00520
EAN 4711081889281
Toegevoegd aan Hardware Info maandag 28 november 2022

Testresultaten

Dit product is door Hardware Info getest op maandag 5 december 2022.

Geluidstest

Noise floor 14 dB(A)
Testconfiguratie
  • Geluidsdichte ruimte 2021
  • Larson Davis SoundAdvisor Model 831C
Afstand geluidsmeting 50 cm
Testconfiguratie
  • Geluidsdichte ruimte 2021
  • Larson Davis SoundAdvisor Model 831C
WebXPRT 3 - LAeq 12,9 dB
Testconfiguratie
  • Geluidsdichte ruimte 2021
  • Larson Davis SoundAdvisor Model 831C
PCMark 10 Express - LAeq 19,8 dB
Testconfiguratie
  • Geluidsdichte ruimte 2021
  • Larson Davis SoundAdvisor Model 831C
Blender - LAeq 37,4 dB
Testconfiguratie
  • Geluidsdichte ruimte 2021
  • Larson Davis SoundAdvisor Model 831C

PCMark 10 Storage

PCMark 10 - Gebruiken Adobe Photoshop Heavy 516
Testconfiguratie
  • Windows benchmarks
PCMark 10 - Storage - Totaalscore - Toegangstijd 98
Testconfiguratie
  • Windows benchmarks
PCMark 10 - Storage - Totaalscore - Bandbreedte 265,81
PCMark 10 - Storage - Totaalscore 1.686
Testconfiguratie
  • Windows benchmarks
PCMark 10 - 2.37GB_(399_JPEGs)_leestest 248
PCMark 10 - 2.37GB_(399_JPEGs)_kopieertest 376
Testconfiguratie
  • Windows benchmarks
PCMark 10 - 2.37GB_(399_JPEGs)_schrijftest 278
Testconfiguratie
  • Windows benchmarks
PCMark 10 - 2GB_(4_ISOs)_leestest 2.310
Testconfiguratie
  • Windows benchmarks
PCMark 10 - 2GB_(4_ISOs)_kopieertest 1.855
Testconfiguratie
  • Windows benchmarks
PCMark 10 - 2GB_(4_ISOs)_schrijftest 1.921
Testconfiguratie
  • Windows benchmarks
PCMark 10 - Gebruiken Microsoft PowerPoint 72
Testconfiguratie
  • Windows benchmarks
PCMark 10 - Gebruiken Microsoft Excel 99
Testconfiguratie
  • Windows benchmarks
PCMark 10 - Gebruiken Adobe Photoshop Light 177
Testconfiguratie
  • Windows benchmarks
PCMark 10 - Starten Windows 10 238
Testconfiguratie
  • Windows benchmarks
PCMark 10 - Gebruiken Adobe InDesign 97
Testconfiguratie
  • Windows benchmarks
PCMark 10 - Gebruiken Adobe Illustrator 128
PCMark 10 - Gebruiken Adobe After Effects 319
Testconfiguratie
  • Windows benchmarks
PCMark 10 - Starten Overwatch 223
Testconfiguratie
  • Windows benchmarks
PCMark 10 - Starten Call of Duty: Black Ops 4 533
Testconfiguratie
  • Windows benchmarks
PCMark 10 - Starten Battlefield V 529
Testconfiguratie
  • Windows benchmarks
PCMark 10 - Starten Adobe Photoshop 138
Testconfiguratie
  • Windows benchmarks
PCMark 10 - Starten Adobe Lightroom 103
Testconfiguratie
  • Windows benchmarks
PCMark 10 - Starten Adobe Premiere_Pro 173
Testconfiguratie
  • Windows benchmarks
PCMark 10 - Starten Adobe Illustrator 106
Testconfiguratie
  • Windows benchmarks
PCMark 10 - Starten Adobe After Effects 156
Testconfiguratie
  • Windows benchmarks
PCMark 10 - Starten Adobe Acrobat 162
Testconfiguratie
  • Windows benchmarks
PCMark 10 - Quick Storage - Totaalscore 1.649
Testconfiguratie
  • Windows benchmarks
PCMark 10 - Quick Storage - Totaalscore - Bandbreedte 199,78
Testconfiguratie
  • Windows benchmarks
PCMark 10 - Quick Storage - Totaalscore - Toegangstijd 77
Testconfiguratie
  • Windows benchmarks

Platform onafhankelijke tests

Opstarttijd 7,4 sec.
Testconfiguratie
  • Platform onafhankelijke tests
JetStream 2 101,362
Testconfiguratie
  • Platform onafhankelijke tests
webXPRT 3 338
Testconfiguratie
  • Platform onafhankelijke tests
webXPRT 3 - Photo Enhancement 233 ms
Testconfiguratie
  • Platform onafhankelijke tests
webXPRT 3 - Organize Album using AI 1.652 ms
Testconfiguratie
  • Platform onafhankelijke tests
webXPRT 3 - Stock Option Pricing 115 ms
Testconfiguratie
  • Platform onafhankelijke tests
webXPRT 3 - Encrypt Notes and OCR Scan 863 ms
Testconfiguratie
  • Platform onafhankelijke tests
webXPRT 3 - Sales Graphs 282 ms
Testconfiguratie
  • Platform onafhankelijke tests
webXPRT 3 - Online Homework 807 ms
Testconfiguratie
  • Platform onafhankelijke tests
Geekbench 5 - Multi 7.148
Testconfiguratie
  • Platform onafhankelijke tests
Geekbench 5 - Multi Crypto 8.633
Testconfiguratie
  • Platform onafhankelijke tests
Geekbench 5 - Multi Integer 6.816
Testconfiguratie
  • Platform onafhankelijke tests
Geekbench 5 - Multi Floating Point 7.619
Testconfiguratie
  • Platform onafhankelijke tests
Geekbench 5 - Single 1.688
Testconfiguratie
  • Platform onafhankelijke tests
Geekbench 5 - Single Crypto 3.923
Testconfiguratie
  • Platform onafhankelijke tests
Geekbench 5 - Single Integer 1.460
Testconfiguratie
  • Platform onafhankelijke tests
Geekbench 5 - Single Floating Point 1.808
Testconfiguratie
  • Platform onafhankelijke tests
Geekbench 5 - OpenCL 14.721
Testconfiguratie
  • Platform onafhankelijke tests
WiFi speedtest 2.4GHz receive 185 Mbit/s
Testconfiguratie
  • Platform onafhankelijke tests
WiFi speedtest 2.4GHz send 158 Mbit/s
Testconfiguratie
  • Platform onafhankelijke tests
WiFi speedtest 5.0GHz receive 554 Mbit/s
Testconfiguratie
  • Platform onafhankelijke tests
WiFi speedtest 5.0GHz send 665 Mbit/s
Testconfiguratie
  • Platform onafhankelijke tests

Windows benchmarks

3DMark - Fire Strike 3.505
Testconfiguratie
  • Windows benchmarks
3DMark - Fire Strike Graphics 3.601
Testconfiguratie
  • Windows benchmarks
3DMark - Fire Strike Physics 16.213
Testconfiguratie
  • Windows benchmarks
3DMark - Fire Strike Combined 1.476
Testconfiguratie
  • Windows benchmarks
3DMark - Time Spy 1.391
Testconfiguratie
  • Windows benchmarks
3DMark - Time Spy Graphics 1.251
Testconfiguratie
  • Windows benchmarks
3DMark - Time Spy CPU 3.806
Testconfiguratie
  • Windows benchmarks
3DMark - Night Raid 12.525
Testconfiguratie
  • Windows benchmarks
3DMark - Night Raid Graphics 15.688
Testconfiguratie
  • Windows benchmarks
3DMark - Night Raid CPU 5.847
Testconfiguratie
  • Windows benchmarks
Cinebench R15 - Single 220
Testconfiguratie
  • Windows benchmarks
Cinebench R15 - Multi 1.246
Testconfiguratie
  • Windows benchmarks
Cinebench R20 - Single 570
Testconfiguratie
  • Windows benchmarks
Cinebench R20 - Multi 2.830
Testconfiguratie
  • Windows benchmarks
Cinebench R23 - Single 1.501
Testconfiguratie
  • Windows benchmarks
Cinebench R23 - Multi 6.842
Testconfiguratie
  • Windows benchmarks
Blender duurtest run #1 34,86
Testconfiguratie
  • Windows benchmarks
Blender duurtest run #2 40,26
Testconfiguratie
  • Windows benchmarks
Blender duurtest run #3 45,69
Testconfiguratie
  • Windows benchmarks
Blender duurtest run #4 55,81
Testconfiguratie
  • Windows benchmarks
Blender duurtest run #5 57,58
Testconfiguratie
  • Windows benchmarks
Blender duurtest run #6 56,37
Testconfiguratie
  • Windows benchmarks
Blender duurtest run #7 56,06
Testconfiguratie
  • Windows benchmarks
Blender duurtest run #8 56,09
Testconfiguratie
  • Windows benchmarks
Blender duurtest run #9 55,55
Testconfiguratie
  • Windows benchmarks
Blender duurtest run #10 54,91
Testconfiguratie
  • Windows benchmarks
Blender duurtest run #11 55,25
Testconfiguratie
  • Windows benchmarks
Blender duurtest run #12 54,67
Testconfiguratie
  • Windows benchmarks
Blender duurtest run #13 54,84
Testconfiguratie
  • Windows benchmarks
Blender duurtest run #14 54,15
Testconfiguratie
  • Windows benchmarks
Blender duurtest run #15 54,7
Testconfiguratie
  • Windows benchmarks
Blender duurtest run #16 54,75
Testconfiguratie
  • Windows benchmarks
Blender duurtest run #17 54,12
Testconfiguratie
  • Windows benchmarks
Blender duurtest run #18 54,22
Testconfiguratie
  • Windows benchmarks
Blender duurtest run #19 54,22
Testconfiguratie
  • Windows benchmarks
Blender duurtest run #20 53,95
Testconfiguratie
  • Windows benchmarks
Blender duurtest run #21 54,17
Testconfiguratie
  • Windows benchmarks
Blender duurtest run #22 54,22
Testconfiguratie
  • Windows benchmarks
PCMark 10 Extended 4.510
Testconfiguratie
  • Windows benchmarks
PCMark 10 Essentials 9.481
Testconfiguratie
  • Windows benchmarks
PCMark 10 App Start-up 10.834
Testconfiguratie
  • Windows benchmarks
PCMark 10 Video Conferencing 8.362
Testconfiguratie
  • Windows benchmarks
PCMark 10 Web Browsing 9.409
Testconfiguratie
  • Windows benchmarks
PCMark 10 Productivity 7.438
Testconfiguratie
  • Windows benchmarks
PCMark 10 Spreadsheets 6.920
Testconfiguratie
  • Windows benchmarks
PCMark 10 Writing 7.995
Testconfiguratie
  • Windows benchmarks
PCMark 10 Digital Content Creation 4.776
Testconfiguratie
  • Windows benchmarks
PCMark 10 Photo Editing 8.674
Testconfiguratie
  • Windows benchmarks
PCMark 10 Rendering and Visualization 3.053
Testconfiguratie
  • Windows benchmarks
PCMark 10 Video Editing 4.114
Testconfiguratie
  • Windows benchmarks
PCMark 10 Gaming 3.322
Testconfiguratie
  • Windows benchmarks
PCMark 10 Graphics 4.177
Testconfiguratie
  • Windows benchmarks
PCMark 10 Physics 16.260
Testconfiguratie
  • Windows benchmarks
PCMark 10 Combined 1.608
Testconfiguratie
  • Windows benchmarks

Energieverbruik / Accu

Energieverbruik uit 0 W
Testconfiguratie
  • Windows benchmarks
Energieverbruik adapter (zonder laptop) 0,9 W
Testconfiguratie
  • Windows benchmarks
Energieverbruik idle 12,9 W
Testconfiguratie
  • Windows benchmarks
Browser accutest - 180 cd/m2 583 min.
Testconfiguratie
  • Windows benchmarks
PCMark 10 Accu Digital 2.381
Testconfiguratie
  • Windows benchmarks
PCMark 10 Accu Essentials 5.187
Testconfiguratie
  • Windows benchmarks
PCMark 10 Accu Productivity 3.365
Testconfiguratie
  • Windows benchmarks
PCMark 10 Accu Duration in Minuten 328
Testconfiguratie
  • Windows benchmarks
PCMark 10 Accu Aantal Runs 9
Testconfiguratie
  • Windows benchmarks

Testresultaten beeldscherm

Gemeten kleurruimte DCI-P3
Testconfiguratie
  • Beeldscherm test SpectraCal CALman 5.13
Kleurtemperatuur 7.124 K
Testconfiguratie
  • Beeldscherm test SpectraCal CALman 5.13
Helderheid wit 297 cd/m²
Testconfiguratie
  • Beeldscherm test SpectraCal CALman 5.13
Helderheid zwart 0,00 cd/m²
Testconfiguratie
  • Beeldscherm test SpectraCal CALman 5.13
Checkerboard wit 299,734 cd/m²
Testconfiguratie
  • Beeldscherm test SpectraCal CALman 5.13
Checkerboard zwart 0 cd/m²
Testconfiguratie
  • Beeldscherm test SpectraCal CALman 5.13
Gamma 2,15
Testconfiguratie
  • Beeldscherm test SpectraCal CALman 5.13
Gamma (afwijking van 2,2) 0,05
Testconfiguratie
  • Beeldscherm test SpectraCal CALman 5.13
Kleurafwijking 75% wit (Delta E 2000) 3,27 mΔuv
Testconfiguratie
  • Beeldscherm test SpectraCal CALman 5 i.c.m. X
  • Rite i1 Display Pro colorimeter
Kleurafwijking 75% rood (Delta E 2000) 0,47 mΔuv
Testconfiguratie
  • Beeldscherm test SpectraCal CALman 5 i.c.m. X
  • Rite i1 Display Pro colorimeter
Kleurafwijking 75% groen (Delta E 2000) 1,48 mΔuv
Testconfiguratie
  • Beeldscherm test SpectraCal CALman 5 i.c.m. X
  • Rite i1 Display Pro colorimeter
Kleurafwijking 75% blauw (Delta E 2000) 1,39 mΔuv
Testconfiguratie
  • Beeldscherm test SpectraCal CALman 5 i.c.m. X
  • Rite i1 Display Pro colorimeter
Kleurafwijking 75% cyaan (Delta E 2000) 1,8 mΔuv
Testconfiguratie
  • Beeldscherm test SpectraCal CALman 5 i.c.m. X
  • Rite i1 Display Pro colorimeter
Kleurafwijking 75% magenta (Delta E 2000) 0,98 mΔuv
Testconfiguratie
  • Beeldscherm test SpectraCal CALman 5 i.c.m. X
  • Rite i1 Display Pro colorimeter
Kleurafwijking 75% geel (Delta E 2000) 2,52 mΔuv
Testconfiguratie
  • Beeldscherm test SpectraCal CALman 5 i.c.m. X
  • Rite i1 Display Pro colorimeter
Gemiddelde kleurafwijking (Delta E 2000) 2,1 mΔuv
Testconfiguratie
  • Beeldscherm test SpectraCal CALman 5.13
Kleurafwijking 100% wit (Delta E 2000) 4,5 mΔuv
Testconfiguratie
  • Beeldscherm test SpectraCal CALman 5 i.c.m. X
  • Rite i1 Display Pro colorimeter
Gemiddelde kleurafwijking excl. wit (Delta E 2000) 1,4
Testconfiguratie
  • Beeldscherm test SpectraCal CALman 5 i.c.m. X
  • Rite i1 Display Pro colorimeter
Gemiddelde grijsafwijking (Delta E 2000) 3,3 mΔuv
Testconfiguratie
  • Beeldscherm test SpectraCal CALman 5.13
sRGB dekking 100 %
Testconfiguratie
  • Beeldscherm test SpectraCal CALman 5.13
DCI-P3 dekking 99,7 %
Testconfiguratie
  • Beeldscherm test SpectraCal CALman 5.13
Rec 2020 dekking 73,9 %
Testconfiguratie
  • Beeldscherm test SpectraCal CALman 5.13

Alternatieven

HP 17-cn1956nd (545C9EA)

  • Intel Core i5-1155G7
  • 16 GB
  • 17.3 inch
  • 1920x1080
  • Nvidia GeForce MX350
  • 1024 GB
  • Qwerty
  • 2.14 kg
  • Windows
 

HP 17-cn1959nd (668H9EA)

  • Intel Core i5-1155G7
  • 16 GB
  • 17.3 inch
  • 1920x1080
  • Intel Iris Xe Graphics G7 (Tiger Lake 80 EU)
  • 1024 GB
  • Qwerty
  • 2.09 kg
  • Windows
 

Asus VivoBook M3704YA-AU042W

  • AMD Ryzen 7 7730U
  • 16 GB
  • 17.3 inch
  • 1920x1080
  • AMD Radeon RX Vega 8
  • 1024 GB
  • Qwerty
  • 2.05 kg
  • Windows
 

Samsung Galaxy Book3 Pro 360 (NP960QFG-KA1NL)

  • Intel Core i7 1360P
  • 16 GB
  • 16 inch
  • 2880x1800
  • Touchscreen
  • Intel Iris Xe Graphics G7 (Tiger Lake 96 EU)
  • 1024 GB
  • Qwerty
  • 1.65 kg
  • Windows
 

Asus RoG Zephyrus Duo 16 GX650RX-LO080W

  • AMD Ryzen 9 6980HX
  • 32 GB
  • 16 inch
  • 2560x1600
  • Touchscreen
  • Nvidia GeForce RTX 3080 Max-P Design
  • 2048 GB
  • Qwerty
  • 2.60 kg
  • Windows
 

MSI Creator Z16 A11UET-067NL

  • Intel Core i9 11900H
  • 32 GB
  • 16 inch
  • 2560x1600
  • Touchscreen
  • Nvidia GeForce RTX 3060
  • 1000 GB
  • Qwerty
  • 2.2 kg
  • Windows Pro
 

Razer Blade Pro 17 (Early 2020)

  • Intel Core i7 10875H
  • 16 GB
  • 17.3 inch
  • 3840x2160
  • Touchscreen
  • Nvidia GeForce RTX 2080 Super Max-Q Design
  • 1024 GB
  • Qwerty
  • 2.94 kg
  • Windows
 

MSI GS75 9SE-263NL

  • Intel Core i7 9750H
  • 16 GB
  • 17.3 inch
  • 1920x1080
  • Nvidia GeForce RTX 2060
  • 1024 GB
  • Qwerty
  • 2.28 kg
  • Windows
 

HP Victus 16-e0548nd (488M1EA)

  • AMD Ryzen 7 5800H
  • 16 GB
  • 16.1 inch
  • 1920x1080
  • Nvidia GeForce RTX 3060
  • 1024 GB
  • Qwerty
  • 2.46 kg
  • Windows
 

MSI Prestige P75 9SE-474NL Creator

  • Intel Core i9 9880H
  • 16 GB
  • 17.3 inch
  • 1920x1080
  • Nvidia GeForce RTX 2060
  • 1024 GB
  • Qwerty
  • 2.26 kg
  • Windows Pro
 

MSI GS75 9SD-265NL

  • Intel Core i7 9750H
  • 16 GB
  • 17.3 inch
  • 1920x1080
  • Nvidia GeForce GTX 1660 Ti
  • 1024 GB
  • Qwerty
  • 2.28 kg
  • Windows
 

Lenovo Legion 5 Pro (82RF0009US)

  • Intel Core i7 12700H
  • 16 GB
  • 16 inch
  • 2560x1600
  • Nvidia GeForce RTX 3060
  • 2048 GB
  • Qwerty
  • 2.55 kg
  • Windows
 
0