Getest

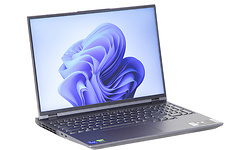
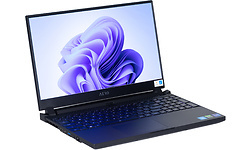
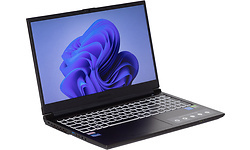
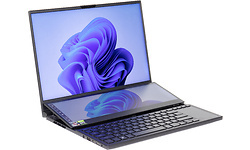
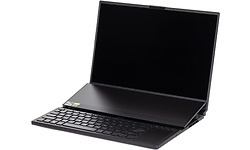
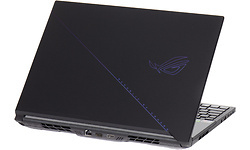
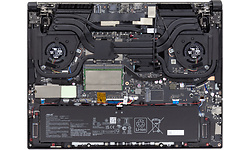
Asus RoG Zephyrus Duo 16 GX650RX-LO080W

Prijsverloop

Dit product is niet (meer) verkrijgbaar bij de bij Hardware Info aangesloten shops.

Specificaties

Belangrijkste specificaties

Processor type AMD Ryzen 9 6980HX
Geheugen capaciteit 32 GB
Scherm diagonaal 16 inch
Resolutie 2560x1600
Touchscreen
GPU type Nvidia GeForce RTX 3080 Max-P Design
Totale opslagcapaciteit 2.048 GB
Toetsenbordindeling Qwerty
Gewicht totaal 2,60 kg
Besturingssysteem (serie) Windows

Processor / Chipset / Geheugen

Processor serie AMD Ryzen 9
Processor type AMD Ryzen 9 6980HX
Processor klokfrequentie 3,3 GHz
Processor klokfrequentie (max. turbo) 5 GHz
Aantal processorcores 8
Geheugen capaciteit 32 GB
Type geheugen DDR5
Geheugen klokfrequentie 4.800 MHz
Geheugen form factor Sodimm
SODIMM sloten 2
Vrije SODIMM sloten 0
Werkgeheugen uitbreidbaar tot 64 GB

Scherm

Scherm diagonaal 16 inch
Resolutie 2560x1600
Verhouding 16:10
Pixeldichtheid 189 ppi
Scherm type (mat/glans) Mat
Paneeltype IPS
LED-achtergrondverlichting
Touchscreen
Maximale verversingsfrequentie 165 Hz

Graphics

GPU type Nvidia GeForce RTX 3080 Max-P Design
Geïntegreerde / losse GPU Losse chip
Videogeheugen 16 GB

Opslag

Totale opslagcapaciteit 2.048 GB
SSD opslagcapaciteit 2.048 GB
Beschikbaar opslaggeheugen 1.823,9 GB
Aantal harddisks / SSD's 1
Harddisk/SSD 1 capaciteit 2.048 GB
Harddisk/SSD 1 soort SSD/Flash
Harddisk/SSD 1 form factor M.2
Harddisk/SSD 1 merk/product Samsung MZVL22T0HBLB-00B00
DVD branden
Blu-ray lezen
Blu-ray branden

Connectiviteit / Netwerk

Netwerkaansluiting (bedraad)
Netwerkadapter (bedraad) Realtek Gaming 2.5GbE Family Controller
Netwerksnelheid (bedraad) 1000 Mbit/s
WiFi standaard 802.11ax (Wi-Fi 6E)
WiFi adapter MediaTek Wi-Fi 6E MT7922 160MHz Wireless LAN Card
Bluetooth
Bluetooth-versie Bluetooth 5.2
4G (LTE)
5G

Aansluitingen

Smartcard
USB 3.2 - 5 Gb/s (Type-A) 2
USB 3.2 - 5 Gb/s (Type-C) 2
Cardreader - SD
Cardreader - MicroSD
DVI-uitgang
VGA-uitgang
HDMI-uitgang
Aantal HDMI-uitgangen 1
Micro HDMI-uitgang
HDMI-versie 2.1
DisplayPort-uitgang
Mini DisplayPort-uitgang
Analoge audio aansluitingen 1
Aansluiting dockingstation
Kensingtonslot

Toetsenbord en touchpad

Toetsenbordindeling Qwerty
Numeriek toetsenbord
Toetsenbordverlichting helderheidsniveaus 3
Toetsenbordverlichting kleur RGB
Touchpad MS Precision compatible
Touchpad afzonderlijke muistoetsen

Camera

Webcam
Tweede camera
Flitser
Camera Windows Hello compatible
Webcamschuifje

Sensors

Accelerometer
Vingerafdruklezer
NFC

Overige hardware

Trusted Platform Module (TPM)
Geïntegreerde microfoon

Maten en gewichten

Accu capaciteit (Wh) 90 Wh
Verwisselbare accu
Gewicht totaal 2,60 kg
Afmeting - Breedte 35,5 cm
Afmeting - Diepte 26,6 cm
Afmeting - Hoogte/Dikte 3,34 cm
Passief gekoeld

Software

Besturingssysteem Microsoft Windows 11 Home
Besturingssysteem (serie) Windows
Windows versie 21H2
Windows OS Build 22.000,556
Aantal bits OS 64 bit

Productcodes

SKU GX650RX-LO080W
EAN 4711081531593
Toegevoegd aan Hardware Info maandag 14 februari 2022

Testresultaten

Dit product is door Hardware Info getest op vrijdag 8 april 2022.

Metro Exodus

Metro Exodus - 1920x1080 - Medium 140,5 fps
Testconfiguratie
  • Game benchmarks 2022
Metro Exodus - 1920x1080 - Medium (99p) 15,63 ms
Testconfiguratie
  • Game benchmarks 2022
Metro Exodus - 1920x1080 - Medium (99.9p) 22,95 ms
Testconfiguratie
  • Game benchmarks 2022
Metro Exodus - 1920x1080 - Ultra 95,9 fps
Testconfiguratie
  • Game benchmarks 2022
Metro Exodus - 1920x1080 - Ultra (99p) 20,27 ms
Testconfiguratie
  • Game benchmarks 2022
Metro Exodus - 1920x1080 - Ultra (99.9p) 26,42 ms
Testconfiguratie
  • Game benchmarks 2022
Metro Exodus - 2560x1440 - Medium 114,8 fps
Testconfiguratie
  • Game benchmarks 2022
Metro Exodus - 2560x1440 - Medium (99p) 17,31 ms
Testconfiguratie
  • Game benchmarks 2022
Metro Exodus - 2560x1440 - Medium (99.9p) 24,62 ms
Testconfiguratie
  • Game benchmarks 2022
Metro Exodus - 2560x1440 - Ultra 76,8 fps
Testconfiguratie
  • Game benchmarks 2022
Metro Exodus - 2560x1440 - Ultra (99p) 22,85 ms
Testconfiguratie
  • Game benchmarks 2022
Metro Exodus - 2560x1440 - Ultra (99.9p) 28,43 ms
Testconfiguratie
  • Game benchmarks 2022
Metro Exodus - 3840x2160 - Medium 69,6 fps
Testconfiguratie
  • Game benchmarks 2022
Metro Exodus - 3840x2160 - Medium (99p) 23,87 ms
Testconfiguratie
  • Game benchmarks 2022
Metro Exodus - 3840x2160 - Medium (99.9p) 28,29 ms
Testconfiguratie
  • Game benchmarks 2022
Metro Exodus - 3840x2160 - Ultra 48,7 fps
Testconfiguratie
  • Game benchmarks 2022
Metro Exodus - 3840x2160 - Ultra (99p) 32,79 ms
Testconfiguratie
  • Game benchmarks 2022
Metro Exodus - 3840x2160 - Ultra (99.9p) 40,88 ms
Testconfiguratie
  • Game benchmarks 2022
Metro Exodus - 1920x1080 - Ultra (DXR - High) 81,2 fps
Testconfiguratie
  • Game benchmarks 2022
Metro Exodus - 1920x1080 - Ultra (DXR - High) (99p) 22,19 ms
Testconfiguratie
  • Game benchmarks 2022
Metro Exodus - 1920x1080 - Ultra (DXR - High) (99.9p) 33,41 ms
Testconfiguratie
  • Game benchmarks 2022
Metro Exodus - 2560x1440 - Ultra (DXR - High) 60,5 fps
Testconfiguratie
  • Game benchmarks 2022
Metro Exodus - 2560x1440 - Ultra (DXR - High) (99p) 27,62 ms
Testconfiguratie
  • Game benchmarks 2022
Metro Exodus - 2560x1440 - Ultra (DXR - High) (99.9p) 37,58 ms
Testconfiguratie
  • Game benchmarks 2022

Total War: Troy

Total War: Troy - 1920x1080 - Medium 252,8 fps
Testconfiguratie
  • Game benchmarks 2022
Total War: Troy - 1920x1080 - Medium (99p) 5,46 ms
Testconfiguratie
  • Game benchmarks 2022
Total War: Troy - 1920x1080 - Medium (99.9p) 6,92 ms
Testconfiguratie
  • Game benchmarks 2022
Total War: Troy - 1920x1080 - Ultra 114,9 fps
Testconfiguratie
  • Game benchmarks 2022
Total War: Troy - 1920x1080 - Ultra (99p) 10,43 ms
Testconfiguratie
  • Game benchmarks 2022
Total War: Troy - 1920x1080 - Ultra (99.9p) 10,43 ms
Testconfiguratie
  • Game benchmarks 2022
Total War: Troy - 2560x1440 - Medium 250 fps
Testconfiguratie
  • Game benchmarks 2022
Total War: Troy - 2560x1440 - Medium (99p) 5,6 ms
Testconfiguratie
  • Game benchmarks 2022
Total War: Troy - 2560x1440 - Medium (99.9p) 6,72 ms
Testconfiguratie
  • Game benchmarks 2022
Total War: Troy - 2560x1440 - Ultra 197 fps
Testconfiguratie
  • Game benchmarks 2022
Total War: Troy - 2560x1440 - Ultra (99p) 6,23 ms
Testconfiguratie
  • Game benchmarks 2022
Total War: Troy - 2560x1440 - Ultra (99.9p) 7,38 ms
Testconfiguratie
  • Game benchmarks 2022
Total War: Troy - 3840x2160 - Medium 99 fps
Testconfiguratie
  • Game benchmarks 2022
Total War: Troy - 3840x2160 - Medium (99p) 13,38 ms
Testconfiguratie
  • Game benchmarks 2022
Total War: Troy - 3840x2160 - Medium (99.9p) 14,6 ms
Testconfiguratie
  • Game benchmarks 2022
Total War: Troy - 3840x2160 - Ultra 58,7 fps
Testconfiguratie
  • Game benchmarks 2022
Total War: Troy - 3840x2160 - Ultra (99p) 21,26 ms
Testconfiguratie
  • Game benchmarks 2022
Total War: Troy - 3840x2160 - Ultra (99.9p) 23,73 ms
Testconfiguratie
  • Game benchmarks 2022

Far Cry: New Dawn

Far Cry: New Dawn - 1920x1080 - Medium 111,2 fps
Testconfiguratie
  • Game benchmarks 2022
Far Cry: New Dawn - 1920x1080 - Medium (99p) 12,31 ms
Testconfiguratie
  • Game benchmarks 2022
Far Cry: New Dawn - 1920x1080 - Medium (99.9p) 15,26 ms
Testconfiguratie
  • Game benchmarks 2022
Far Cry: New Dawn - 1920x1080 - Ultra 97 fps
Testconfiguratie
  • Game benchmarks 2022
Far Cry: New Dawn - 1920x1080 - Ultra (99p) 14,88 ms
Testconfiguratie
  • Game benchmarks 2022
Far Cry: New Dawn - 1920x1080 - Ultra (99.9p) 16,3 ms
Testconfiguratie
  • Game benchmarks 2022
Far Cry: New Dawn - 2560x1440 - Medium 108 fps
Testconfiguratie
  • Game benchmarks 2022
Far Cry: New Dawn - 2560x1440 - Medium (99p) 12,16 ms
Testconfiguratie
  • Game benchmarks 2022
Far Cry: New Dawn - 2560x1440 - Medium (99.9p) 14,33 ms
Testconfiguratie
  • Game benchmarks 2022
Far Cry: New Dawn - 2560x1440 - Ultra 94,3 fps
Testconfiguratie
  • Game benchmarks 2022
Far Cry: New Dawn - 2560x1440 - Ultra (99p) 15 ms
Testconfiguratie
  • Game benchmarks 2022
Far Cry: New Dawn - 2560x1440 - Ultra (99.9p) 17,72 ms
Testconfiguratie
  • Game benchmarks 2022
Far Cry: New Dawn - 3840x2160 - Medium 85,5 fps
Testconfiguratie
  • Game benchmarks 2022
Far Cry: New Dawn - 3840x2160 - Medium (99p) 16,05 ms
Testconfiguratie
  • Game benchmarks 2022
Far Cry: New Dawn - 3840x2160 - Medium (99.9p) 28,93 ms
Testconfiguratie
  • Game benchmarks 2022
Far Cry: New Dawn - 3840x2160 - Ultra 73,6 fps
Testconfiguratie
  • Game benchmarks 2022
Far Cry: New Dawn - 3840x2160 - Ultra (99p) 17,31 ms
Testconfiguratie
  • Game benchmarks 2022
Far Cry: New Dawn - 3840x2160 - Ultra (99.9p) 19,95 ms
Testconfiguratie
  • Game benchmarks 2022

F1 2020

F1 2020 (DX12) - 1920x1080 - Medium 240,8 fps
Testconfiguratie
  • Game benchmarks 2022
F1 2020 (DX12) - 1920x1080 - Medium (99p) 5,9 ms
Testconfiguratie
  • Game benchmarks 2022
F1 2020 (DX12) - 1920x1080 - Medium (99.9p) 7 ms
Testconfiguratie
  • Game benchmarks 2022
F1 2020 (DX12) - 1920x1080 - Ultra 194,4 fps
Testconfiguratie
  • Game benchmarks 2022
F1 2020 (DX12) - 1920x1080 - Ultra (99p) 7,3 ms
Testconfiguratie
  • Game benchmarks 2022
F1 2020 (DX12) - 1920x1080 - Ultra (99.9p) 8,4 ms
Testconfiguratie
  • Game benchmarks 2022
F1 2020 (DX12) - 2560x1440 - Medium 235,6 fps
Testconfiguratie
  • Game benchmarks 2022
F1 2020 (DX12) - 2560x1440 - Medium (99p) 5,9 ms
Testconfiguratie
  • Game benchmarks 2022
F1 2020 (DX12) - 2560x1440 - Medium (99.9p) 8,1 ms
Testconfiguratie
  • Game benchmarks 2022
F1 2020 (DX12) - 2560x1440 - Ultra 176,4 fps
Testconfiguratie
  • Game benchmarks 2022
F1 2020 (DX12) - 2560x1440 - Ultra (99p) 7,8 ms
Testconfiguratie
  • Game benchmarks 2022
F1 2020 (DX12) - 2560x1440 - Ultra (99.9p) 10,2 ms
Testconfiguratie
  • Game benchmarks 2022
F1 2020 (DX12) - 3840x2160 - Medium 153,6 fps
Testconfiguratie
  • Game benchmarks 2022
F1 2020 (DX12) - 3840x2160 - Medium (99p) 7,7 ms
Testconfiguratie
  • Game benchmarks 2022
F1 2020 (DX12) - 3840x2160 - Medium (99.9p) 8,4 ms
Testconfiguratie
  • Game benchmarks 2022
F1 2020 (DX12) - 3840x2160 - Ultra 106 fps
Testconfiguratie
  • Game benchmarks 2022
F1 2020 (DX12) - 3840x2160 - Ultra (99p) 11,4 ms
Testconfiguratie
  • Game benchmarks 2022
F1 2020 (DX12) - 3840x2160 - Ultra (99.9p) 13,6 ms
Testconfiguratie
  • Game benchmarks 2022

Geluidstest

Noise floor 14 dB(A)
Testconfiguratie
  • Geluidsdichte ruimte 2021
  • Larson Davis SoundAdvisor Model 831C
Afstand geluidsmeting 50 cm
Testconfiguratie
  • Geluidsdichte ruimte 2021
  • Larson Davis SoundAdvisor Model 831C
WebXPRT 3 - LAeq 33,4 dB
Testconfiguratie
  • Geluidsdichte ruimte 2021
  • Larson Davis SoundAdvisor Model 831C
PCMark 10 Express - LAeq 39,4 dB
Testconfiguratie
  • Geluidsdichte ruimte 2021
  • Larson Davis SoundAdvisor Model 831C
Blender - LAeq 51,4 dB
Testconfiguratie
  • Geluidsdichte ruimte 2021
  • Larson Davis SoundAdvisor Model 831C
F1 2020 - LAeq 52,2 dB
Testconfiguratie
  • Geluidsdichte ruimte 2021
  • Larson Davis SoundAdvisor Model 831C

PCMark 10 Storage

PCMark 10 - Gebruiken Adobe Photoshop Heavy 888
Testconfiguratie
  • Windows benchmarks
PCMark 10 - Storage - Totaalscore - Toegangstijd 58
Testconfiguratie
  • Windows benchmarks
PCMark 10 - Storage - Totaalscore - Bandbreedte 442,58
PCMark 10 - Storage - Totaalscore 2.828
Testconfiguratie
  • Windows benchmarks
PCMark 10 - 2.37GB_(399_JPEGs)_leestest 535
PCMark 10 - 2.37GB_(399_JPEGs)_kopieertest 773
Testconfiguratie
  • Windows benchmarks
PCMark 10 - 2.37GB_(399_JPEGs)_schrijftest 497
Testconfiguratie
  • Windows benchmarks
PCMark 10 - 2GB_(4_ISOs)_leestest 4.019
Testconfiguratie
  • Windows benchmarks
PCMark 10 - 2GB_(4_ISOs)_kopieertest 3.357
Testconfiguratie
  • Windows benchmarks
PCMark 10 - 2GB_(4_ISOs)_schrijftest 3.104
Testconfiguratie
  • Windows benchmarks
PCMark 10 - Gebruiken Microsoft PowerPoint 121
Testconfiguratie
  • Windows benchmarks
PCMark 10 - Gebruiken Microsoft Excel 158
Testconfiguratie
  • Windows benchmarks
PCMark 10 - Gebruiken Adobe Photoshop Light 269
Testconfiguratie
  • Windows benchmarks
PCMark 10 - Starten Windows 10 392
Testconfiguratie
  • Windows benchmarks
PCMark 10 - Gebruiken Adobe InDesign 202
Testconfiguratie
  • Windows benchmarks
PCMark 10 - Gebruiken Adobe Illustrator 228
PCMark 10 - Gebruiken Adobe After Effects 472
Testconfiguratie
  • Windows benchmarks
PCMark 10 - Starten Overwatch 368
Testconfiguratie
  • Windows benchmarks
PCMark 10 - Starten Call of Duty: Black Ops 4 875
Testconfiguratie
  • Windows benchmarks
PCMark 10 - Starten Battlefield V 840
Testconfiguratie
  • Windows benchmarks
PCMark 10 - Starten Adobe Photoshop 208
Testconfiguratie
  • Windows benchmarks
PCMark 10 - Starten Adobe Lightroom 150
Testconfiguratie
  • Windows benchmarks
PCMark 10 - Starten Adobe Premiere_Pro 270
Testconfiguratie
  • Windows benchmarks
PCMark 10 - Starten Adobe Illustrator 162
Testconfiguratie
  • Windows benchmarks
PCMark 10 - Starten Adobe After Effects 230
Testconfiguratie
  • Windows benchmarks
PCMark 10 - Starten Adobe Acrobat 245
Testconfiguratie
  • Windows benchmarks
PCMark 10 - Quick Storage - Totaalscore 2.894
Testconfiguratie
  • Windows benchmarks
PCMark 10 - Quick Storage - Totaalscore - Bandbreedte 351,48
Testconfiguratie
  • Windows benchmarks
PCMark 10 - Quick Storage - Totaalscore - Toegangstijd 44
Testconfiguratie
  • Windows benchmarks

Platform onafhankelijke tests

Opstarttijd 24 sec.
Testconfiguratie
  • Platform onafhankelijke tests
JetStream 2 234,309
Testconfiguratie
  • Platform onafhankelijke tests
webXPRT 3 328
Testconfiguratie
  • Platform onafhankelijke tests
webXPRT 3 - Photo Enhancement 216 ms
Testconfiguratie
  • Platform onafhankelijke tests
webXPRT 3 - Organize Album using AI 1.633 ms
Testconfiguratie
  • Platform onafhankelijke tests
webXPRT 3 - Stock Option Pricing 98 ms
Testconfiguratie
  • Platform onafhankelijke tests
webXPRT 3 - Encrypt Notes and OCR Scan 1.432 ms
Testconfiguratie
  • Platform onafhankelijke tests
webXPRT 3 - Sales Graphs 261 ms
Testconfiguratie
  • Platform onafhankelijke tests
webXPRT 3 - Online Homework 788 ms
Testconfiguratie
  • Platform onafhankelijke tests
Geekbench 5 - Multi 10.306
Testconfiguratie
  • Platform onafhankelijke tests
Geekbench 5 - Multi Crypto 8.149
Testconfiguratie
  • Platform onafhankelijke tests
Geekbench 5 - Multi Integer 9.882
Testconfiguratie
  • Platform onafhankelijke tests
Geekbench 5 - Multi Floating Point 11.585
Testconfiguratie
  • Platform onafhankelijke tests
Geekbench 5 - Single 1.640
Testconfiguratie
  • Platform onafhankelijke tests
Geekbench 5 - Single Crypto 3.840
Testconfiguratie
  • Platform onafhankelijke tests
Geekbench 5 - Single Integer 1.384
Testconfiguratie
  • Platform onafhankelijke tests
Geekbench 5 - Single Floating Point 1.827
Testconfiguratie
  • Platform onafhankelijke tests
Geekbench 5 - OpenCL 107.989
Testconfiguratie
  • Platform onafhankelijke tests

Windows benchmarks

3DMark - Fire Strike 12.202
Testconfiguratie
  • Windows benchmarks
3DMark - Fire Strike Graphics 13.319
Testconfiguratie
  • Windows benchmarks
3DMark - Fire Strike Physics 26.798
Testconfiguratie
  • Windows benchmarks
3DMark - Fire Strike Combined 4.990
Testconfiguratie
  • Windows benchmarks
3DMark - Fire Strike Extreme 6.226
Testconfiguratie
  • Windows benchmarks
3DMark - Time Spy 4.803
Testconfiguratie
  • Windows benchmarks
3DMark - Time Spy Graphics 4.372
Testconfiguratie
  • Windows benchmarks
3DMark - Time Spy CPU 10.903
Testconfiguratie
  • Windows benchmarks
3DMark - Night Raid 48.060
Testconfiguratie
  • Windows benchmarks
3DMark - Night Raid Graphics 79.749
Testconfiguratie
  • Windows benchmarks
3DMark - Night Raid CPU 14.780
Testconfiguratie
  • Windows benchmarks
Cinebench R15 - Single 258
Testconfiguratie
  • Windows benchmarks
Cinebench R15 - Multi 2.342
Testconfiguratie
  • Windows benchmarks
Cinebench R20 - Single 603
Testconfiguratie
  • Windows benchmarks
Cinebench R20 - Multi 5.321
Testconfiguratie
  • Windows benchmarks
Cinebench R23 - Single 1.533
Testconfiguratie
  • Windows benchmarks
Cinebench R23 - Multi 13.726
Testconfiguratie
  • Windows benchmarks
Blender duurtest run #1 19,07
Testconfiguratie
  • Windows benchmarks
Blender duurtest run #2 19,11
Testconfiguratie
  • Windows benchmarks
Blender duurtest run #3 19,13
Testconfiguratie
  • Windows benchmarks
Blender duurtest run #4 19,16
Testconfiguratie
  • Windows benchmarks
Blender duurtest run #5 19,26
Testconfiguratie
  • Windows benchmarks
Blender duurtest run #6 19,23
Testconfiguratie
  • Windows benchmarks
Blender duurtest run #7 19,13
Testconfiguratie
  • Windows benchmarks
Blender duurtest run #8 19,07
Testconfiguratie
  • Windows benchmarks
Blender duurtest run #9 19,07
Testconfiguratie
  • Windows benchmarks
Blender duurtest run #10 19,11
Testconfiguratie
  • Windows benchmarks
Blender duurtest run #11 19,14
Testconfiguratie
  • Windows benchmarks
Blender duurtest run #12 19,07
Testconfiguratie
  • Windows benchmarks
Blender duurtest run #13 19,14
Testconfiguratie
  • Windows benchmarks
Blender duurtest run #14 19,14
Testconfiguratie
  • Windows benchmarks
Blender duurtest run #15 19,16
Testconfiguratie
  • Windows benchmarks
Blender duurtest run #16 19,14
Testconfiguratie
  • Windows benchmarks
Blender duurtest run #17 19,08
Testconfiguratie
  • Windows benchmarks
Blender duurtest run #18 19,17
Testconfiguratie
  • Windows benchmarks
Blender duurtest run #19 19,12
Testconfiguratie
  • Windows benchmarks
Blender duurtest run #20 19,09
Testconfiguratie
  • Windows benchmarks
Blender duurtest run #21 19,11
Testconfiguratie
  • Windows benchmarks
Blender duurtest run #22 19,1
Testconfiguratie
  • Windows benchmarks
Blender duurtest run #23 19,11
Testconfiguratie
  • Windows benchmarks
Blender duurtest run #24 19,12
Testconfiguratie
  • Windows benchmarks
Blender duurtest run #25 19,13
Testconfiguratie
  • Windows benchmarks
Blender duurtest run #26 19,1
Testconfiguratie
  • Windows benchmarks
Blender duurtest run #27 19,1
Testconfiguratie
  • Windows benchmarks
Blender duurtest run #28 19,1
Testconfiguratie
  • Windows benchmarks
Blender duurtest run #29 19,16
Testconfiguratie
  • Windows benchmarks
Blender duurtest run #30 19,18
Testconfiguratie
  • Windows benchmarks
Blender duurtest run #31 19,08
Testconfiguratie
  • Windows benchmarks
Blender duurtest run #32 19,09
Testconfiguratie
  • Windows benchmarks
Blender duurtest run #33 19,12
Testconfiguratie
  • Windows benchmarks
Blender duurtest run #34 19,16
Testconfiguratie
  • Windows benchmarks
Blender duurtest run #35 19,14
Testconfiguratie
  • Windows benchmarks
Blender duurtest run #36 19,14
Testconfiguratie
  • Windows benchmarks
Blender duurtest run #37 19,14
Testconfiguratie
  • Windows benchmarks
Blender duurtest run #38 19,12
Testconfiguratie
  • Windows benchmarks
Blender duurtest run #39 19,15
Testconfiguratie
  • Windows benchmarks
Blender duurtest run #40 19,14
Testconfiguratie
  • Windows benchmarks
Blender duurtest run #41 19,13
Testconfiguratie
  • Windows benchmarks
Blender duurtest run #42 19,14
Testconfiguratie
  • Windows benchmarks
Blender duurtest run #43 19,16
Testconfiguratie
  • Windows benchmarks
Blender duurtest run #44 19,17
Testconfiguratie
  • Windows benchmarks
Blender duurtest run #45 19,07
Testconfiguratie
  • Windows benchmarks
Blender duurtest run #46 19,11
Testconfiguratie
  • Windows benchmarks
Blender duurtest run #47 19,11
Testconfiguratie
  • Windows benchmarks
Blender duurtest run #48 19,22
Testconfiguratie
  • Windows benchmarks
Blender duurtest run #49 19,51
Testconfiguratie
  • Windows benchmarks
Blender duurtest run #50 19,13
Testconfiguratie
  • Windows benchmarks
PCMark 10 Extended 7.970
Testconfiguratie
  • Windows benchmarks
PCMark 10 Essentials 10.701
Testconfiguratie
  • Windows benchmarks
PCMark 10 App Start-up 16.618
Testconfiguratie
  • Windows benchmarks
PCMark 10 Video Conferencing 7.884
Testconfiguratie
  • Windows benchmarks
PCMark 10 Web Browsing 9.355
Testconfiguratie
  • Windows benchmarks
PCMark 10 Productivity 10.292
Testconfiguratie
  • Windows benchmarks
PCMark 10 Spreadsheets 12.661
Testconfiguratie
  • Windows benchmarks
PCMark 10 Writing 8.367
Testconfiguratie
  • Windows benchmarks
PCMark 10 Digital Content Creation 9.611
Testconfiguratie
  • Windows benchmarks
PCMark 10 Photo Editing 14.368
Testconfiguratie
  • Windows benchmarks
PCMark 10 Rendering and Visualization 12.025
Testconfiguratie
  • Windows benchmarks
PCMark 10 Video Editing 5.139
Testconfiguratie
  • Windows benchmarks
PCMark 10 Gaming 10.300
Testconfiguratie
  • Windows benchmarks
PCMark 10 Graphics 13.520
Testconfiguratie
  • Windows benchmarks
PCMark 10 Physics 25.214
Testconfiguratie
  • Windows benchmarks
PCMark 10 Combined 5.118
Testconfiguratie
  • Windows benchmarks

Energieverbruik / Accu

Energieverbruik uit 1 W
Testconfiguratie
  • Windows benchmarks
Energieverbruik adapter (zonder laptop) 0 W
Testconfiguratie
  • Windows benchmarks
Energieverbruik idle 32,2 W
Testconfiguratie
  • Windows benchmarks
Browser accutest - 180 cd/m2 230 min.
Testconfiguratie
  • Windows benchmarks
PCMark 10 Accu Digital 3.720
Testconfiguratie
  • Windows benchmarks
PCMark 10 Accu Essentials 5.735
Testconfiguratie
  • Windows benchmarks
PCMark 10 Accu Productivity 5.165
Testconfiguratie
  • Windows benchmarks
PCMark 10 Accu Duration in Minuten 111
Testconfiguratie
  • Windows benchmarks
PCMark 10 Accu Aantal Runs 4
Testconfiguratie
  • Windows benchmarks

Testresultaten beeldscherm

Gemeten kleurruimte sRGB
Testconfiguratie
  • Beeldscherm test SpectraCal CALman 5.13
Kleurtemperatuur 7.270 K
Testconfiguratie
  • Beeldscherm test SpectraCal CALman 5.13
Helderheid wit 846 cd/m²
Testconfiguratie
  • Beeldscherm test SpectraCal CALman 5.13
Helderheid zwart 0,10 cd/m²
Testconfiguratie
  • Beeldscherm test SpectraCal CALman 5.13
Contrast 8.457,0 : 1
Testconfiguratie
  • Beeldscherm test SpectraCal CALman 5.13
Checkerboard wit 487,706 cd/m²
Testconfiguratie
  • Beeldscherm test SpectraCal CALman 5.13
Checkerboard zwart 0,297 cd/m²
Testconfiguratie
  • Beeldscherm test SpectraCal CALman 5.13
Checkerboard contrast 1.642 : 1
Testconfiguratie
  • Beeldscherm test SpectraCal CALman 5.13
Gamma 2,50
Testconfiguratie
  • Beeldscherm test SpectraCal CALman 5.13
Gamma (afwijking van 2,2) 0,30
Testconfiguratie
  • Beeldscherm test SpectraCal CALman 5.13
Kleurafwijking rood (Delta E 1994) 4,61
Testconfiguratie
  • Beeldscherm test SpectraCal CALman 5 i.c.m. X
  • Rite i1 Display Pro colorimeter
Kleurafwijking groen (Delta E 1994) 1,09
Testconfiguratie
  • Beeldscherm test SpectraCal CALman 5 i.c.m. X
  • Rite i1 Display Pro colorimeter
Kleurafwijking blauw (Delta E 1994) 5,40
Testconfiguratie
  • Beeldscherm test SpectraCal CALman 5 i.c.m. X
  • Rite i1 Display Pro colorimeter
Kleurafwijking cyaan (Delta E 1994) 2,06
Testconfiguratie
  • Beeldscherm test SpectraCal CALman 5 i.c.m. X
  • Rite i1 Display Pro colorimeter
Kleurafwijking magenta (Delta E 1994) 5,24
Testconfiguratie
  • Beeldscherm test SpectraCal CALman 5 i.c.m. X
  • Rite i1 Display Pro colorimeter
Kleurafwijking geel (Delta E 1994) 3,13
Testconfiguratie
  • Beeldscherm test SpectraCal CALman 5 i.c.m. X
  • Rite i1 Display Pro colorimeter
Gemiddelde kleurafwijking (Delta E 1994) 3,6
Testconfiguratie
  • Beeldscherm test SpectraCal CALman 5 i.c.m. X
  • Rite i1 Display Pro colorimeter
Gemiddelde grijsafwijking (Delta E 1994) 5,7
Testconfiguratie
  • Beeldscherm test SpectraCal CALman 5 i.c.m. X
  • Rite i1 Display Pro colorimeter
Kleurafwijking 75% wit (Delta E 2000) 5,73 mΔuv
Testconfiguratie
  • Beeldscherm test SpectraCal CALman 5 i.c.m. X
  • Rite i1 Display Pro colorimeter
Kleurafwijking 75% rood (Delta E 2000) 4,34 mΔuv
Testconfiguratie
  • Beeldscherm test SpectraCal CALman 5 i.c.m. X
  • Rite i1 Display Pro colorimeter
Kleurafwijking 75% groen (Delta E 2000) 0,93 mΔuv
Testconfiguratie
  • Beeldscherm test SpectraCal CALman 5 i.c.m. X
  • Rite i1 Display Pro colorimeter
Kleurafwijking 75% blauw (Delta E 2000) 4,73 mΔuv
Testconfiguratie
  • Beeldscherm test SpectraCal CALman 5 i.c.m. X
  • Rite i1 Display Pro colorimeter
Kleurafwijking 75% cyaan (Delta E 2000) 2,04 mΔuv
Testconfiguratie
  • Beeldscherm test SpectraCal CALman 5 i.c.m. X
  • Rite i1 Display Pro colorimeter
Kleurafwijking 75% magenta (Delta E 2000) 4,8 mΔuv
Testconfiguratie
  • Beeldscherm test SpectraCal CALman 5 i.c.m. X
  • Rite i1 Display Pro colorimeter
Kleurafwijking 75% geel (Delta E 2000) 3,47 mΔuv
Testconfiguratie
  • Beeldscherm test SpectraCal CALman 5 i.c.m. X
  • Rite i1 Display Pro colorimeter
Gemiddelde kleurafwijking (Delta E 2000) 4,2 mΔuv
Testconfiguratie
  • Beeldscherm test SpectraCal CALman 5.13
Kleurafwijking 100% wit (Delta E 2000) 7,54 mΔuv
Testconfiguratie
  • Beeldscherm test SpectraCal CALman 5 i.c.m. X
  • Rite i1 Display Pro colorimeter
Gemiddelde kleurafwijking excl. wit (Delta E 2000) 3,4
Testconfiguratie
  • Beeldscherm test SpectraCal CALman 5 i.c.m. X
  • Rite i1 Display Pro colorimeter
Gemiddelde grijsafwijking (Delta E 2000) 5,7 mΔuv
Testconfiguratie
  • Beeldscherm test SpectraCal CALman 5.13
sRGB dekking 93,3 %
Testconfiguratie
  • Beeldscherm test SpectraCal CALman 5.13
DCI-P3 dekking 69,2 %
Testconfiguratie
  • Beeldscherm test SpectraCal CALman 5.13
Rec 2020 dekking 49,9 %
Testconfiguratie
  • Beeldscherm test SpectraCal CALman 5.13

Alternatieven

Lenovo Legion 5 Pro (82RF0009US)

  • Intel Core i7 12700H
  • 16 GB
  • 16 inch
  • 2560x1600
  • Nvidia GeForce RTX 3060
  • 2048 GB
  • Qwerty
  • 2.55 kg
  • Windows
 

HP Omen 16-b1890nd (6G8B0EA)

  • Intel Core i7 12700H
  • 16 GB
  • 16.1 inch
  • 2560x1440
  • Nvidia GeForce RTX 3070
  • 1024 GB
  • Qwerty
  • 2.285 kg
  • Windows
 

HP Pavilion Gaming 15-ec2747nd (4P6K4EA)

  • AMD Ryzen 5 5600H
  • 16 GB
  • 15.6 inch
  • 1920x1080
  • Nvidia GeForce RTX 3050
  • 512 GB
  • Qwerty
  • 2.09 kg
  • Windows
 

Asus VivoBook Pro 14X N7400PC-KM010W

  • Intel Core i7 11370H
  • 16 GB
  • 14 inch
  • 2880x1800
  • Nvidia GeForce RTX 3050
  • 1024 GB
  • Qwerty
  • 1.50 kg
  • Windows
 

Asus RoG Zephyrus G14 GA402RK-L8032X

  • AMD Ryzen 9 6900HS
  • 32 GB
  • 14 inch
  • 2560x1600
  • AMD Radeon RX 6800S
  • 1024 GB
  • Qwerty
  • 1.7 kg
 

MSI Stealth GS77 12UHS-032NL

  • Intel Core i9 12900H
  • 64 GB
  • 17.3 inch
  • 3840x2160
  • Nvidia GeForce RTX 3080 Ti
  • 2048 GB
  • Qwerty
  • 2.91 kg
  • Windows Pro
 

Alienware x17 P48E002

  • Intel Core i7 12700H
  • 32 GB
  • 17.3 inch
  • 1920x1080
  • Nvidia GeForce RTX 3080 Max-Q Design
  • 1024 GB
  • Qwerty
  • 3.05 kg
  • Windows
 

Asus Asus RoG Strix Scar G733C

  • Intel Core i9 12950HX
  • 32 GB
  • 17.3 inch
  • Nvidia GeForce RTX 3080 Ti
  • 4096 GB
  • Qwerty
  • Windows
 

Asus TUF Gaming A15 FA507NV-LP066W

  • AMD Ryzen 7 7735HS
  • 16 GB
  • 15.6 inch
  • 1920x1080
  • Nvidia GeForce RTX 4060 Laptop GPU
  • 512 GB
  • Qwerty
  • 2.1 kg
  • Windows
 

HP Victus 16-s0976nd

  • AMD Ryzen 7 7840HS
  • 16 GB
  • 16.1 inch
  • 1920x1080
  • Nvidia GeForce RTX 4070 Laptop GPU
  • 512 GB
  • Qwerty
  • 2.36 kg
  • Windows
 

Gigabyte Aero 5 KE4-72EE614SH

  • Intel Core i7 12700H
  • 16 GB
  • 15.6 inch
  • 3840x2160
  • Nvidia GeForce RTX 3060
  • 1024 GB
  • Qwerty
  • 2.28 kg
  • Windows
 

Medion Erazer Crawler E30 MD62472 (30034264)

  • Intel Core i5 12500H
  • 8 GB
  • 15.6 inch
  • 1920x1080
  • Nvidia GeForce RTX 3050 Laptop GPU
  • 512 GB
  • Qwerty
  • 2.02 kg
  • Windows
 
0