Getest

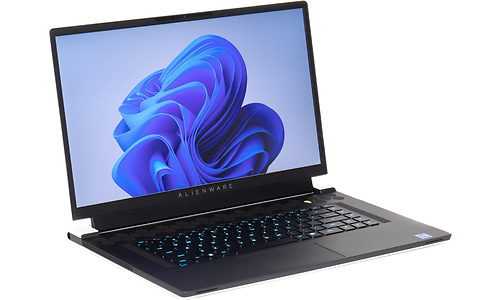
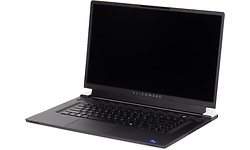
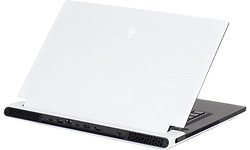
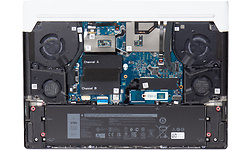
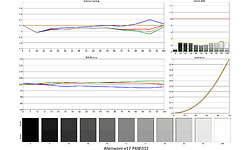
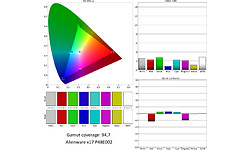
Alienware x17 P48E002

Specificaties

Belangrijkste specificaties

Processor type Intel Core i7 12700H
Geheugen capaciteit 32 GB
Scherm diagonaal 17,3 inch
Resolutie 1920x1080
Touchscreen
GPU type Nvidia GeForce RTX 3080 Max-Q Design
Totale opslagcapaciteit 1.024 GB
Toetsenbordindeling Qwerty
Gewicht totaal 3,05 kg
Besturingssysteem (serie) Windows

Processor / Chipset / Geheugen

Processor serie Intel Core i7
Processor type Intel Core i7 12700H
Processor klokfrequentie 2,7 GHz
Processor klokfrequentie (max. turbo) 4,7 GHz
Aantal processorcores 14
Geheugen capaciteit 32 GB
Type geheugen DDR5
Geheugen klokfrequentie 4.800 MHz
Geheugen form factor Sodimm
SODIMM sloten 2
Vrije SODIMM sloten 0
Werkgeheugen uitbreidbaar tot 64 GB

Scherm

Scherm diagonaal 17,3 inch
Resolutie 1920x1080
Verhouding 16:9
Pixeldichtheid 127 ppi
Scherm type (mat/glans) Mat
Paneeltype IPS
Touchscreen
Maximale verversingsfrequentie 360 Hz

Graphics

GPU type Nvidia GeForce RTX 3080 Max-Q Design
Geïntegreerde / losse GPU Losse chip
Videogeheugen 16 GB

Opslag

Totale opslagcapaciteit 1.024 GB
SSD opslagcapaciteit 1.024 GB
Beschikbaar opslaggeheugen 786,9 GB
Aantal harddisks / SSD's 1
Harddisk/SSD 1 capaciteit 1.024 GB
Harddisk/SSD 1 soort SSD/Flash
Harddisk/SSD 1 form factor M.2
Harddisk/SSD 1 merk/product KXG70ZNV1T02 KIOXIA 1024GB
DVD branden
Blu-ray lezen
Blu-ray branden

Connectiviteit / Netwerk

Netwerkaansluiting (bedraad)
Netwerkadapter (bedraad) Killer E3100G 2.5 Gigabit Ethernet Controller
Netwerksnelheid (bedraad) 2500 Mbit/s
WiFi standaard 802.11ax (Wi-Fi 6E)
WiFi adapter Killer Wi-Fi 6 AX1675x 160Mhz
Bluetooth
Bluetooth-versie Bluetooth 5.2
4G (LTE)
5G

Aansluitingen

Smartcard
USB 3.2 - 5 Gb/s (Type-A) 2
USB 3.2 - 5 Gb/s (Type-C) 1
Thunderbolt 4 (Type-C) 1
Cardreader - SD
Cardreader - MicroSD
DVI-uitgang
VGA-uitgang
HDMI-uitgang
Aantal HDMI-uitgangen 1
Micro HDMI-uitgang
HDMI-versie 2.1
DisplayPort-uitgang
Mini DisplayPort-uitgang
Aantal mini DisplayPort-uitgangen 1
DisplayPort-versie 1.4
Analoge audio aansluitingen 1
Aansluiting dockingstation
Kensingtonslot

Toetsenbord en touchpad

Toetsenbordindeling Qwerty
Numeriek toetsenbord
Toetsenbordverlichting helderheidsniveaus 2
Toetsenbordverlichting kleur RGB
Touchpad MS Precision compatible
Touchpad afzonderlijke muistoetsen

Camera

Webcam
Webcam resolutie 0,9 MPixel
Tweede camera
Flitser
Camera Windows Hello compatible
Webcamschuifje

Sensors

Accelerometer
Vingerafdruklezer
NFC

Overige hardware

Geïntegreerde microfoon

Maten en gewichten

Accu capaciteit (mAh) 87 mAh
Accu capaciteit (Wh) 330 Wh
Verwisselbare accu
Gewicht totaal 3,05 kg
Afmeting - Breedte 39,9 cm
Afmeting - Diepte 29,1 cm
Afmeting - Hoogte/Dikte 2,6 cm
Passief gekoeld

Software

Besturingssysteem Microsoft Windows 11 Home
Besturingssysteem (serie) Windows
Windows versie 21H2
Windows OS Build 22.000,556
Aantal bits OS 64 bit

Productcodes

SKU 2VJQ7M3
Toegevoegd aan Hardware Info dinsdag 15 maart 2022

Testresultaten

Dit product is door Hardware Info getest op vrijdag 8 april 2022.

Metro Exodus

Metro Exodus - 1920x1080 - Medium 140,9 fps
Testconfiguratie
  • Game benchmarks 2022
Metro Exodus - 1920x1080 - Medium (99p) 15,42 ms
Testconfiguratie
  • Game benchmarks 2022
Metro Exodus - 1920x1080 - Medium (99.9p) 19,04 ms
Testconfiguratie
  • Game benchmarks 2022
Metro Exodus - 1920x1080 - Ultra 87,2 fps
Testconfiguratie
  • Game benchmarks 2022
Metro Exodus - 1920x1080 - Ultra (99p) 21,81 ms
Testconfiguratie
  • Game benchmarks 2022
Metro Exodus - 1920x1080 - Ultra (99.9p) 60,75 ms
Testconfiguratie
  • Game benchmarks 2022
Metro Exodus - 2560x1440 - Medium 104,6 fps
Testconfiguratie
  • Game benchmarks 2022
Metro Exodus - 2560x1440 - Medium (99p) 18,09 ms
Testconfiguratie
  • Game benchmarks 2022
Metro Exodus - 2560x1440 - Medium (99.9p) 54,34 ms
Testconfiguratie
  • Game benchmarks 2022
Metro Exodus - 2560x1440 - Ultra 68,5 fps
Testconfiguratie
  • Game benchmarks 2022
Metro Exodus - 2560x1440 - Ultra (99p) 25,99 ms
Testconfiguratie
  • Game benchmarks 2022
Metro Exodus - 2560x1440 - Ultra (99.9p) 59,92 ms
Testconfiguratie
  • Game benchmarks 2022
Metro Exodus - 3840x2160 - Medium 43 fps
Testconfiguratie
  • Game benchmarks 2022
Metro Exodus - 3840x2160 - Medium (99p) 37,28 ms
Testconfiguratie
  • Game benchmarks 2022
Metro Exodus - 3840x2160 - Medium (99.9p) 42,63 ms
Testconfiguratie
  • Game benchmarks 2022
Metro Exodus - 3840x2160 - Ultra 30 fps
Testconfiguratie
  • Game benchmarks 2022
Metro Exodus - 3840x2160 - Ultra (99p) 35,43 ms
Testconfiguratie
  • Game benchmarks 2022
Metro Exodus - 3840x2160 - Ultra (99.9p) 37,15 ms
Testconfiguratie
  • Game benchmarks 2022
Metro Exodus - 1920x1080 - Ultra (DXR - High) 72,1 fps
Testconfiguratie
  • Game benchmarks 2022
Metro Exodus - 1920x1080 - Ultra (DXR - High) (99p) 23,69 ms
Testconfiguratie
  • Game benchmarks 2022
Metro Exodus - 1920x1080 - Ultra (DXR - High) (99.9p) 28,22 ms
Testconfiguratie
  • Game benchmarks 2022
Metro Exodus - 2560x1440 - Ultra (DXR - High) 75,1 fps
Testconfiguratie
  • Game benchmarks 2022
Metro Exodus - 2560x1440 - Ultra (DXR - High) (99p) 23,33 ms
Testconfiguratie
  • Game benchmarks 2022
Metro Exodus - 2560x1440 - Ultra (DXR - High) (99.9p) 30,65 ms
Testconfiguratie
  • Game benchmarks 2022

Total War: Troy

Total War: Troy - 1920x1080 - Medium 251,6 fps
Testconfiguratie
  • Game benchmarks 2022
Total War: Troy - 1920x1080 - Medium (99p) 4,85 ms
Testconfiguratie
  • Game benchmarks 2022
Total War: Troy - 1920x1080 - Medium (99.9p) 6 ms
Testconfiguratie
  • Game benchmarks 2022
Total War: Troy - 1920x1080 - Ultra 122,7 fps
Testconfiguratie
  • Game benchmarks 2022
Total War: Troy - 1920x1080 - Ultra (99p) 10,82 ms
Testconfiguratie
  • Game benchmarks 2022
Total War: Troy - 1920x1080 - Ultra (99.9p) 15,44 ms
Testconfiguratie
  • Game benchmarks 2022
Total War: Troy - 2560x1440 - Medium 184,1 fps
Testconfiguratie
  • Game benchmarks 2022
Total War: Troy - 2560x1440 - Medium (99p) 6,48 ms
Testconfiguratie
  • Game benchmarks 2022
Total War: Troy - 2560x1440 - Medium (99.9p) 7,32 ms
Testconfiguratie
  • Game benchmarks 2022
Total War: Troy - 2560x1440 - Ultra 92,6 fps
Testconfiguratie
  • Game benchmarks 2022
Total War: Troy - 2560x1440 - Ultra (99p) 13,71 ms
Testconfiguratie
  • Game benchmarks 2022
Total War: Troy - 2560x1440 - Ultra (99.9p) 18,46 ms
Testconfiguratie
  • Game benchmarks 2022
Total War: Troy - 3840x2160 - Medium 103,1 fps
Testconfiguratie
  • Game benchmarks 2022
Total War: Troy - 3840x2160 - Medium (99p) 11,32 ms
Testconfiguratie
  • Game benchmarks 2022
Total War: Troy - 3840x2160 - Medium (99.9p) 12,22 ms
Testconfiguratie
  • Game benchmarks 2022
Total War: Troy - 3840x2160 - Ultra 53,6 fps
Testconfiguratie
  • Game benchmarks 2022
Total War: Troy - 3840x2160 - Ultra (99p) 23,4 ms
Testconfiguratie
  • Game benchmarks 2022
Total War: Troy - 3840x2160 - Ultra (99.9p) 30,14 ms
Testconfiguratie
  • Game benchmarks 2022

Far Cry: New Dawn

Far Cry: New Dawn - 1920x1080 - Medium 139,1 fps
Testconfiguratie
  • Game benchmarks 2022
Far Cry: New Dawn - 1920x1080 - Medium (99p) 9,57 ms
Testconfiguratie
  • Game benchmarks 2022
Far Cry: New Dawn - 1920x1080 - Medium (99.9p) 11,34 ms
Testconfiguratie
  • Game benchmarks 2022
Far Cry: New Dawn - 1920x1080 - Ultra 122 fps
Testconfiguratie
  • Game benchmarks 2022
Far Cry: New Dawn - 1920x1080 - Ultra (99p) 11,61 ms
Testconfiguratie
  • Game benchmarks 2022
Far Cry: New Dawn - 1920x1080 - Ultra (99.9p) 13,84 ms
Testconfiguratie
  • Game benchmarks 2022
Far Cry: New Dawn - 2560x1440 - Medium 127,7 fps
Testconfiguratie
  • Game benchmarks 2022
Far Cry: New Dawn - 2560x1440 - Medium (99p) 10,13 ms
Testconfiguratie
  • Game benchmarks 2022
Far Cry: New Dawn - 2560x1440 - Medium (99.9p) 11,71 ms
Testconfiguratie
  • Game benchmarks 2022
Far Cry: New Dawn - 2560x1440 - Ultra 108,4 fps
Testconfiguratie
  • Game benchmarks 2022
Far Cry: New Dawn - 2560x1440 - Ultra (99p) 12,29 ms
Testconfiguratie
  • Game benchmarks 2022
Far Cry: New Dawn - 2560x1440 - Ultra (99.9p) 14,16 ms
Testconfiguratie
  • Game benchmarks 2022
Far Cry: New Dawn - 3840x2160 - Medium 79,2 fps
Testconfiguratie
  • Game benchmarks 2022
Far Cry: New Dawn - 3840x2160 - Medium (99p) 15,99 ms
Testconfiguratie
  • Game benchmarks 2022
Far Cry: New Dawn - 3840x2160 - Medium (99.9p) 16,97 ms
Testconfiguratie
  • Game benchmarks 2022
Far Cry: New Dawn - 3840x2160 - Ultra 66,6 fps
Testconfiguratie
  • Game benchmarks 2022
Far Cry: New Dawn - 3840x2160 - Ultra (99p) 19,1 ms
Testconfiguratie
  • Game benchmarks 2022
Far Cry: New Dawn - 3840x2160 - Ultra (99.9p) 26,37 ms
Testconfiguratie
  • Game benchmarks 2022

F1 2020

F1 2020 (DX12) - 1920x1080 - Medium 269,3 fps
Testconfiguratie
  • Game benchmarks 2022
F1 2020 (DX12) - 1920x1080 - Medium (99p) 5,3 ms
Testconfiguratie
  • Game benchmarks 2022
F1 2020 (DX12) - 1920x1080 - Medium (99.9p) 6,7 ms
Testconfiguratie
  • Game benchmarks 2022
F1 2020 (DX12) - 1920x1080 - Ultra 206,6 fps
Testconfiguratie
  • Game benchmarks 2022
F1 2020 (DX12) - 1920x1080 - Ultra (99p) 6,8 ms
Testconfiguratie
  • Game benchmarks 2022
F1 2020 (DX12) - 1920x1080 - Ultra (99.9p) 8,7 ms
Testconfiguratie
  • Game benchmarks 2022
F1 2020 (DX12) - 2560x1440 - Medium 228,4 fps
Testconfiguratie
  • Game benchmarks 2022
F1 2020 (DX12) - 2560x1440 - Medium (99p) 5,6 ms
Testconfiguratie
  • Game benchmarks 2022
F1 2020 (DX12) - 2560x1440 - Medium (99.9p) 6,7 ms
Testconfiguratie
  • Game benchmarks 2022
F1 2020 (DX12) - 2560x1440 - Ultra 160,5 fps
Testconfiguratie
  • Game benchmarks 2022
F1 2020 (DX12) - 2560x1440 - Ultra (99p) 8,2 ms
Testconfiguratie
  • Game benchmarks 2022
F1 2020 (DX12) - 2560x1440 - Ultra (99.9p) 10,4 ms
Testconfiguratie
  • Game benchmarks 2022
F1 2020 (DX12) - 3840x2160 - Medium 137,5 fps
Testconfiguratie
  • Game benchmarks 2022
F1 2020 (DX12) - 3840x2160 - Medium (99p) 8,6 ms
Testconfiguratie
  • Game benchmarks 2022
F1 2020 (DX12) - 3840x2160 - Medium (99.9p) 10,9 ms
Testconfiguratie
  • Game benchmarks 2022
F1 2020 (DX12) - 3840x2160 - Ultra 94,2 fps
Testconfiguratie
  • Game benchmarks 2022
F1 2020 (DX12) - 3840x2160 - Ultra (99p) 13,5 ms
Testconfiguratie
  • Game benchmarks 2022
F1 2020 (DX12) - 3840x2160 - Ultra (99.9p) 18,7 ms
Testconfiguratie
  • Game benchmarks 2022

Geluidstest

Noise floor 14 dB(A)
Testconfiguratie
  • Geluidsdichte ruimte 2021
  • Larson Davis SoundAdvisor Model 831C
Afstand geluidsmeting 50 cm
Testconfiguratie
  • Geluidsdichte ruimte 2021
  • Larson Davis SoundAdvisor Model 831C
WebXPRT 3 - LAeq 19,2 dB
Testconfiguratie
  • Geluidsdichte ruimte 2021
  • Larson Davis SoundAdvisor Model 831C
PCMark 10 Express - LAeq 27,2 dB
Testconfiguratie
  • Geluidsdichte ruimte 2021
  • Larson Davis SoundAdvisor Model 831C
Blender - LAeq 41,9 dB
Testconfiguratie
  • Geluidsdichte ruimte 2021
  • Larson Davis SoundAdvisor Model 831C
F1 2020 - LAeq 43,2 dB
Testconfiguratie
  • Geluidsdichte ruimte 2021
  • Larson Davis SoundAdvisor Model 831C

PCMark 10 Storage

PCMark 10 - Gebruiken Adobe Photoshop Heavy 695
Testconfiguratie
  • Windows benchmarks
PCMark 10 - Storage - Totaalscore - Toegangstijd 70
Testconfiguratie
  • Windows benchmarks
PCMark 10 - Storage - Totaalscore - Bandbreedte 380,61
PCMark 10 - Storage - Totaalscore 2.387
Testconfiguratie
  • Windows benchmarks
PCMark 10 - 2.37GB_(399_JPEGs)_leestest 645
PCMark 10 - 2.37GB_(399_JPEGs)_kopieertest 825
Testconfiguratie
  • Windows benchmarks
PCMark 10 - 2.37GB_(399_JPEGs)_schrijftest 532
Testconfiguratie
  • Windows benchmarks
PCMark 10 - 2GB_(4_ISOs)_leestest 2.594
Testconfiguratie
  • Windows benchmarks
PCMark 10 - 2GB_(4_ISOs)_kopieertest 1.861
Testconfiguratie
  • Windows benchmarks
PCMark 10 - 2GB_(4_ISOs)_schrijftest 2.121
Testconfiguratie
  • Windows benchmarks
PCMark 10 - Gebruiken Microsoft PowerPoint 152
Testconfiguratie
  • Windows benchmarks
PCMark 10 - Gebruiken Microsoft Excel 146
Testconfiguratie
  • Windows benchmarks
PCMark 10 - Gebruiken Adobe Photoshop Light 237
Testconfiguratie
  • Windows benchmarks
PCMark 10 - Starten Windows 10 349
Testconfiguratie
  • Windows benchmarks
PCMark 10 - Gebruiken Adobe InDesign 210
Testconfiguratie
  • Windows benchmarks
PCMark 10 - Gebruiken Adobe Illustrator 231
PCMark 10 - Gebruiken Adobe After Effects 399
Testconfiguratie
  • Windows benchmarks
PCMark 10 - Starten Overwatch 317
Testconfiguratie
  • Windows benchmarks
PCMark 10 - Starten Call of Duty: Black Ops 4 471
Testconfiguratie
  • Windows benchmarks
PCMark 10 - Starten Battlefield V 530
Testconfiguratie
  • Windows benchmarks
PCMark 10 - Starten Adobe Photoshop 178
Testconfiguratie
  • Windows benchmarks
PCMark 10 - Starten Adobe Lightroom 148
Testconfiguratie
  • Windows benchmarks
PCMark 10 - Starten Adobe Premiere_Pro 217
Testconfiguratie
  • Windows benchmarks
PCMark 10 - Starten Adobe Illustrator 179
Testconfiguratie
  • Windows benchmarks
PCMark 10 - Starten Adobe After Effects 189
Testconfiguratie
  • Windows benchmarks
PCMark 10 - Starten Adobe Acrobat 196
Testconfiguratie
  • Windows benchmarks
PCMark 10 - Quick Storage - Totaalscore 3.045
Testconfiguratie
  • Windows benchmarks
PCMark 10 - Quick Storage - Totaalscore - Bandbreedte 371,46
Testconfiguratie
  • Windows benchmarks
PCMark 10 - Quick Storage - Totaalscore - Toegangstijd 42
Testconfiguratie
  • Windows benchmarks

Platform onafhankelijke tests

Opstarttijd 14 sec.
Testconfiguratie
  • Platform onafhankelijke tests
JetStream 2 244,736
Testconfiguratie
  • Platform onafhankelijke tests
webXPRT 3 348
Testconfiguratie
  • Platform onafhankelijke tests
webXPRT 3 - Photo Enhancement 202 ms
Testconfiguratie
  • Platform onafhankelijke tests
webXPRT 3 - Organize Album using AI 1.544 ms
Testconfiguratie
  • Platform onafhankelijke tests
webXPRT 3 - Stock Option Pricing 90 ms
Testconfiguratie
  • Platform onafhankelijke tests
webXPRT 3 - Encrypt Notes and OCR Scan 1.453 ms
Testconfiguratie
  • Platform onafhankelijke tests
webXPRT 3 - Sales Graphs 261 ms
Testconfiguratie
  • Platform onafhankelijke tests
webXPRT 3 - Online Homework 675 ms
Testconfiguratie
  • Platform onafhankelijke tests
Geekbench 5 - Multi 13.185
Testconfiguratie
  • Platform onafhankelijke tests
Geekbench 5 - Multi Crypto 9.266
Testconfiguratie
  • Platform onafhankelijke tests
Geekbench 5 - Multi Integer 12.925
Testconfiguratie
  • Platform onafhankelijke tests
Geekbench 5 - Multi Floating Point 14.400
Testconfiguratie
  • Platform onafhankelijke tests
Geekbench 5 - Single 1.731
Testconfiguratie
  • Platform onafhankelijke tests
Geekbench 5 - Single Crypto 3.684
Testconfiguratie
  • Platform onafhankelijke tests
Geekbench 5 - Single Integer 1.530
Testconfiguratie
  • Platform onafhankelijke tests
Geekbench 5 - Single Floating Point 1.840
Testconfiguratie
  • Platform onafhankelijke tests
Geekbench 5 - OpenCL 147.255
Testconfiguratie
  • Platform onafhankelijke tests
WiFi speedtest 2.4GHz receive 213 Mbit/s
Testconfiguratie
  • Platform onafhankelijke tests
WiFi speedtest 2.4GHz send 183 Mbit/s
Testconfiguratie
  • Platform onafhankelijke tests
WiFi speedtest 5.0GHz receive 613 Mbit/s
Testconfiguratie
  • Platform onafhankelijke tests
WiFi speedtest 5.0GHz send 656 Mbit/s
Testconfiguratie
  • Platform onafhankelijke tests

Windows benchmarks

3DMark - Fire Strike 26.558
Testconfiguratie
  • Windows benchmarks
3DMark - Fire Strike Graphics 30.069
Testconfiguratie
  • Windows benchmarks
3DMark - Fire Strike Physics 30.129
Testconfiguratie
  • Windows benchmarks
3DMark - Fire Strike Combined 12.933
Testconfiguratie
  • Windows benchmarks
3DMark - Fire Strike Extreme 14.437
Testconfiguratie
  • Windows benchmarks
3DMark - Time Spy 12.106
Testconfiguratie
  • Windows benchmarks
3DMark - Time Spy Graphics 11.859
Testconfiguratie
  • Windows benchmarks
3DMark - Time Spy CPU 13.728
Testconfiguratie
  • Windows benchmarks
3DMark - Night Raid 57.629
Testconfiguratie
  • Windows benchmarks
3DMark - Night Raid Graphics 120.256
Testconfiguratie
  • Windows benchmarks
3DMark - Night Raid CPU 14.586
Testconfiguratie
  • Windows benchmarks
Cinebench R15 - Single 257
Testconfiguratie
  • Windows benchmarks
Cinebench R15 - Multi 2.865
Testconfiguratie
  • Windows benchmarks
Cinebench R20 - Single 679
Testconfiguratie
  • Windows benchmarks
Cinebench R20 - Multi 6.925
Testconfiguratie
  • Windows benchmarks
Cinebench R23 - Single 1.771
Testconfiguratie
  • Windows benchmarks
Cinebench R23 - Multi 18.816
Testconfiguratie
  • Windows benchmarks
Blender duurtest run #1 14,96
Testconfiguratie
  • Windows benchmarks
Blender duurtest run #2 15,33
Testconfiguratie
  • Windows benchmarks
Blender duurtest run #3 15,3
Testconfiguratie
  • Windows benchmarks
Blender duurtest run #4 15,43
Testconfiguratie
  • Windows benchmarks
Blender duurtest run #5 15,3
Testconfiguratie
  • Windows benchmarks
Blender duurtest run #6 15,35
Testconfiguratie
  • Windows benchmarks
Blender duurtest run #7 15,53
Testconfiguratie
  • Windows benchmarks
Blender duurtest run #8 15,32
Testconfiguratie
  • Windows benchmarks
Blender duurtest run #9 15,36
Testconfiguratie
  • Windows benchmarks
Blender duurtest run #10 15,39
Testconfiguratie
  • Windows benchmarks
Blender duurtest run #11 15,51
Testconfiguratie
  • Windows benchmarks
Blender duurtest run #12 15,43
Testconfiguratie
  • Windows benchmarks
Blender duurtest run #13 15,44
Testconfiguratie
  • Windows benchmarks
Blender duurtest run #14 15,43
Testconfiguratie
  • Windows benchmarks
PCMark 10 Extended 9.817
Testconfiguratie
  • Windows benchmarks
PCMark 10 Essentials 10.527
Testconfiguratie
  • Windows benchmarks
PCMark 10 App Start-up 14.436
Testconfiguratie
  • Windows benchmarks
PCMark 10 Video Conferencing 7.860
Testconfiguratie
  • Windows benchmarks
PCMark 10 Web Browsing 10.282
Testconfiguratie
  • Windows benchmarks
PCMark 10 Productivity 9.568
Testconfiguratie
  • Windows benchmarks
PCMark 10 Spreadsheets 11.905
Testconfiguratie
  • Windows benchmarks
PCMark 10 Writing 7.691
Testconfiguratie
  • Windows benchmarks
PCMark 10 Digital Content Creation 11.656
Testconfiguratie
  • Windows benchmarks
PCMark 10 Photo Editing 15.435
Testconfiguratie
  • Windows benchmarks
PCMark 10 Rendering and Visualization 14.861
Testconfiguratie
  • Windows benchmarks
PCMark 10 Video Editing 6.904
Testconfiguratie
  • Windows benchmarks
PCMark 10 Gaming 21.385
Testconfiguratie
  • Windows benchmarks
PCMark 10 Graphics 29.180
Testconfiguratie
  • Windows benchmarks
PCMark 10 Physics 28.408
Testconfiguratie
  • Windows benchmarks
PCMark 10 Combined 12.476
Testconfiguratie
  • Windows benchmarks

Energieverbruik / Accu

Energieverbruik uit 1,7 W
Testconfiguratie
  • Windows benchmarks
Energieverbruik adapter (zonder laptop) 0 W
Testconfiguratie
  • Windows benchmarks
Energieverbruik idle 42,2 W
Testconfiguratie
  • Windows benchmarks
Browser accutest - 180 cd/m2 286 min.
Testconfiguratie
  • Windows benchmarks
PCMark 10 Accu Digital 3.152
Testconfiguratie
  • Windows benchmarks
PCMark 10 Accu Essentials 4.740
Testconfiguratie
  • Windows benchmarks
PCMark 10 Accu Productivity 4.282
Testconfiguratie
  • Windows benchmarks
PCMark 10 Accu Duration in Minuten 72
Testconfiguratie
  • Windows benchmarks
PCMark 10 Accu Aantal Runs 3
Testconfiguratie
  • Windows benchmarks

Testresultaten beeldscherm

Gemeten kleurruimte sRGB
Testconfiguratie
  • Beeldscherm test SpectraCal CALman 5.13
Kleurtemperatuur 6.422 K
Testconfiguratie
  • Beeldscherm test SpectraCal CALman 5.13
Helderheid wit 350 cd/m²
Testconfiguratie
  • Beeldscherm test SpectraCal CALman 5.13
Helderheid zwart 0,31 cd/m²
Testconfiguratie
  • Beeldscherm test SpectraCal CALman 5.13
Contrast 1.128,9 : 1
Testconfiguratie
  • Beeldscherm test SpectraCal CALman 5.13
Checkerboard wit 348,996 cd/m²
Testconfiguratie
  • Beeldscherm test SpectraCal CALman 5.13
Checkerboard zwart 0,322 cd/m²
Testconfiguratie
  • Beeldscherm test SpectraCal CALman 5.13
Checkerboard contrast 1.084 : 1
Testconfiguratie
  • Beeldscherm test SpectraCal CALman 5.13
Gamma 2,05
Testconfiguratie
  • Beeldscherm test SpectraCal CALman 5.13
Gamma (afwijking van 2,2) 0,15
Testconfiguratie
  • Beeldscherm test SpectraCal CALman 5.13
Kleurafwijking rood (Delta E 1994) 2,48
Testconfiguratie
  • Beeldscherm test SpectraCal CALman 5 i.c.m. X
  • Rite i1 Display Pro colorimeter
Kleurafwijking groen (Delta E 1994) 3,31
Testconfiguratie
  • Beeldscherm test SpectraCal CALman 5 i.c.m. X
  • Rite i1 Display Pro colorimeter
Kleurafwijking blauw (Delta E 1994) 0,67
Testconfiguratie
  • Beeldscherm test SpectraCal CALman 5 i.c.m. X
  • Rite i1 Display Pro colorimeter
Kleurafwijking cyaan (Delta E 1994) 2,20
Testconfiguratie
  • Beeldscherm test SpectraCal CALman 5 i.c.m. X
  • Rite i1 Display Pro colorimeter
Kleurafwijking magenta (Delta E 1994) 2,21
Testconfiguratie
  • Beeldscherm test SpectraCal CALman 5 i.c.m. X
  • Rite i1 Display Pro colorimeter
Kleurafwijking geel (Delta E 1994) 1,15
Testconfiguratie
  • Beeldscherm test SpectraCal CALman 5 i.c.m. X
  • Rite i1 Display Pro colorimeter
Gemiddelde kleurafwijking (Delta E 1994) 2,0
Testconfiguratie
  • Beeldscherm test SpectraCal CALman 5 i.c.m. X
  • Rite i1 Display Pro colorimeter
Gemiddelde grijsafwijking (Delta E 1994) 2,8
Testconfiguratie
  • Beeldscherm test SpectraCal CALman 5 i.c.m. X
  • Rite i1 Display Pro colorimeter
Kleurafwijking 75% wit (Delta E 2000) 2,55 mΔuv
Testconfiguratie
  • Beeldscherm test SpectraCal CALman 5 i.c.m. X
  • Rite i1 Display Pro colorimeter
Kleurafwijking 75% rood (Delta E 2000) 2,27 mΔuv
Testconfiguratie
  • Beeldscherm test SpectraCal CALman 5 i.c.m. X
  • Rite i1 Display Pro colorimeter
Kleurafwijking 75% groen (Delta E 2000) 2,76 mΔuv
Testconfiguratie
  • Beeldscherm test SpectraCal CALman 5 i.c.m. X
  • Rite i1 Display Pro colorimeter
Kleurafwijking 75% blauw (Delta E 2000) 0,81 mΔuv
Testconfiguratie
  • Beeldscherm test SpectraCal CALman 5 i.c.m. X
  • Rite i1 Display Pro colorimeter
Kleurafwijking 75% cyaan (Delta E 2000) 2,23 mΔuv
Testconfiguratie
  • Beeldscherm test SpectraCal CALman 5 i.c.m. X
  • Rite i1 Display Pro colorimeter
Kleurafwijking 75% magenta (Delta E 2000) 2,1 mΔuv
Testconfiguratie
  • Beeldscherm test SpectraCal CALman 5 i.c.m. X
  • Rite i1 Display Pro colorimeter
Kleurafwijking 75% geel (Delta E 2000) 1,14 mΔuv
Testconfiguratie
  • Beeldscherm test SpectraCal CALman 5 i.c.m. X
  • Rite i1 Display Pro colorimeter
Gemiddelde kleurafwijking (Delta E 2000) 2,1 mΔuv
Testconfiguratie
  • Beeldscherm test SpectraCal CALman 5.13
Kleurafwijking 100% wit (Delta E 2000) 2,87 mΔuv
Testconfiguratie
  • Beeldscherm test SpectraCal CALman 5 i.c.m. X
  • Rite i1 Display Pro colorimeter
Gemiddelde kleurafwijking excl. wit (Delta E 2000) 1,9
Testconfiguratie
  • Beeldscherm test SpectraCal CALman 5 i.c.m. X
  • Rite i1 Display Pro colorimeter
Gemiddelde grijsafwijking (Delta E 2000) 2,6 mΔuv
Testconfiguratie
  • Beeldscherm test SpectraCal CALman 5.13
Reactietijd 0%-100% 2,9 ms
Testconfiguratie
  • Beeldscherm test SpectraCal CALman 5.13
Reactietijd 100%-0% 2,6 ms
Testconfiguratie
  • Beeldscherm test SpectraCal CALman 5.13
Reactietijd 20%-80% 4,4 ms
Testconfiguratie
  • Beeldscherm test SpectraCal CALman 5.13
Reactietijd 80%-20% 3,7 ms
Testconfiguratie
  • Beeldscherm test SpectraCal CALman 5.13
sRGB dekking 94,7 %
Testconfiguratie
  • Beeldscherm test SpectraCal CALman 5.13
DCI-P3 dekking 72,2 %
Testconfiguratie
  • Beeldscherm test SpectraCal CALman 5.13
Rec 2020 dekking 51,8 %
Testconfiguratie
  • Beeldscherm test SpectraCal CALman 5.13

Alternatieven

Asus Asus RoG Strix Scar G733C

  • Intel Core i9 12950HX
  • 32 GB
  • 17.3 inch
  • Nvidia GeForce RTX 3080 Ti
  • 4096 GB
  • Qwerty
  • Windows
 

HP Pavilion Gaming 15-ec2747nd (4P6K4EA)

  • AMD Ryzen 5 5600H
  • 16 GB
  • 15.6 inch
  • 1920x1080
  • Nvidia GeForce RTX 3050
  • 512 GB
  • Qwerty
  • 2.09 kg
  • Windows
 

Asus RoG Zephyrus G14 GA402RK-L8032X

  • AMD Ryzen 9 6900HS
  • 32 GB
  • 14 inch
  • 2560x1600
  • AMD Radeon RX 6800S
  • 1024 GB
  • Qwerty
  • 1.7 kg
 

MSI Stealth GS77 12UHS-032NL

  • Intel Core i9 12900H
  • 64 GB
  • 17.3 inch
  • 3840x2160
  • Nvidia GeForce RTX 3080 Ti
  • 2048 GB
  • Qwerty
  • 2.91 kg
  • Windows Pro
 

Lenovo Legion 5 Pro (82RF0009US)

  • Intel Core i7 12700H
  • 16 GB
  • 16 inch
  • 2560x1600
  • Nvidia GeForce RTX 3060
  • 2048 GB
  • Qwerty
  • 2.55 kg
  • Windows
 

Medion Erazer Deputy P50 MD62519 (30035305)

  • Intel Core i7 13700HX
  • 16 GB
  • 15.6 inch
  • 2560x1440
  • Nvidia GeForce RTX 4060
  • 1024 GB
  • Azerty
  • 2 kg
  • Windows
 

Asus TUF Gaming A15 FA507NV-LP066W

  • AMD Ryzen 7 7735HS
  • 16 GB
  • 15.6 inch
  • 1920x1080
  • Nvidia GeForce RTX 4060 Laptop GPU
  • 512 GB
  • Qwerty
  • 2.1 kg
  • Windows
 

Asus VivoBook Pro 14X N7400PC-KM010W

  • Intel Core i7 11370H
  • 16 GB
  • 14 inch
  • 2880x1800
  • Nvidia GeForce RTX 3050
  • 1024 GB
  • Qwerty
  • 1.50 kg
  • Windows
 

Asus RoG Zephyrus Duo 16 GX650RX-LO080W

  • AMD Ryzen 9 6980HX
  • 32 GB
  • 16 inch
  • 2560x1600
  • Touchscreen
  • Nvidia GeForce RTX 3080 Max-P Design
  • 2048 GB
  • Qwerty
  • 2.60 kg
  • Windows
 

Samsung Galaxy Book3 Ultra (NP960XFH-XA1NL)

  • Intel Core i7 13700H
  • 16 GB
  • 16 inch
  • 2880x1800
  • Nvidia GeForce RTX 4050
  • 1024 GB
  • Qwerty
  • 1.81 kg
  • Windows
 

HP Victus 16-s0976nd

  • AMD Ryzen 7 7840HS
  • 16 GB
  • 16.1 inch
  • 1920x1080
  • Nvidia GeForce RTX 4070 Laptop GPU
  • 512 GB
  • Qwerty
  • 2.36 kg
  • Windows
 

Asus VivoBook 16X K3605VC-N1068W

  • Intel Core i9 13900H
  • 16 GB
  • 16 inch
  • 1920x1200
  • Nvidia GeForce RTX 3050 Laptop GPU
  • 512 GB
  • Qwerty
  • 1.94 kg
  • Windows
 
0