Getest

Asus RoG Zephyrus G14 GA402RK-L8032X

Specificaties

Belangrijkste specificaties

Processor type AMD Ryzen 9 6900HS
Geheugen capaciteit 32 GB
Scherm diagonaal 14 inch
Resolutie 2560x1600
Touchscreen
GPU type AMD Radeon RX 6800S
Totale opslagcapaciteit 1.024 GB
Toetsenbordindeling Qwerty
Gewicht totaal 1,70 kg

Processor / Chipset / Geheugen

Processor serie AMD Ryzen 9
Processor type AMD Ryzen 9 6900HS
Processor klokfrequentie 3,3 GHz
Processor klokfrequentie (max. turbo) 4,9 GHz
Aantal processorcores 8
Geheugen capaciteit 32 GB
Type geheugen LPDDR5
Geheugen klokfrequentie 4.800 MHz
Geheugen form factor On-board + Sodimm
SODIMM sloten 1
Vrije SODIMM sloten 0

Scherm

Scherm diagonaal 14 inch
Resolutie 2560x1600
Verhouding 16:10
Pixeldichtheid 216 ppi
Scherm type (mat/glans) Mat
Paneeltype IPS
Touchscreen

Graphics

GPU type AMD Radeon RX 6800S
Geïntegreerde / losse GPU Losse chip
Videogeheugen 8 GB

Opslag

Totale opslagcapaciteit 1.024 GB
SSD opslagcapaciteit 1.024 GB
Beschikbaar opslaggeheugen 876,3 GB
Aantal harddisks / SSD's 1
Harddisk/SSD 1 capaciteit 1.024 GB
Harddisk/SSD 1 soort SSD/Flash
Harddisk/SSD 1 form factor M.2
Harddisk/SSD 1 merk/product Micron_2450_MTFDKBA1T0TFK
DVD branden
Blu-ray lezen
Blu-ray branden

Connectiviteit / Netwerk

Netwerkaansluiting (bedraad)
WiFi standaard 802.11ax (Wi-Fi 6E)
WiFi adapter MediaTek Wi-Fi 6E MT7922 160MHz Wireless LAN Card
Bluetooth
Bluetooth-versie Bluetooth 5.2
4G (LTE)
5G

Aansluitingen

Smartcard
USB 3.2 - 10 Gb/s (Type-A) 2
USB 3.2 - 10 Gb/s (Type-C) 1
Thunderbolt 4 (Type-C) 1
Cardreader - SD
Cardreader - MicroSD
DVI-uitgang
VGA-uitgang
HDMI-uitgang
Aantal HDMI-uitgangen 1
Micro HDMI-uitgang
DisplayPort-uitgang
Mini DisplayPort-uitgang
Analoge audio aansluitingen 1
Aansluiting dockingstation
Kensingtonslot

Toetsenbord en touchpad

Toetsenbordindeling Qwerty
Numeriek toetsenbord
Toetsenbordverlichting helderheidsniveaus 3
Toetsenbordverlichting kleur Wit
Touchpad MS Precision compatible
Touchpad afzonderlijke muistoetsen

Camera

Webcam
Webcam resolutie 0,9 MPixel
Tweede camera
Flitser
Camera Windows Hello compatible
Webcamschuifje

Sensors

Accelerometer
Vingerafdruklezer
NFC

Overige hardware

Geïntegreerde microfoon

Maten en gewichten

Accu capaciteit (Wh) 75,7 Wh
Verwisselbare accu
Gewicht totaal 1,70 kg
Passief gekoeld

Fabrikantsopgave eigenschappen

Garantie 2 jaar

Productcodes

SKU 90NR09U3-M00B60
EAN 0195553679428
Toegevoegd aan Hardware Info donderdag 17 februari 2022

Testresultaten

Dit product is door Hardware Info getest op woensdag 9 maart 2022.

Metro Exodus

Metro Exodus - 1920x1080 - Medium 115,2 fps
Testconfiguratie
  • Game benchmarks 2022
Metro Exodus - 1920x1080 - Medium (99p) 16,91 ms
Testconfiguratie
  • Game benchmarks 2022
Metro Exodus - 1920x1080 - Medium (99.9p) 18,46 ms
Testconfiguratie
  • Game benchmarks 2022
Metro Exodus - 1920x1080 - Ultra 72,2 fps
Testconfiguratie
  • Game benchmarks 2022
Metro Exodus - 1920x1080 - Ultra (99p) 24,77 ms
Testconfiguratie
  • Game benchmarks 2022
Metro Exodus - 1920x1080 - Ultra (99.9p) 25,84 ms
Testconfiguratie
  • Game benchmarks 2022
Metro Exodus - 2560x1440 - Medium 83,2 fps
Testconfiguratie
  • Game benchmarks 2022
Metro Exodus - 2560x1440 - Medium (99p) 21,14 ms
Testconfiguratie
  • Game benchmarks 2022
Metro Exodus - 2560x1440 - Medium (99.9p) 22,7 ms
Testconfiguratie
  • Game benchmarks 2022
Metro Exodus - 2560x1440 - Ultra 55 fps
Testconfiguratie
  • Game benchmarks 2022
Metro Exodus - 2560x1440 - Ultra (99p) 29,87 ms
Testconfiguratie
  • Game benchmarks 2022
Metro Exodus - 2560x1440 - Ultra (99.9p) 31,03 ms
Testconfiguratie
  • Game benchmarks 2022
Metro Exodus - 3840x2160 - Medium 47,7 fps
Testconfiguratie
  • Game benchmarks 2022
Metro Exodus - 3840x2160 - Medium (99p) 32,57 ms
Testconfiguratie
  • Game benchmarks 2022
Metro Exodus - 3840x2160 - Medium (99.9p) 35,11 ms
Testconfiguratie
  • Game benchmarks 2022
Metro Exodus - 3840x2160 - Ultra 33,1 fps
Testconfiguratie
  • Game benchmarks 2022
Metro Exodus - 3840x2160 - Ultra (99p) 44,99 ms
Testconfiguratie
  • Game benchmarks 2022
Metro Exodus - 3840x2160 - Ultra (99.9p) 50,61 ms
Testconfiguratie
  • Game benchmarks 2022
Metro Exodus - 1920x1080 - Ultra (DXR - High) 50,2 fps
Testconfiguratie
  • Game benchmarks 2022
Metro Exodus - 1920x1080 - Ultra (DXR - High) (99p) 31,72 ms
Testconfiguratie
  • Game benchmarks 2022
Metro Exodus - 1920x1080 - Ultra (DXR - High) (99.9p) 44,71 ms
Testconfiguratie
  • Game benchmarks 2022
Metro Exodus - 2560x1440 - Ultra (DXR - High) 34,2 fps
Testconfiguratie
  • Game benchmarks 2022
Metro Exodus - 2560x1440 - Ultra (DXR - High) (99p) 42,48 ms
Testconfiguratie
  • Game benchmarks 2022
Metro Exodus - 2560x1440 - Ultra (DXR - High) (99.9p) 64,05 ms
Testconfiguratie
  • Game benchmarks 2022

Total War: Troy

Total War: Troy - 1920x1080 - Medium 161,5 fps
Testconfiguratie
  • Game benchmarks 2022
Total War: Troy - 1920x1080 - Medium (99p) 7,63 ms
Testconfiguratie
  • Game benchmarks 2022
Total War: Troy - 1920x1080 - Medium (99.9p) 8,29 ms
Testconfiguratie
  • Game benchmarks 2022
Total War: Troy - 1920x1080 - Ultra 100,2 fps
Testconfiguratie
  • Game benchmarks 2022
Total War: Troy - 1920x1080 - Ultra (99p) 12,73 ms
Testconfiguratie
  • Game benchmarks 2022
Total War: Troy - 1920x1080 - Ultra (99.9p) 14,31 ms
Testconfiguratie
  • Game benchmarks 2022
Total War: Troy - 2560x1440 - Medium 133,5 fps
Testconfiguratie
  • Game benchmarks 2022
Total War: Troy - 2560x1440 - Medium (99p) 8,91 ms
Testconfiguratie
  • Game benchmarks 2022
Total War: Troy - 2560x1440 - Medium (99.9p) 9,64 ms
Testconfiguratie
  • Game benchmarks 2022
Total War: Troy - 2560x1440 - Ultra 74,5 fps
Testconfiguratie
  • Game benchmarks 2022
Total War: Troy - 2560x1440 - Ultra (99p) 16,54 ms
Testconfiguratie
  • Game benchmarks 2022
Total War: Troy - 2560x1440 - Ultra (99.9p) 17,86 ms
Testconfiguratie
  • Game benchmarks 2022
Total War: Troy - 3840x2160 - Medium 69,4 fps
Testconfiguratie
  • Game benchmarks 2022
Total War: Troy - 3840x2160 - Medium (99p) 16,53 ms
Testconfiguratie
  • Game benchmarks 2022
Total War: Troy - 3840x2160 - Medium (99.9p) 17,58 ms
Testconfiguratie
  • Game benchmarks 2022
Total War: Troy - 3840x2160 - Ultra 39,4 fps
Testconfiguratie
  • Game benchmarks 2022
Total War: Troy - 3840x2160 - Ultra (99p) 30,71 ms
Testconfiguratie
  • Game benchmarks 2022
Total War: Troy - 3840x2160 - Ultra (99.9p) 36,68 ms
Testconfiguratie
  • Game benchmarks 2022

Far Cry: New Dawn

Far Cry: New Dawn - 1920x1080 - Medium 105,1 fps
Testconfiguratie
  • Game benchmarks 2022
Far Cry: New Dawn - 1920x1080 - Medium (99p) 12,72 ms
Testconfiguratie
  • Game benchmarks 2022
Far Cry: New Dawn - 1920x1080 - Medium (99.9p) 16,89 ms
Testconfiguratie
  • Game benchmarks 2022
Far Cry: New Dawn - 1920x1080 - Ultra 88,3 fps
Testconfiguratie
  • Game benchmarks 2022
Far Cry: New Dawn - 1920x1080 - Ultra (99p) 16,33 ms
Testconfiguratie
  • Game benchmarks 2022
Far Cry: New Dawn - 1920x1080 - Ultra (99.9p) 17,25 ms
Testconfiguratie
  • Game benchmarks 2022
Far Cry: New Dawn - 2560x1440 - Medium 99,1 fps
Testconfiguratie
  • Game benchmarks 2022
Far Cry: New Dawn - 2560x1440 - Medium (99p) 13,07 ms
Testconfiguratie
  • Game benchmarks 2022
Far Cry: New Dawn - 2560x1440 - Medium (99.9p) 17,95 ms
Testconfiguratie
  • Game benchmarks 2022
Far Cry: New Dawn - 2560x1440 - Ultra 84,7 fps
Testconfiguratie
  • Game benchmarks 2022
Far Cry: New Dawn - 2560x1440 - Ultra (99p) 16,32 ms
Testconfiguratie
  • Game benchmarks 2022
Far Cry: New Dawn - 2560x1440 - Ultra (99.9p) 17,15 ms
Testconfiguratie
  • Game benchmarks 2022
Far Cry: New Dawn - 3840x2160 - Medium 59,1 fps
Testconfiguratie
  • Game benchmarks 2022
Far Cry: New Dawn - 3840x2160 - Medium (99p) 20,78 ms
Testconfiguratie
  • Game benchmarks 2022
Far Cry: New Dawn - 3840x2160 - Medium (99.9p) 21,58 ms
Testconfiguratie
  • Game benchmarks 2022
Far Cry: New Dawn - 3840x2160 - Ultra 51,2 fps
Testconfiguratie
  • Game benchmarks 2022
Far Cry: New Dawn - 3840x2160 - Ultra (99p) 24,83 ms
Testconfiguratie
  • Game benchmarks 2022
Far Cry: New Dawn - 3840x2160 - Ultra (99.9p) 26,22 ms
Testconfiguratie
  • Game benchmarks 2022

F1 2020

F1 2020 (DX12) - 1920x1080 - Medium 257,9 fps
Testconfiguratie
  • Game benchmarks 2022
F1 2020 (DX12) - 1920x1080 - Medium (99p) 5,4 ms
Testconfiguratie
  • Game benchmarks 2022
F1 2020 (DX12) - 1920x1080 - Medium (99.9p) 6,4 ms
Testconfiguratie
  • Game benchmarks 2022
F1 2020 (DX12) - 1920x1080 - Ultra 176,8 fps
Testconfiguratie
  • Game benchmarks 2022
F1 2020 (DX12) - 1920x1080 - Ultra (99p) 7,1 ms
Testconfiguratie
  • Game benchmarks 2022
F1 2020 (DX12) - 1920x1080 - Ultra (99.9p) 8,1 ms
Testconfiguratie
  • Game benchmarks 2022
F1 2020 (DX12) - 2560x1440 - Medium 201,5 fps
Testconfiguratie
  • Game benchmarks 2022
F1 2020 (DX12) - 2560x1440 - Medium (99p) 6 ms
Testconfiguratie
  • Game benchmarks 2022
F1 2020 (DX12) - 2560x1440 - Medium (99.9p) 6,6 ms
Testconfiguratie
  • Game benchmarks 2022
F1 2020 (DX12) - 2560x1440 - Ultra 130,9 fps
Testconfiguratie
  • Game benchmarks 2022
F1 2020 (DX12) - 2560x1440 - Ultra (99p) 9,2 ms
Testconfiguratie
  • Game benchmarks 2022
F1 2020 (DX12) - 2560x1440 - Ultra (99.9p) 9,9 ms
Testconfiguratie
  • Game benchmarks 2022
F1 2020 (DX12) - 3840x2160 - Medium 108,3 fps
Testconfiguratie
  • Game benchmarks 2022
F1 2020 (DX12) - 3840x2160 - Medium (99p) 10,8 ms
Testconfiguratie
  • Game benchmarks 2022
F1 2020 (DX12) - 3840x2160 - Medium (99.9p) 11,6 ms
Testconfiguratie
  • Game benchmarks 2022
F1 2020 (DX12) - 3840x2160 - Ultra 74,1 fps
Testconfiguratie
  • Game benchmarks 2022
F1 2020 (DX12) - 3840x2160 - Ultra (99p) 15,7 ms
Testconfiguratie
  • Game benchmarks 2022
F1 2020 (DX12) - 3840x2160 - Ultra (99.9p) 16,9 ms
Testconfiguratie
  • Game benchmarks 2022

Geluidstest

Noise floor 14 dB(A)
Testconfiguratie
  • Geluidsdichte ruimte 2021
  • Larson Davis SoundAdvisor Model 831C
Afstand geluidsmeting 50 cm
Testconfiguratie
  • Geluidsdichte ruimte 2021
  • Larson Davis SoundAdvisor Model 831C
WebXPRT 3 - LAeq 14,3 dB
Testconfiguratie
  • Geluidsdichte ruimte 2021
  • Larson Davis SoundAdvisor Model 831C
PCMark 10 Express - LAeq 21,6 dB
Testconfiguratie
  • Geluidsdichte ruimte 2021
  • Larson Davis SoundAdvisor Model 831C
Blender - LAeq 49 dB
Testconfiguratie
  • Geluidsdichte ruimte 2021
  • Larson Davis SoundAdvisor Model 831C
F1 2020 - LAeq 48,9 dB
Testconfiguratie
  • Geluidsdichte ruimte 2021
  • Larson Davis SoundAdvisor Model 831C

PCMark 10 Storage

PCMark 10 - Gebruiken Adobe Photoshop Heavy 795
Testconfiguratie
  • Windows benchmarks
PCMark 10 - Storage - Totaalscore - Toegangstijd 75
Testconfiguratie
  • Windows benchmarks
PCMark 10 - Storage - Totaalscore - Bandbreedte 357,73
PCMark 10 - Storage - Totaalscore 2.236
Testconfiguratie
  • Windows benchmarks
PCMark 10 - 2.37GB_(399_JPEGs)_leestest 427
PCMark 10 - 2.37GB_(399_JPEGs)_kopieertest 600
Testconfiguratie
  • Windows benchmarks
PCMark 10 - 2.37GB_(399_JPEGs)_schrijftest 411
Testconfiguratie
  • Windows benchmarks
PCMark 10 - 2GB_(4_ISOs)_leestest 2.272
Testconfiguratie
  • Windows benchmarks
PCMark 10 - 2GB_(4_ISOs)_kopieertest 2.023
Testconfiguratie
  • Windows benchmarks
PCMark 10 - 2GB_(4_ISOs)_schrijftest 3.003
Testconfiguratie
  • Windows benchmarks
PCMark 10 - Gebruiken Microsoft PowerPoint 135
Testconfiguratie
  • Windows benchmarks
PCMark 10 - Gebruiken Microsoft Excel 120
Testconfiguratie
  • Windows benchmarks
PCMark 10 - Gebruiken Adobe Photoshop Light 241
Testconfiguratie
  • Windows benchmarks
PCMark 10 - Starten Windows 10 302
Testconfiguratie
  • Windows benchmarks
PCMark 10 - Gebruiken Adobe InDesign 202
Testconfiguratie
  • Windows benchmarks
PCMark 10 - Gebruiken Adobe Illustrator 209
PCMark 10 - Gebruiken Adobe After Effects 361
Testconfiguratie
  • Windows benchmarks
PCMark 10 - Starten Overwatch 294
Testconfiguratie
  • Windows benchmarks
PCMark 10 - Starten Call of Duty: Black Ops 4 595
Testconfiguratie
  • Windows benchmarks
PCMark 10 - Starten Battlefield V 548
Testconfiguratie
  • Windows benchmarks
PCMark 10 - Starten Adobe Photoshop 176
Testconfiguratie
  • Windows benchmarks
PCMark 10 - Starten Adobe Lightroom 129
Testconfiguratie
  • Windows benchmarks
PCMark 10 - Starten Adobe Premiere_Pro 206
Testconfiguratie
  • Windows benchmarks
PCMark 10 - Starten Adobe Illustrator 153
Testconfiguratie
  • Windows benchmarks
PCMark 10 - Starten Adobe After Effects 181
Testconfiguratie
  • Windows benchmarks
PCMark 10 - Starten Adobe Acrobat 200
Testconfiguratie
  • Windows benchmarks
PCMark 10 - Quick Storage - Totaalscore 2.357
Testconfiguratie
  • Windows benchmarks
PCMark 10 - Quick Storage - Totaalscore - Bandbreedte 291,46
Testconfiguratie
  • Windows benchmarks
PCMark 10 - Quick Storage - Totaalscore - Toegangstijd 55
Testconfiguratie
  • Windows benchmarks

Platform onafhankelijke tests

Geekbench 5 - Multi 10.444
Testconfiguratie
  • Platform onafhankelijke tests
Geekbench 5 - Multi Crypto 8.229
Testconfiguratie
  • Platform onafhankelijke tests
Geekbench 5 - Multi Integer 10.035
Testconfiguratie
  • Platform onafhankelijke tests
Geekbench 5 - Multi Floating Point 11.700
Testconfiguratie
  • Platform onafhankelijke tests
Geekbench 5 - Single 1.649
Testconfiguratie
  • Platform onafhankelijke tests
Geekbench 5 - Single Crypto 3.903
Testconfiguratie
  • Platform onafhankelijke tests
Geekbench 5 - Single Integer 1.392
Testconfiguratie
  • Platform onafhankelijke tests
Geekbench 5 - Single Floating Point 1.829
Testconfiguratie
  • Platform onafhankelijke tests
Geekbench 5 - OpenCL 81.343
Testconfiguratie
  • Platform onafhankelijke tests

Windows benchmarks

3DMark - Fire Strike 24.114
Testconfiguratie
  • Windows benchmarks
3DMark - Fire Strike Graphics 27.907
Testconfiguratie
  • Windows benchmarks
3DMark - Fire Strike Physics 24.637
Testconfiguratie
  • Windows benchmarks
3DMark - Fire Strike Combined 11.756
Testconfiguratie
  • Windows benchmarks
3DMark - Fire Strike Extreme 11.789
Testconfiguratie
  • Windows benchmarks
3DMark - Time Spy 9.223
Testconfiguratie
  • Windows benchmarks
3DMark - Time Spy Graphics 9.094
Testconfiguratie
  • Windows benchmarks
3DMark - Time Spy CPU 10.032
Testconfiguratie
  • Windows benchmarks
3DMark - Night Raid 50.684
Testconfiguratie
  • Windows benchmarks
3DMark - Night Raid Graphics 85.907
Testconfiguratie
  • Windows benchmarks
3DMark - Night Raid CPU 15.251
Testconfiguratie
  • Windows benchmarks
Cinebench R15 - Single 254
Testconfiguratie
  • Windows benchmarks
Cinebench R15 - Multi 2.349
Testconfiguratie
  • Windows benchmarks
Cinebench R20 - Single 614
Testconfiguratie
  • Windows benchmarks
Cinebench R20 - Multi 5.660
Testconfiguratie
  • Windows benchmarks
Cinebench R23 - Single 1.590
Testconfiguratie
  • Windows benchmarks
Cinebench R23 - Multi 14.565
Testconfiguratie
  • Windows benchmarks
Blender duurtest run #1 18,88
Testconfiguratie
  • Windows benchmarks
Blender duurtest run #2 19,33
Testconfiguratie
  • Windows benchmarks
Blender duurtest run #3 19,69
Testconfiguratie
  • Windows benchmarks
Blender duurtest run #4 19,97
Testconfiguratie
  • Windows benchmarks
Blender duurtest run #5 20,11
Testconfiguratie
  • Windows benchmarks
Blender duurtest run #6 20,27
Testconfiguratie
  • Windows benchmarks
Blender duurtest run #7 20,33
Testconfiguratie
  • Windows benchmarks
Blender duurtest run #8 20,45
Testconfiguratie
  • Windows benchmarks
Blender duurtest run #9 20,58
Testconfiguratie
  • Windows benchmarks
Blender duurtest run #10 20,56
Testconfiguratie
  • Windows benchmarks
Blender duurtest run #11 20,54
Testconfiguratie
  • Windows benchmarks
Blender duurtest run #12 20,53
Testconfiguratie
  • Windows benchmarks
Blender duurtest run #13 20,5
Testconfiguratie
  • Windows benchmarks
Blender duurtest run #14 20,47
Testconfiguratie
  • Windows benchmarks
Blender duurtest run #15 20,5
Testconfiguratie
  • Windows benchmarks
Blender duurtest run #16 20,49
Testconfiguratie
  • Windows benchmarks
Blender duurtest run #17 20,53
Testconfiguratie
  • Windows benchmarks
Blender duurtest run #18 20,58
Testconfiguratie
  • Windows benchmarks
Blender duurtest run #19 20,55
Testconfiguratie
  • Windows benchmarks
Blender duurtest run #20 20,57
Testconfiguratie
  • Windows benchmarks
Blender duurtest run #21 20,61
Testconfiguratie
  • Windows benchmarks
Blender duurtest run #22 20,58
Testconfiguratie
  • Windows benchmarks
Blender duurtest run #23 20,57
Testconfiguratie
  • Windows benchmarks
Blender duurtest run #24 20,63
Testconfiguratie
  • Windows benchmarks
Blender duurtest run #25 20,71
Testconfiguratie
  • Windows benchmarks
Blender duurtest run #26 20,62
Testconfiguratie
  • Windows benchmarks
Blender duurtest run #27 20,68
Testconfiguratie
  • Windows benchmarks
Blender duurtest run #28 20,61
Testconfiguratie
  • Windows benchmarks
Blender duurtest run #29 20,63
Testconfiguratie
  • Windows benchmarks
Blender duurtest run #30 20,89
Testconfiguratie
  • Windows benchmarks
Blender duurtest run #31 20,5
Testconfiguratie
  • Windows benchmarks
Blender duurtest run #32 20,69
Testconfiguratie
  • Windows benchmarks
Blender duurtest run #33 20,92
Testconfiguratie
  • Windows benchmarks
Blender duurtest run #34 21,13
Testconfiguratie
  • Windows benchmarks
Blender duurtest run #35 21,24
Testconfiguratie
  • Windows benchmarks
Blender duurtest run #36 21,3
Testconfiguratie
  • Windows benchmarks
Blender duurtest run #37 21,35
Testconfiguratie
  • Windows benchmarks
Blender duurtest run #38 21,44
Testconfiguratie
  • Windows benchmarks
Blender duurtest run #39 21,5
Testconfiguratie
  • Windows benchmarks
Blender duurtest run #40 21,51
Testconfiguratie
  • Windows benchmarks
Blender duurtest run #41 21,52
Testconfiguratie
  • Windows benchmarks
Blender duurtest run #42 21,56
Testconfiguratie
  • Windows benchmarks
Blender duurtest run #43 21,5
Testconfiguratie
  • Windows benchmarks
Blender duurtest run #44 21,59
Testconfiguratie
  • Windows benchmarks
Blender duurtest run #45 21,63
Testconfiguratie
  • Windows benchmarks
Blender duurtest run #46 21,66
Testconfiguratie
  • Windows benchmarks
Blender duurtest run #47 21,66
Testconfiguratie
  • Windows benchmarks
Blender duurtest run #48 21,7
Testconfiguratie
  • Windows benchmarks
Blender duurtest run #49 21,74
Testconfiguratie
  • Windows benchmarks
Blender duurtest run #50 21,67
Testconfiguratie
  • Windows benchmarks
PCMark 10 Extended 9.499
Testconfiguratie
  • Windows benchmarks
PCMark 10 Essentials 11.324
Testconfiguratie
  • Windows benchmarks
PCMark 10 App Start-up 16.552
Testconfiguratie
  • Windows benchmarks
PCMark 10 Video Conferencing 9.366
Testconfiguratie
  • Windows benchmarks
PCMark 10 Web Browsing 9.369
Testconfiguratie
  • Windows benchmarks
PCMark 10 Productivity 8.992
Testconfiguratie
  • Windows benchmarks
PCMark 10 Spreadsheets 11.131
Testconfiguratie
  • Windows benchmarks
PCMark 10 Writing 7.265
Testconfiguratie
  • Windows benchmarks
PCMark 10 Digital Content Creation 11.291
Testconfiguratie
  • Windows benchmarks
PCMark 10 Photo Editing 19.847
Testconfiguratie
  • Windows benchmarks
PCMark 10 Rendering and Visualization 14.158
Testconfiguratie
  • Windows benchmarks
PCMark 10 Video Editing 5.123
Testconfiguratie
  • Windows benchmarks
PCMark 10 Gaming 19.139
Testconfiguratie
  • Windows benchmarks
PCMark 10 Graphics 26.246
Testconfiguratie
  • Windows benchmarks
PCMark 10 Physics 24.676
Testconfiguratie
  • Windows benchmarks
PCMark 10 Combined 11.211
Testconfiguratie
  • Windows benchmarks

Energieverbruik / Accu

Browser accutest - 180 cd/m2 620 min.
Testconfiguratie
  • Windows benchmarks
PCMark 10 Accu Digital 0
Testconfiguratie
  • Windows benchmarks
PCMark 10 Accu Essentials 0
Testconfiguratie
  • Windows benchmarks
PCMark 10 Accu Productivity 0
Testconfiguratie
  • Windows benchmarks
PCMark 10 Accu Duration in Minuten 0
Testconfiguratie
  • Windows benchmarks
PCMark 10 Accu Aantal Runs 0
Testconfiguratie
  • Windows benchmarks

Testresultaten beeldscherm

Gemeten kleurruimte sRGB
Testconfiguratie
  • Beeldscherm test SpectraCal CALman 5.13
Kleurtemperatuur 7.076 K
Testconfiguratie
  • Beeldscherm test SpectraCal CALman 5.13
Helderheid wit 472 cd/m²
Testconfiguratie
  • Beeldscherm test SpectraCal CALman 5.13
Helderheid zwart 0,49 cd/m²
Testconfiguratie
  • Beeldscherm test SpectraCal CALman 5.13
Contrast 964,2 : 1
Testconfiguratie
  • Beeldscherm test SpectraCal CALman 5.13
Checkerboard wit 472,374 cd/m²
Testconfiguratie
  • Beeldscherm test SpectraCal CALman 5.13
Checkerboard zwart 0,487 cd/m²
Testconfiguratie
  • Beeldscherm test SpectraCal CALman 5.13
Checkerboard contrast 970 : 1
Testconfiguratie
  • Beeldscherm test SpectraCal CALman 5.13
Gamma 2,14
Testconfiguratie
  • Beeldscherm test SpectraCal CALman 5.13
Gamma (afwijking van 2,2) 0,06
Testconfiguratie
  • Beeldscherm test SpectraCal CALman 5.13
Kleurafwijking rood (Delta E 1994) 1,54
Testconfiguratie
  • Beeldscherm test SpectraCal CALman 5 i.c.m. X
  • Rite i1 Display Pro colorimeter
Kleurafwijking groen (Delta E 1994) 0,65
Testconfiguratie
  • Beeldscherm test SpectraCal CALman 5 i.c.m. X
  • Rite i1 Display Pro colorimeter
Kleurafwijking blauw (Delta E 1994) 3,35
Testconfiguratie
  • Beeldscherm test SpectraCal CALman 5 i.c.m. X
  • Rite i1 Display Pro colorimeter
Kleurafwijking cyaan (Delta E 1994) 4,26
Testconfiguratie
  • Beeldscherm test SpectraCal CALman 5 i.c.m. X
  • Rite i1 Display Pro colorimeter
Kleurafwijking magenta (Delta E 1994) 1,65
Testconfiguratie
  • Beeldscherm test SpectraCal CALman 5 i.c.m. X
  • Rite i1 Display Pro colorimeter
Kleurafwijking geel (Delta E 1994) 1,05
Testconfiguratie
  • Beeldscherm test SpectraCal CALman 5 i.c.m. X
  • Rite i1 Display Pro colorimeter
Gemiddelde kleurafwijking (Delta E 1994) 2,1
Testconfiguratie
  • Beeldscherm test SpectraCal CALman 5 i.c.m. X
  • Rite i1 Display Pro colorimeter
Gemiddelde grijsafwijking (Delta E 1994) 4,8
Testconfiguratie
  • Beeldscherm test SpectraCal CALman 5 i.c.m. X
  • Rite i1 Display Pro colorimeter
Kleurafwijking 75% wit (Delta E 2000) 5,09 mΔuv
Testconfiguratie
  • Beeldscherm test SpectraCal CALman 5 i.c.m. X
  • Rite i1 Display Pro colorimeter
Kleurafwijking 75% rood (Delta E 2000) 1,64 mΔuv
Testconfiguratie
  • Beeldscherm test SpectraCal CALman 5 i.c.m. X
  • Rite i1 Display Pro colorimeter
Kleurafwijking 75% groen (Delta E 2000) 0,57 mΔuv
Testconfiguratie
  • Beeldscherm test SpectraCal CALman 5 i.c.m. X
  • Rite i1 Display Pro colorimeter
Kleurafwijking 75% blauw (Delta E 2000) 3,25 mΔuv
Testconfiguratie
  • Beeldscherm test SpectraCal CALman 5 i.c.m. X
  • Rite i1 Display Pro colorimeter
Kleurafwijking 75% cyaan (Delta E 2000) 4,24 mΔuv
Testconfiguratie
  • Beeldscherm test SpectraCal CALman 5 i.c.m. X
  • Rite i1 Display Pro colorimeter
Kleurafwijking 75% magenta (Delta E 2000) 1,52 mΔuv
Testconfiguratie
  • Beeldscherm test SpectraCal CALman 5 i.c.m. X
  • Rite i1 Display Pro colorimeter
Kleurafwijking 75% geel (Delta E 2000) 1,17 mΔuv
Testconfiguratie
  • Beeldscherm test SpectraCal CALman 5 i.c.m. X
  • Rite i1 Display Pro colorimeter
Gemiddelde kleurafwijking (Delta E 2000) 2,9 mΔuv
Testconfiguratie
  • Beeldscherm test SpectraCal CALman 5.13
Kleurafwijking 100% wit (Delta E 2000) 5,55 mΔuv
Testconfiguratie
  • Beeldscherm test SpectraCal CALman 5 i.c.m. X
  • Rite i1 Display Pro colorimeter
Gemiddelde kleurafwijking excl. wit (Delta E 2000) 2,1
Testconfiguratie
  • Beeldscherm test SpectraCal CALman 5 i.c.m. X
  • Rite i1 Display Pro colorimeter
Gemiddelde grijsafwijking (Delta E 2000) 4,4 mΔuv
Testconfiguratie
  • Beeldscherm test SpectraCal CALman 5.13
sRGB dekking 95,1 %
Testconfiguratie
  • Beeldscherm test SpectraCal CALman 5.13
DCI-P3 dekking 70,5 %
Testconfiguratie
  • Beeldscherm test SpectraCal CALman 5.13
Rec 2020 dekking 50,8 %
Testconfiguratie
  • Beeldscherm test SpectraCal CALman 5.13

Alternatieven

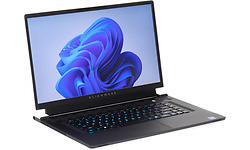
Alienware x17 P48E002

  • Intel Core i7 12700H
  • 32 GB
  • 17.3 inch
  • 1920x1080
  • Nvidia GeForce RTX 3080 Max-Q Design
  • 1024 GB
  • Qwerty
  • 3.05 kg
  • Windows
 

Asus Asus RoG Strix Scar G733C

  • Intel Core i9 12950HX
  • 32 GB
  • 17.3 inch
  • Nvidia GeForce RTX 3080 Ti
  • 4096 GB
  • Qwerty
  • Windows
 

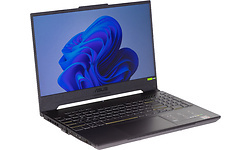
Asus TUF Gaming A15 FA507NV-LP066W

  • AMD Ryzen 7 7735HS
  • 16 GB
  • 15.6 inch
  • 1920x1080
  • Nvidia GeForce RTX 4060 Laptop GPU
  • 512 GB
  • Qwerty
  • 2.1 kg
  • Windows
 

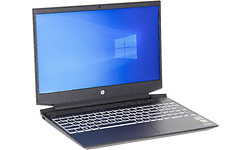
HP Pavilion Gaming 15-ec2747nd (4P6K4EA)

  • AMD Ryzen 5 5600H
  • 16 GB
  • 15.6 inch
  • 1920x1080
  • Nvidia GeForce RTX 3050
  • 512 GB
  • Qwerty
  • 2.09 kg
  • Windows
 

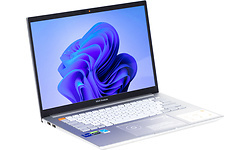
Asus VivoBook Pro 14X N7400PC-KM010W

  • Intel Core i7 11370H
  • 16 GB
  • 14 inch
  • 2880x1800
  • Nvidia GeForce RTX 3050
  • 1024 GB
  • Qwerty
  • 1.50 kg
  • Windows
 

Asus RoG Zephyrus Duo 16 GX650RX-LO080W

  • AMD Ryzen 9 6980HX
  • 32 GB
  • 16 inch
  • 2560x1600
  • Touchscreen
  • Nvidia GeForce RTX 3080 Max-P Design
  • 2048 GB
  • Qwerty
  • 2.60 kg
  • Windows
 

MSI Stealth GS77 12UHS-032NL

  • Intel Core i9 12900H
  • 64 GB
  • 17.3 inch
  • 3840x2160
  • Nvidia GeForce RTX 3080 Ti
  • 2048 GB
  • Qwerty
  • 2.91 kg
  • Windows Pro
 

Lenovo Legion 5 Pro (82RF0009US)

  • Intel Core i7 12700H
  • 16 GB
  • 16 inch
  • 2560x1600
  • Nvidia GeForce RTX 3060
  • 2048 GB
  • Qwerty
  • 2.55 kg
  • Windows
 

Medion Erazer Deputy P50 MD62519 (30035305)

  • Intel Core i7 13700HX
  • 16 GB
  • 15.6 inch
  • 2560x1440
  • Nvidia GeForce RTX 4060
  • 1024 GB
  • Azerty
  • 2 kg
  • Windows
 

Samsung Galaxy Book3 Ultra (NP960XFH-XA1NL)

  • Intel Core i7 13700H
  • 16 GB
  • 16 inch
  • 2880x1800
  • Nvidia GeForce RTX 4050
  • 1024 GB
  • Qwerty
  • 1.81 kg
  • Windows
 

HP Victus 16-s0976nd

  • AMD Ryzen 7 7840HS
  • 16 GB
  • 16.1 inch
  • 1920x1080
  • Nvidia GeForce RTX 4070 Laptop GPU
  • 512 GB
  • Qwerty
  • 2.36 kg
  • Windows
 

Asus VivoBook 16X K3605VC-N1068W

  • Intel Core i9 13900H
  • 16 GB
  • 16 inch
  • 1920x1200
  • Nvidia GeForce RTX 3050 Laptop GPU
  • 512 GB
  • Qwerty
  • 1.94 kg
  • Windows
 
0