Getest

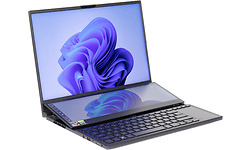
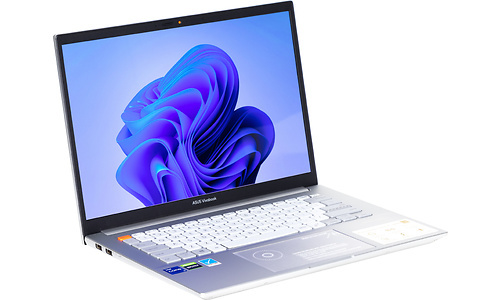
Asus VivoBook Pro 14X N7400PC-KM010W

Prijsverloop

Dit product is niet (meer) verkrijgbaar bij de bij Hardware Info aangesloten shops.

Specificaties

Belangrijkste specificaties

Processor type Intel Core i7 11370H
Geheugen capaciteit 16 GB
Scherm diagonaal 14 inch
Resolutie 2880x1800
Touchscreen
GPU type Nvidia GeForce RTX 3050
Totale opslagcapaciteit 1.024 GB
Toetsenbordindeling Qwerty
Gewicht totaal 1,50 kg
Besturingssysteem (serie) Windows

Processor / Chipset / Geheugen

Processor serie Intel Core i7
Processor type Intel Core i7 11370H
Processor klokfrequentie 3,3 GHz
Processor klokfrequentie (max. turbo) 4,8 GHz
Configureerbare TDP-down 28 W
Configureerbare TDP-up 35 W
Configureerbare TDP-downfrequentie 3 GHz
Configureerbare TDP-upfrequentie 3 GHz
Aantal processorcores 4
Geheugen capaciteit 16 GB
Type geheugen DDR4
Geheugen klokfrequentie 3.200 MHz
Geheugen form factor On-board
SODIMM sloten 0
Vrije SODIMM sloten 0
Werkgeheugen uitbreidbaar tot 16 GB

Scherm

Scherm diagonaal 14 inch
Resolutie 2880x1800
Verhouding 16:10
Pixeldichtheid 243 ppi
Scherm type (mat/glans) Mat
Paneeltype OLED
LED-achtergrondverlichting
Touchscreen
Maximale verversingsfrequentie 90 Hz

Graphics

GPU type Nvidia GeForce RTX 3050
Geïntegreerde / losse GPU Losse chip
Videogeheugen 4 GB

Opslag

Totale opslagcapaciteit 1.024 GB
SSD opslagcapaciteit 1.024 GB
Beschikbaar opslaggeheugen 897,3 GB
Aantal harddisks / SSD's 1
Harddisk/SSD 1 capaciteit 1.024 GB
Harddisk/SSD 1 soort SSD/Flash
Harddisk/SSD 1 form factor M.2
Harddisk/SSD 1 merk/product SK hynix HFM001TD3JX013N
DVD branden
Blu-ray lezen
Blu-ray branden

Connectiviteit / Netwerk

Netwerkaansluiting (bedraad)
Netwerksnelheid (bedraad) 1000 Mbit/s
WiFi standaard 802.11ax (Wi-Fi 6)
WiFi adapter Intel(R) Wi-Fi 6 AX201 160Mhz
Bluetooth
Bluetooth-versie Bluetooth 5.2
4G (LTE)
5G

Aansluitingen

Smartcard
USB 3.2 - 5 Gb/s (Type-A) 3
USB 3.2 - 5 Gb/s (Type-C) 1
Cardreader - SD
Cardreader - MicroSD
DVI-uitgang
VGA-uitgang
HDMI-uitgang
Aantal HDMI-uitgangen 1
Micro HDMI-uitgang
HDMI-versie 2.0
DisplayPort-uitgang
Mini DisplayPort-uitgang
Analoge audio aansluitingen 1
Aansluiting dockingstation
Kensingtonslot

Toetsenbord en touchpad

Toetsenbordindeling Qwerty
Numeriek toetsenbord
Toetsenbordverlichting helderheidsniveaus 3
Toetsenbordverlichting kleur Wit
Touchpad afzonderlijke muistoetsen

Camera

Webcam
Webcam resolutie 0,9 MPixel
Tweede camera
Flitser
Camera Windows Hello compatible
Webcamschuifje

Sensors

Accelerometer
Vingerafdruklezer
NFC

Overige hardware

Trusted Platform Module (TPM)
Geïntegreerde microfoon

Maten en gewichten

Accu capaciteit (Wh) 63,9 Wh
Verwisselbare accu
Gewicht totaal 1,50 kg
Afmeting - Breedte 30,6 cm
Afmeting - Diepte 22,8 cm
Afmeting - Hoogte/Dikte 1,7 cm
Passief gekoeld

Software

Besturingssysteem Microsoft Windows 11 Home
Besturingssysteem (serie) Windows
Windows versie 21H2
Windows OS Build 22.000,613
Aantal bits OS 64 bit

Fabrikantsopgave eigenschappen

Garantie 2 jaar

Productcodes

SKU 90NB0U44-M03140, N7400PC-KM010W
EAN 4711081391715
Toegevoegd aan Hardware Info vrijdag 24 december 2021

Testresultaten

Dit product is door Hardware Info getest op maandag 25 april 2022.

Metro Exodus

Metro Exodus - 1920x1080 - Medium 49,5 fps
Testconfiguratie
  • Game benchmarks 2022
Metro Exodus - 1920x1080 - Medium (99p) 40,28 ms
Testconfiguratie
  • Game benchmarks 2022
Metro Exodus - 1920x1080 - Medium (99.9p) 48,66 ms
Testconfiguratie
  • Game benchmarks 2022
Metro Exodus - 1920x1080 - Ultra 30,2 fps
Testconfiguratie
  • Game benchmarks 2022
Metro Exodus - 1920x1080 - Ultra (99p) 58,11 ms
Testconfiguratie
  • Game benchmarks 2022
Metro Exodus - 1920x1080 - Ultra (99.9p) 72,66 ms
Testconfiguratie
  • Game benchmarks 2022
Metro Exodus - 2560x1440 - Medium 28,3 fps
Testconfiguratie
  • Game benchmarks 2022
Metro Exodus - 2560x1440 - Medium (99p) 55,94 ms
Testconfiguratie
  • Game benchmarks 2022
Metro Exodus - 2560x1440 - Medium (99.9p) 83,11 ms
Testconfiguratie
  • Game benchmarks 2022
Metro Exodus - 2560x1440 - Ultra 23,1 fps
Testconfiguratie
  • Game benchmarks 2022
Metro Exodus - 2560x1440 - Ultra (99p) 70,42 ms
Testconfiguratie
  • Game benchmarks 2022
Metro Exodus - 2560x1440 - Ultra (99.9p) 77,61 ms
Testconfiguratie
  • Game benchmarks 2022
Metro Exodus - 3840x2160 - Medium 20,6 fps
Testconfiguratie
  • Game benchmarks 2022
Metro Exodus - 3840x2160 - Medium (99p) 74,81 ms
Testconfiguratie
  • Game benchmarks 2022
Metro Exodus - 3840x2160 - Medium (99.9p) 98,78 ms
Testconfiguratie
  • Game benchmarks 2022
Metro Exodus - 3840x2160 - Ultra 13,9 fps
Testconfiguratie
  • Game benchmarks 2022
Metro Exodus - 3840x2160 - Ultra (99p) 108 ms
Testconfiguratie
  • Game benchmarks 2022
Metro Exodus - 3840x2160 - Ultra (99.9p) 150,8 ms
Testconfiguratie
  • Game benchmarks 2022
Metro Exodus - 1920x1080 - Ultra (DXR - High) 25,1 fps
Testconfiguratie
  • Game benchmarks 2022
Metro Exodus - 1920x1080 - Ultra (DXR - High) (99p) 69,46 ms
Testconfiguratie
  • Game benchmarks 2022
Metro Exodus - 1920x1080 - Ultra (DXR - High) (99.9p) 91,27 ms
Testconfiguratie
  • Game benchmarks 2022
Metro Exodus - 2560x1440 - Ultra (DXR - High) 17,8 fps
Testconfiguratie
  • Game benchmarks 2022
Metro Exodus - 2560x1440 - Ultra (DXR - High) (99p) 89,16 ms
Testconfiguratie
  • Game benchmarks 2022
Metro Exodus - 2560x1440 - Ultra (DXR - High) (99.9p) 124,92 ms
Testconfiguratie
  • Game benchmarks 2022

Total War: Troy

Total War: Troy - 1920x1080 - Medium 87,5 fps
Testconfiguratie
  • Game benchmarks 2022
Total War: Troy - 1920x1080 - Medium (99p) 13,93 ms
Testconfiguratie
  • Game benchmarks 2022
Total War: Troy - 1920x1080 - Medium (99.9p) 14,86 ms
Testconfiguratie
  • Game benchmarks 2022
Total War: Troy - 1920x1080 - Ultra 39,8 fps
Testconfiguratie
  • Game benchmarks 2022
Total War: Troy - 1920x1080 - Ultra (99p) 32,98 ms
Testconfiguratie
  • Game benchmarks 2022
Total War: Troy - 1920x1080 - Ultra (99.9p) 35,27 ms
Testconfiguratie
  • Game benchmarks 2022
Total War: Troy - 2560x1440 - Medium 64 fps
Testconfiguratie
  • Game benchmarks 2022
Total War: Troy - 2560x1440 - Medium (99p) 19,01 ms
Testconfiguratie
  • Game benchmarks 2022
Total War: Troy - 2560x1440 - Medium (99.9p) 19,98 ms
Testconfiguratie
  • Game benchmarks 2022
Total War: Troy - 2560x1440 - Ultra 29,8 fps
Testconfiguratie
  • Game benchmarks 2022
Total War: Troy - 2560x1440 - Ultra (99p) 42,36 ms
Testconfiguratie
  • Game benchmarks 2022
Total War: Troy - 2560x1440 - Ultra (99.9p) 45,28 ms
Testconfiguratie
  • Game benchmarks 2022
Total War: Troy - 3840x2160 - Medium 37,8 fps
Testconfiguratie
  • Game benchmarks 2022
Total War: Troy - 3840x2160 - Medium (99p) 30,98 ms
Testconfiguratie
  • Game benchmarks 2022
Total War: Troy - 3840x2160 - Medium (99.9p) 32,11 ms
Testconfiguratie
  • Game benchmarks 2022
Total War: Troy - 3840x2160 - Ultra 17,7 fps
Testconfiguratie
  • Game benchmarks 2022
Total War: Troy - 3840x2160 - Ultra (99p) 67,69 ms
Testconfiguratie
  • Game benchmarks 2022
Total War: Troy - 3840x2160 - Ultra (99.9p) 71,37 ms
Testconfiguratie
  • Game benchmarks 2022

Far Cry: New Dawn

Far Cry: New Dawn - 1920x1080 - Medium 70 fps
Testconfiguratie
  • Game benchmarks 2022
Far Cry: New Dawn - 1920x1080 - Medium (99p) 20,21 ms
Testconfiguratie
  • Game benchmarks 2022
Far Cry: New Dawn - 1920x1080 - Medium (99.9p) 22,81 ms
Testconfiguratie
  • Game benchmarks 2022
Far Cry: New Dawn - 1920x1080 - Ultra 58,7 fps
Testconfiguratie
  • Game benchmarks 2022
Far Cry: New Dawn - 1920x1080 - Ultra (99p) 24,63 ms
Testconfiguratie
  • Game benchmarks 2022
Far Cry: New Dawn - 1920x1080 - Ultra (99.9p) 27,42 ms
Testconfiguratie
  • Game benchmarks 2022
Far Cry: New Dawn - 2560x1440 - Medium 52,1 fps
Testconfiguratie
  • Game benchmarks 2022
Far Cry: New Dawn - 2560x1440 - Medium (99p) 24,27 ms
Testconfiguratie
  • Game benchmarks 2022
Far Cry: New Dawn - 2560x1440 - Medium (99.9p) 26,3 ms
Testconfiguratie
  • Game benchmarks 2022
Far Cry: New Dawn - 2560x1440 - Ultra 43 fps
Testconfiguratie
  • Game benchmarks 2022
Far Cry: New Dawn - 2560x1440 - Ultra (99p) 30,25 ms
Testconfiguratie
  • Game benchmarks 2022
Far Cry: New Dawn - 2560x1440 - Ultra (99.9p) 32,98 ms
Testconfiguratie
  • Game benchmarks 2022
Far Cry: New Dawn - 3840x2160 - Medium 26,9 fps
Testconfiguratie
  • Game benchmarks 2022
Far Cry: New Dawn - 3840x2160 - Medium (99p) 46,07 ms
Testconfiguratie
  • Game benchmarks 2022
Far Cry: New Dawn - 3840x2160 - Medium (99.9p) 51,21 ms
Testconfiguratie
  • Game benchmarks 2022
Far Cry: New Dawn - 3840x2160 - Ultra 20,2 fps
Testconfiguratie
  • Game benchmarks 2022
Far Cry: New Dawn - 3840x2160 - Ultra (99p) 61,51 ms
Testconfiguratie
  • Game benchmarks 2022
Far Cry: New Dawn - 3840x2160 - Ultra (99.9p) 64,05 ms
Testconfiguratie
  • Game benchmarks 2022

F1 2020

F1 2020 (DX12) - 1920x1080 - Medium 111,9 fps
Testconfiguratie
  • Game benchmarks 2022
F1 2020 (DX12) - 1920x1080 - Medium (99p) 12,2 ms
Testconfiguratie
  • Game benchmarks 2022
F1 2020 (DX12) - 1920x1080 - Medium (99.9p) 14,1 ms
Testconfiguratie
  • Game benchmarks 2022
F1 2020 (DX12) - 1920x1080 - Ultra 76,3 fps
Testconfiguratie
  • Game benchmarks 2022
F1 2020 (DX12) - 1920x1080 - Ultra (99p) 17 ms
Testconfiguratie
  • Game benchmarks 2022
F1 2020 (DX12) - 1920x1080 - Ultra (99.9p) 19,2 ms
Testconfiguratie
  • Game benchmarks 2022
F1 2020 (DX12) - 2560x1440 - Medium 80,4 fps
Testconfiguratie
  • Game benchmarks 2022
F1 2020 (DX12) - 2560x1440 - Medium (99p) 16,1 ms
Testconfiguratie
  • Game benchmarks 2022
F1 2020 (DX12) - 2560x1440 - Medium (99.9p) 18 ms
Testconfiguratie
  • Game benchmarks 2022
F1 2020 (DX12) - 2560x1440 - Ultra 54,8 fps
Testconfiguratie
  • Game benchmarks 2022
F1 2020 (DX12) - 2560x1440 - Ultra (99p) 22,6 ms
Testconfiguratie
  • Game benchmarks 2022
F1 2020 (DX12) - 2560x1440 - Ultra (99.9p) 24,7 ms
Testconfiguratie
  • Game benchmarks 2022
F1 2020 (DX12) - 3840x2160 - Medium 46,9 fps
Testconfiguratie
  • Game benchmarks 2022
F1 2020 (DX12) - 3840x2160 - Medium (99p) 24,7 ms
Testconfiguratie
  • Game benchmarks 2022
F1 2020 (DX12) - 3840x2160 - Medium (99.9p) 26,5 ms
Testconfiguratie
  • Game benchmarks 2022
F1 2020 (DX12) - 3840x2160 - Ultra 30,8 fps
Testconfiguratie
  • Game benchmarks 2022
F1 2020 (DX12) - 3840x2160 - Ultra (99p) 37,2 ms
Testconfiguratie
  • Game benchmarks 2022
F1 2020 (DX12) - 3840x2160 - Ultra (99.9p) 43,4 ms
Testconfiguratie
  • Game benchmarks 2022

Geluidstest

Noise floor 14 dB(A)
Testconfiguratie
  • Geluidsdichte ruimte 2021
  • Larson Davis SoundAdvisor Model 831C
Afstand geluidsmeting 50 cm
Testconfiguratie
  • Geluidsdichte ruimte 2021
  • Larson Davis SoundAdvisor Model 831C
WebXPRT 3 - LAeq 14 dB
Testconfiguratie
  • Geluidsdichte ruimte 2021
  • Larson Davis SoundAdvisor Model 831C
PCMark 10 Express - LAeq 31 dB
Testconfiguratie
  • Geluidsdichte ruimte 2021
  • Larson Davis SoundAdvisor Model 831C
Blender - LAeq 36,8 dB
Testconfiguratie
  • Geluidsdichte ruimte 2021
  • Larson Davis SoundAdvisor Model 831C
F1 2020 - LAeq 38,9 dB
Testconfiguratie
  • Geluidsdichte ruimte 2021
  • Larson Davis SoundAdvisor Model 831C

PCMark 10 Storage

PCMark 10 - Gebruiken Adobe Photoshop Heavy 633
Testconfiguratie
  • Windows benchmarks
PCMark 10 - Storage - Totaalscore - Toegangstijd 94
Testconfiguratie
  • Windows benchmarks
PCMark 10 - Storage - Totaalscore - Bandbreedte 294,5
PCMark 10 - Storage - Totaalscore 1.812
Testconfiguratie
  • Windows benchmarks
PCMark 10 - 2.37GB_(399_JPEGs)_leestest 274
PCMark 10 - 2.37GB_(399_JPEGs)_kopieertest 410
Testconfiguratie
  • Windows benchmarks
PCMark 10 - 2.37GB_(399_JPEGs)_schrijftest 253
Testconfiguratie
  • Windows benchmarks
PCMark 10 - 2GB_(4_ISOs)_leestest 1.881
Testconfiguratie
  • Windows benchmarks
PCMark 10 - 2GB_(4_ISOs)_kopieertest 1.688
Testconfiguratie
  • Windows benchmarks
PCMark 10 - 2GB_(4_ISOs)_schrijftest 1.780
Testconfiguratie
  • Windows benchmarks
PCMark 10 - Gebruiken Microsoft PowerPoint 152
Testconfiguratie
  • Windows benchmarks
PCMark 10 - Gebruiken Microsoft Excel 103
Testconfiguratie
  • Windows benchmarks
PCMark 10 - Gebruiken Adobe Photoshop Light 195
Testconfiguratie
  • Windows benchmarks
PCMark 10 - Starten Windows 10 230
Testconfiguratie
  • Windows benchmarks
PCMark 10 - Gebruiken Adobe InDesign 183
Testconfiguratie
  • Windows benchmarks
PCMark 10 - Gebruiken Adobe Illustrator 132
PCMark 10 - Gebruiken Adobe After Effects 290
Testconfiguratie
  • Windows benchmarks
PCMark 10 - Starten Overwatch 313
Testconfiguratie
  • Windows benchmarks
PCMark 10 - Starten Call of Duty: Black Ops 4 619
Testconfiguratie
  • Windows benchmarks
PCMark 10 - Starten Battlefield V 732
Testconfiguratie
  • Windows benchmarks
PCMark 10 - Starten Adobe Photoshop 156
Testconfiguratie
  • Windows benchmarks
PCMark 10 - Starten Adobe Lightroom 108
Testconfiguratie
  • Windows benchmarks
PCMark 10 - Starten Adobe Premiere_Pro 171
Testconfiguratie
  • Windows benchmarks
PCMark 10 - Starten Adobe Illustrator 109
Testconfiguratie
  • Windows benchmarks
PCMark 10 - Starten Adobe After Effects 141
Testconfiguratie
  • Windows benchmarks
PCMark 10 - Starten Adobe Acrobat 187
Testconfiguratie
  • Windows benchmarks
PCMark 10 - Quick Storage - Totaalscore 1.513
Testconfiguratie
  • Windows benchmarks
PCMark 10 - Quick Storage - Totaalscore - Bandbreedte 187,63
Testconfiguratie
  • Windows benchmarks
PCMark 10 - Quick Storage - Totaalscore - Toegangstijd 86
Testconfiguratie
  • Windows benchmarks

Platform onafhankelijke tests

Opstarttijd 23 sec.
Testconfiguratie
  • Platform onafhankelijke tests
JetStream 2 204,394
Testconfiguratie
  • Platform onafhankelijke tests
webXPRT 3 294
Testconfiguratie
  • Platform onafhankelijke tests
webXPRT 3 - Photo Enhancement 223 ms
Testconfiguratie
  • Platform onafhankelijke tests
webXPRT 3 - Organize Album using AI 1.630 ms
Testconfiguratie
  • Platform onafhankelijke tests
webXPRT 3 - Stock Option Pricing 111 ms
Testconfiguratie
  • Platform onafhankelijke tests
webXPRT 3 - Encrypt Notes and OCR Scan 1.661 ms
Testconfiguratie
  • Platform onafhankelijke tests
webXPRT 3 - Sales Graphs 294 ms
Testconfiguratie
  • Platform onafhankelijke tests
webXPRT 3 - Online Homework 1.011 ms
Testconfiguratie
  • Platform onafhankelijke tests
Geekbench 5 - Multi 5.300
Testconfiguratie
  • Platform onafhankelijke tests
Geekbench 5 - Multi Crypto 6.085
Testconfiguratie
  • Platform onafhankelijke tests
Geekbench 5 - Multi Integer 5.008
Testconfiguratie
  • Platform onafhankelijke tests
Geekbench 5 - Multi Floating Point 5.802
Testconfiguratie
  • Platform onafhankelijke tests
Geekbench 5 - Single 1.601
Testconfiguratie
  • Platform onafhankelijke tests
Geekbench 5 - Single Crypto 4.039
Testconfiguratie
  • Platform onafhankelijke tests
Geekbench 5 - Single Integer 1.397
Testconfiguratie
  • Platform onafhankelijke tests
Geekbench 5 - Single Floating Point 1.636
Testconfiguratie
  • Platform onafhankelijke tests
Geekbench 5 - OpenCL 53.248
Testconfiguratie
  • Platform onafhankelijke tests
WiFi speedtest 2.4GHz receive 226 Mbit/s
Testconfiguratie
  • Platform onafhankelijke tests
WiFi speedtest 2.4GHz send 184 Mbit/s
Testconfiguratie
  • Platform onafhankelijke tests
WiFi speedtest 5.0GHz receive 642 Mbit/s
Testconfiguratie
  • Platform onafhankelijke tests
WiFi speedtest 5.0GHz send 557 Mbit/s
Testconfiguratie
  • Platform onafhankelijke tests

Windows benchmarks

3DMark - Fire Strike 9.264
Testconfiguratie
  • Windows benchmarks
3DMark - Fire Strike Graphics 10.461
Testconfiguratie
  • Windows benchmarks
3DMark - Fire Strike Physics 14.482
Testconfiguratie
  • Windows benchmarks
3DMark - Fire Strike Combined 3.863
Testconfiguratie
  • Windows benchmarks
3DMark - Fire Strike Extreme 4.823
Testconfiguratie
  • Windows benchmarks
3DMark - Time Spy 4.121
Testconfiguratie
  • Windows benchmarks
3DMark - Time Spy Graphics 4.008
Testconfiguratie
  • Windows benchmarks
3DMark - Time Spy CPU 4.910
Testconfiguratie
  • Windows benchmarks
3DMark - Night Raid 25.456
Testconfiguratie
  • Windows benchmarks
3DMark - Night Raid Graphics 35.285
Testconfiguratie
  • Windows benchmarks
3DMark - Night Raid CPU 9.873
Testconfiguratie
  • Windows benchmarks
Cinebench R15 - Single 233
Testconfiguratie
  • Windows benchmarks
Cinebench R15 - Multi 1.083
Testconfiguratie
  • Windows benchmarks
Cinebench R20 - Single 596
Testconfiguratie
  • Windows benchmarks
Cinebench R20 - Multi 2.611
Testconfiguratie
  • Windows benchmarks
Cinebench R23 - Single 1.555
Testconfiguratie
  • Windows benchmarks
Cinebench R23 - Multi 6.816
Testconfiguratie
  • Windows benchmarks
Blender duurtest run #1 39,18
Testconfiguratie
  • Windows benchmarks
Blender duurtest run #2 40,26
Testconfiguratie
  • Windows benchmarks
Blender duurtest run #3 43,99
Testconfiguratie
  • Windows benchmarks
Blender duurtest run #4 45,36
Testconfiguratie
  • Windows benchmarks
Blender duurtest run #5 45,64
Testconfiguratie
  • Windows benchmarks
Blender duurtest run #6 45,61
Testconfiguratie
  • Windows benchmarks
Blender duurtest run #7 45,52
Testconfiguratie
  • Windows benchmarks
Blender duurtest run #8 45,54
Testconfiguratie
  • Windows benchmarks
Blender duurtest run #9 45,65
Testconfiguratie
  • Windows benchmarks
Blender duurtest run #10 45,6
Testconfiguratie
  • Windows benchmarks
Blender duurtest run #11 45,63
Testconfiguratie
  • Windows benchmarks
Blender duurtest run #12 45,66
Testconfiguratie
  • Windows benchmarks
Blender duurtest run #13 45,66
Testconfiguratie
  • Windows benchmarks
Blender duurtest run #14 45,64
Testconfiguratie
  • Windows benchmarks
Blender duurtest run #15 45,71
Testconfiguratie
  • Windows benchmarks
Blender duurtest run #16 45,56
Testconfiguratie
  • Windows benchmarks
Blender duurtest run #17 45,7
Testconfiguratie
  • Windows benchmarks
Blender duurtest run #18 45,74
Testconfiguratie
  • Windows benchmarks
Blender duurtest run #19 45,76
Testconfiguratie
  • Windows benchmarks
Blender duurtest run #20 45,64
Testconfiguratie
  • Windows benchmarks
Blender duurtest run #21 45,85
Testconfiguratie
  • Windows benchmarks
Blender duurtest run #22 45,58
Testconfiguratie
  • Windows benchmarks
Blender duurtest run #23 45,73
Testconfiguratie
  • Windows benchmarks
Blender duurtest run #24 45,65
Testconfiguratie
  • Windows benchmarks
Blender duurtest run #25 45,6
Testconfiguratie
  • Windows benchmarks
Blender duurtest run #26 45,78
Testconfiguratie
  • Windows benchmarks
PCMark 10 Extended 6.231
Testconfiguratie
  • Windows benchmarks
PCMark 10 Essentials 9.282
Testconfiguratie
  • Windows benchmarks
PCMark 10 App Start-up 13.888
Testconfiguratie
  • Windows benchmarks
PCMark 10 Video Conferencing 7.029
Testconfiguratie
  • Windows benchmarks
PCMark 10 Web Browsing 8.193
Testconfiguratie
  • Windows benchmarks
PCMark 10 Productivity 9.089
Testconfiguratie
  • Windows benchmarks
PCMark 10 Spreadsheets 10.428
Testconfiguratie
  • Windows benchmarks
PCMark 10 Writing 7.923
Testconfiguratie
  • Windows benchmarks
PCMark 10 Digital Content Creation 6.359
Testconfiguratie
  • Windows benchmarks
PCMark 10 Photo Editing 7.493
Testconfiguratie
  • Windows benchmarks
PCMark 10 Rendering and Visualization 6.627
Testconfiguratie
  • Windows benchmarks
PCMark 10 Video Editing 5.179
Testconfiguratie
  • Windows benchmarks
PCMark 10 Gaming 7.595
Testconfiguratie
  • Windows benchmarks
PCMark 10 Graphics 10.359
Testconfiguratie
  • Windows benchmarks
PCMark 10 Physics 13.818
Testconfiguratie
  • Windows benchmarks
PCMark 10 Combined 3.767
Testconfiguratie
  • Windows benchmarks

Energieverbruik / Accu

Energieverbruik uit 0,2 W
Testconfiguratie
  • Windows benchmarks
Energieverbruik adapter (zonder laptop) 0 W
Testconfiguratie
  • Windows benchmarks
Energieverbruik idle 16,2 W
Testconfiguratie
  • Windows benchmarks
Browser accutest - 180 cd/m2 487 min.
Testconfiguratie
  • Windows benchmarks
PCMark 10 Accu Digital 3.214
Testconfiguratie
  • Windows benchmarks
PCMark 10 Accu Essentials 5.778
Testconfiguratie
  • Windows benchmarks
PCMark 10 Accu Productivity 5.605
Testconfiguratie
  • Windows benchmarks
PCMark 10 Accu Duration in Minuten 132
Testconfiguratie
  • Windows benchmarks
PCMark 10 Accu Aantal Runs 4
Testconfiguratie
  • Windows benchmarks

Testresultaten beeldscherm

Gemeten kleurruimte sRGB
Testconfiguratie
  • Beeldscherm test SpectraCal CALman 5.13
Kleurtemperatuur 6.869 K
Testconfiguratie
  • Beeldscherm test SpectraCal CALman 5.13
Helderheid wit 385 cd/m²
Testconfiguratie
  • Beeldscherm test SpectraCal CALman 5.13
Helderheid zwart 0,00 cd/m²
Testconfiguratie
  • Beeldscherm test SpectraCal CALman 5.13
Checkerboard wit 387,3 cd/m²
Testconfiguratie
  • Beeldscherm test SpectraCal CALman 5.13
Checkerboard zwart 0 cd/m²
Testconfiguratie
  • Beeldscherm test SpectraCal CALman 5.13
Gamma 2,09
Testconfiguratie
  • Beeldscherm test SpectraCal CALman 5.13
Gamma (afwijking van 2,2) 0,11
Testconfiguratie
  • Beeldscherm test SpectraCal CALman 5.13
Kleurafwijking rood (Delta E 1994) 2,71
Testconfiguratie
  • Beeldscherm test SpectraCal CALman 5 i.c.m. X
  • Rite i1 Display Pro colorimeter
Kleurafwijking groen (Delta E 1994) 2,91
Testconfiguratie
  • Beeldscherm test SpectraCal CALman 5 i.c.m. X
  • Rite i1 Display Pro colorimeter
Kleurafwijking blauw (Delta E 1994) 3,13
Testconfiguratie
  • Beeldscherm test SpectraCal CALman 5 i.c.m. X
  • Rite i1 Display Pro colorimeter
Kleurafwijking cyaan (Delta E 1994) 2,78
Testconfiguratie
  • Beeldscherm test SpectraCal CALman 5 i.c.m. X
  • Rite i1 Display Pro colorimeter
Kleurafwijking magenta (Delta E 1994) 1,18
Testconfiguratie
  • Beeldscherm test SpectraCal CALman 5 i.c.m. X
  • Rite i1 Display Pro colorimeter
Kleurafwijking geel (Delta E 1994) 1,05
Testconfiguratie
  • Beeldscherm test SpectraCal CALman 5 i.c.m. X
  • Rite i1 Display Pro colorimeter
Gemiddelde kleurafwijking (Delta E 1994) 2,3
Testconfiguratie
  • Beeldscherm test SpectraCal CALman 5 i.c.m. X
  • Rite i1 Display Pro colorimeter
Gemiddelde grijsafwijking (Delta E 1994) 3,9
Testconfiguratie
  • Beeldscherm test SpectraCal CALman 5 i.c.m. X
  • Rite i1 Display Pro colorimeter
Kleurafwijking 75% wit (Delta E 2000) 3,22 mΔuv
Testconfiguratie
  • Beeldscherm test SpectraCal CALman 5 i.c.m. X
  • Rite i1 Display Pro colorimeter
Kleurafwijking 75% rood (Delta E 2000) 2,58 mΔuv
Testconfiguratie
  • Beeldscherm test SpectraCal CALman 5 i.c.m. X
  • Rite i1 Display Pro colorimeter
Kleurafwijking 75% groen (Delta E 2000) 2,41 mΔuv
Testconfiguratie
  • Beeldscherm test SpectraCal CALman 5 i.c.m. X
  • Rite i1 Display Pro colorimeter
Kleurafwijking 75% blauw (Delta E 2000) 2,6 mΔuv
Testconfiguratie
  • Beeldscherm test SpectraCal CALman 5 i.c.m. X
  • Rite i1 Display Pro colorimeter
Kleurafwijking 75% cyaan (Delta E 2000) 2,65 mΔuv
Testconfiguratie
  • Beeldscherm test SpectraCal CALman 5 i.c.m. X
  • Rite i1 Display Pro colorimeter
Kleurafwijking 75% magenta (Delta E 2000) 1,15 mΔuv
Testconfiguratie
  • Beeldscherm test SpectraCal CALman 5 i.c.m. X
  • Rite i1 Display Pro colorimeter
Kleurafwijking 75% geel (Delta E 2000) 0,91 mΔuv
Testconfiguratie
  • Beeldscherm test SpectraCal CALman 5 i.c.m. X
  • Rite i1 Display Pro colorimeter
Gemiddelde kleurafwijking (Delta E 2000) 2,3 mΔuv
Testconfiguratie
  • Beeldscherm test SpectraCal CALman 5.13
Kleurafwijking 100% wit (Delta E 2000) 2,96 mΔuv
Testconfiguratie
  • Beeldscherm test SpectraCal CALman 5 i.c.m. X
  • Rite i1 Display Pro colorimeter
Gemiddelde kleurafwijking excl. wit (Delta E 2000) 2,1
Testconfiguratie
  • Beeldscherm test SpectraCal CALman 5 i.c.m. X
  • Rite i1 Display Pro colorimeter
Gemiddelde grijsafwijking (Delta E 2000) 3,4 mΔuv
Testconfiguratie
  • Beeldscherm test SpectraCal CALman 5.13
sRGB dekking 97,6 %
Testconfiguratie
  • Beeldscherm test SpectraCal CALman 5.13
DCI-P3 dekking 77,3 %
Testconfiguratie
  • Beeldscherm test SpectraCal CALman 5.13
Rec 2020 dekking 55,8 %
Testconfiguratie
  • Beeldscherm test SpectraCal CALman 5.13

Reviews

Alternatieven

HP Pavilion Gaming 15-ec2747nd (4P6K4EA)

  • AMD Ryzen 5 5600H
  • 16 GB
  • 15.6 inch
  • 1920x1080
  • Nvidia GeForce RTX 3050
  • 512 GB
  • Qwerty
  • 2.09 kg
  • Windows
 

Asus RoG Zephyrus Duo 16 GX650RX-LO080W

  • AMD Ryzen 9 6980HX
  • 32 GB
  • 16 inch
  • 2560x1600
  • Touchscreen
  • Nvidia GeForce RTX 3080 Max-P Design
  • 2048 GB
  • Qwerty
  • 2.60 kg
  • Windows
 

Asus RoG Zephyrus G14 GA402RK-L8032X

  • AMD Ryzen 9 6900HS
  • 32 GB
  • 14 inch
  • 2560x1600
  • AMD Radeon RX 6800S
  • 1024 GB
  • Qwerty
  • 1.7 kg
 

Asus Zenbook Pro 14 OLED UX6404VV-P4046W

  • Intel Core i9 13900H
  • 32 GB
  • 14.5 inch
  • 2880x1800
  • Nvidia GeForce RTX 4060 Laptop GPU
  • 1024 GB
  • Qwerty
  • 1.61 kg
  • Windows
 

MSI Stealth GS77 12UHS-032NL

  • Intel Core i9 12900H
  • 64 GB
  • 17.3 inch
  • 3840x2160
  • Nvidia GeForce RTX 3080 Ti
  • 2048 GB
  • Qwerty
  • 2.91 kg
  • Windows Pro
 

Alienware x17 P48E002

  • Intel Core i7 12700H
  • 32 GB
  • 17.3 inch
  • 1920x1080
  • Nvidia GeForce RTX 3080 Max-Q Design
  • 1024 GB
  • Qwerty
  • 3.05 kg
  • Windows
 

Asus Asus RoG Strix Scar G733C

  • Intel Core i9 12950HX
  • 32 GB
  • 17.3 inch
  • Nvidia GeForce RTX 3080 Ti
  • 4096 GB
  • Qwerty
  • Windows
 

Asus TUF Gaming A15 FA507NV-LP066W

  • AMD Ryzen 7 7735HS
  • 16 GB
  • 15.6 inch
  • 1920x1080
  • Nvidia GeForce RTX 4060 Laptop GPU
  • 512 GB
  • Qwerty
  • 2.1 kg
  • Windows
 

Lenovo Legion 5 Pro (82RF0009US)

  • Intel Core i7 12700H
  • 16 GB
  • 16 inch
  • 2560x1600
  • Nvidia GeForce RTX 3060
  • 2048 GB
  • Qwerty
  • 2.55 kg
  • Windows
 

HP Omen 16-b1890nd (6G8B0EA)

  • Intel Core i7 12700H
  • 16 GB
  • 16.1 inch
  • 2560x1440
  • Nvidia GeForce RTX 3070
  • 1024 GB
  • Qwerty
  • 2.285 kg
  • Windows
 

Gigabyte Aero 5 KE4-72EE614SH

  • Intel Core i7 12700H
  • 16 GB
  • 15.6 inch
  • 3840x2160
  • Nvidia GeForce RTX 3060
  • 1024 GB
  • Qwerty
  • 2.28 kg
  • Windows
 
0