Getest

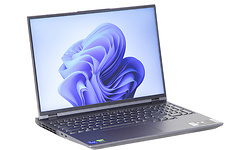
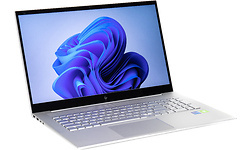
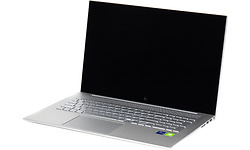
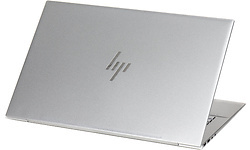
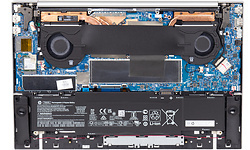
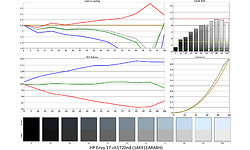
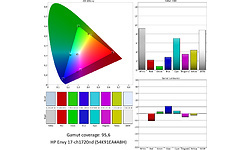
HP Envy 17-ch1720nd (54K91EA)

Prijsverloop

Dit product is niet (meer) verkrijgbaar bij de bij Hardware Info aangesloten shops.

Specificaties

Belangrijkste specificaties

Processor type Intel Core i7 1195G7
Geheugen capaciteit 16 GB
Scherm diagonaal 17,3 inch
Resolutie 1920x1080
Touchscreen
GPU type Nvidia GeForce MX450
Totale opslagcapaciteit 512 GB
Toetsenbordindeling Qwerty
Gewicht totaal 2,49 kg
Besturingssysteem (serie) Windows

Processor / Chipset / Geheugen

Processor serie Intel Core i7
Processor type Intel Core i7 1195G7
Processor klokfrequentie 2,9 GHz
Processor klokfrequentie (max. turbo) 5 GHz
Aantal processorcores 4
Geheugen capaciteit 16 GB
Type geheugen DDR4
Geheugen klokfrequentie 3.200 MHz
Geheugen form factor On-board
SODIMM sloten 0
Vrije SODIMM sloten 0
Werkgeheugen uitbreidbaar tot 16 GB

Scherm

Scherm diagonaal 17,3 inch
Resolutie 1920x1080
Verhouding 16:9
Pixeldichtheid 127 ppi
Scherm type (mat/glans) Glanzend
Paneeltype IPS
Touchscreen
Maximale verversingsfrequentie 60 Hz

Graphics

GPU type Nvidia GeForce MX450
Geïntegreerde / losse GPU Losse chip
Videogeheugen 2 GB

Opslag

Totale opslagcapaciteit 512 GB
SSD opslagcapaciteit 512 GB
Beschikbaar opslaggeheugen 425,3 GB
Aantal harddisks / SSD's 1
Harddisk/SSD 1 capaciteit 512 GB
Harddisk/SSD 1 soort SSD/Flash
Harddisk/SSD 1 form factor M.2
Harddisk/SSD 1 merk/product Intel SSDPEKNU512GZ
DVD branden
Blu-ray lezen
Blu-ray branden

Connectiviteit / Netwerk

Netwerkaansluiting (bedraad)
WiFi standaard 802.11ax (Wi-Fi 6)
WiFi adapter Realtek RTL8852AE WiFi 6 802.11ax PCIe Adapter
Bluetooth
Bluetooth-versie Bluetooth 5.2
4G (LTE)
5G

Aansluitingen

Smartcard
USB 3.2 - 5 Gb/s (Type-A) 3
USB 3.2 - 5 Gb/s (Type-C) 1
Cardreader - SD
Cardreader - MicroSD
DVI-uitgang
VGA-uitgang
HDMI-uitgang
Aantal HDMI-uitgangen 1
Micro HDMI-uitgang
HDMI-versie 2.0b
DisplayPort-uitgang
Mini DisplayPort-uitgang
Analoge audio aansluitingen 1
Aansluiting dockingstation
Kensingtonslot

Toetsenbord en touchpad

Toetsenbordindeling Qwerty
Numeriek toetsenbord
Toetsenbordverlichting helderheidsniveaus 3
Toetsenbordverlichting kleur Wit
Touchpad MS Precision compatible
Touchpad afzonderlijke muistoetsen

Camera

Webcam
Webcam resolutie 0,9 MPixel
Tweede camera
Flitser
Camera Windows Hello compatible
Webcamschuifje

Sensors

Accelerometer
Vingerafdruklezer
NFC

Overige hardware

Geïntegreerde microfoon

Maten en gewichten

Accu capaciteit (Wh) 55 Wh
Verwisselbare accu
Gewicht totaal 2,49 kg
Afmeting - Breedte 39,7 cm
Afmeting - Diepte 25,9 cm
Afmeting - Hoogte/Dikte 2,2 cm
Passief gekoeld

Software

Besturingssysteem Microsoft Windows 11 Home
Besturingssysteem (serie) Windows
Windows versie 21H1
Windows OS Build 22.000,556
Aantal bits OS 64 bit

Fabrikantsopgave eigenschappen

Garantie 2 jaar

Productcodes

SKU 54K91EA#ABH
EAN 0196337050877
Toegevoegd aan Hardware Info maandag 10 januari 2022

Testresultaten

Dit product is door Hardware Info getest op maandag 28 maart 2022.

Metro Exodus

Metro Exodus - 1920x1080 - Medium 23,5 fps
Testconfiguratie
  • Game benchmarks 2022
Metro Exodus - 1920x1080 - Medium (99p) 78,56 ms
Testconfiguratie
  • Game benchmarks 2022
Metro Exodus - 1920x1080 - Medium (99.9p) 280,72 ms
Testconfiguratie
  • Game benchmarks 2022
Metro Exodus - 1920x1080 - Ultra 12,6 fps
Testconfiguratie
  • Game benchmarks 2022
Metro Exodus - 1920x1080 - Ultra (99p) 134,31 ms
Testconfiguratie
  • Game benchmarks 2022
Metro Exodus - 1920x1080 - Ultra (99.9p) 155,07 ms
Testconfiguratie
  • Game benchmarks 2022
Metro Exodus - 2560x1440 - Medium 11,6 fps
Testconfiguratie
  • Game benchmarks 2022
Metro Exodus - 2560x1440 - Medium (99p) 182,11 ms
Testconfiguratie
  • Game benchmarks 2022
Metro Exodus - 2560x1440 - Medium (99.9p) 221,6 ms
Testconfiguratie
  • Game benchmarks 2022
Metro Exodus - 2560x1440 - Ultra 2 fps
Testconfiguratie
  • Game benchmarks 2022
Metro Exodus - 2560x1440 - Ultra (99p) 939,82 ms
Testconfiguratie
  • Game benchmarks 2022
Metro Exodus - 2560x1440 - Ultra (99.9p) 0 ms
Testconfiguratie
  • Game benchmarks 2022

Total War: Troy

Total War: Troy - 1920x1080 - Medium 56,9 fps
Testconfiguratie
  • Game benchmarks 2022
Total War: Troy - 1920x1080 - Medium (99p) 21,1 ms
Testconfiguratie
  • Game benchmarks 2022
Total War: Troy - 1920x1080 - Medium (99.9p) 110,58 ms
Testconfiguratie
  • Game benchmarks 2022
Total War: Troy - 1920x1080 - Ultra 28,3 fps
Testconfiguratie
  • Game benchmarks 2022
Total War: Troy - 1920x1080 - Ultra (99p) 42,45 ms
Testconfiguratie
  • Game benchmarks 2022
Total War: Troy - 1920x1080 - Ultra (99.9p) 46,28 ms
Testconfiguratie
  • Game benchmarks 2022
Total War: Troy - 2560x1440 - Medium 39,4 fps
Testconfiguratie
  • Game benchmarks 2022
Total War: Troy - 2560x1440 - Medium (99p) 29,83 ms
Testconfiguratie
  • Game benchmarks 2022
Total War: Troy - 2560x1440 - Medium (99.9p) 31,17 ms
Testconfiguratie
  • Game benchmarks 2022
Total War: Troy - 2560x1440 - Ultra 19,6 fps
Testconfiguratie
  • Game benchmarks 2022
Total War: Troy - 2560x1440 - Ultra (99p) 61,65 ms
Testconfiguratie
  • Game benchmarks 2022
Total War: Troy - 2560x1440 - Ultra (99.9p) 116,5 ms
Testconfiguratie
  • Game benchmarks 2022

Far Cry: New Dawn

Far Cry: New Dawn - 1920x1080 - Medium 42,7 fps
Testconfiguratie
  • Game benchmarks 2022
Far Cry: New Dawn - 1920x1080 - Medium (99p) 35,55 ms
Testconfiguratie
  • Game benchmarks 2022
Far Cry: New Dawn - 1920x1080 - Medium (99.9p) 128,05 ms
Testconfiguratie
  • Game benchmarks 2022
Far Cry: New Dawn - 1920x1080 - Ultra 32,7 fps
Testconfiguratie
  • Game benchmarks 2022
Far Cry: New Dawn - 1920x1080 - Ultra (99p) 42,26 ms
Testconfiguratie
  • Game benchmarks 2022
Far Cry: New Dawn - 1920x1080 - Ultra (99.9p) 64,12 ms
Testconfiguratie
  • Game benchmarks 2022
Far Cry: New Dawn - 2560x1440 - Medium 28,2 fps
Testconfiguratie
  • Game benchmarks 2022
Far Cry: New Dawn - 2560x1440 - Medium (99p) 44,29 ms
Testconfiguratie
  • Game benchmarks 2022
Far Cry: New Dawn - 2560x1440 - Medium (99.9p) 60,44 ms
Testconfiguratie
  • Game benchmarks 2022
Far Cry: New Dawn - 2560x1440 - Ultra 21,9 fps
Testconfiguratie
  • Game benchmarks 2022
Far Cry: New Dawn - 2560x1440 - Ultra (99p) 71,83 ms
Testconfiguratie
  • Game benchmarks 2022
Far Cry: New Dawn - 2560x1440 - Ultra (99.9p) 124,61 ms
Testconfiguratie
  • Game benchmarks 2022

F1 2020

F1 2020 (DX12) - 1920x1080 - Medium 70,1 fps
Testconfiguratie
  • Game benchmarks 2022
F1 2020 (DX12) - 1920x1080 - Medium (99p) 17,1 ms
Testconfiguratie
  • Game benchmarks 2022
F1 2020 (DX12) - 1920x1080 - Medium (99.9p) 19,2 ms
Testconfiguratie
  • Game benchmarks 2022
F1 2020 (DX12) - 1920x1080 - Ultra 38,2 fps
Testconfiguratie
  • Game benchmarks 2022
F1 2020 (DX12) - 1920x1080 - Ultra (99p) 31,8 ms
Testconfiguratie
  • Game benchmarks 2022
F1 2020 (DX12) - 1920x1080 - Ultra (99.9p) 36,2 ms
Testconfiguratie
  • Game benchmarks 2022
F1 2020 (DX12) - 2560x1440 - Medium 46,1 fps
Testconfiguratie
  • Game benchmarks 2022
F1 2020 (DX12) - 2560x1440 - Medium (99p) 26,1 ms
Testconfiguratie
  • Game benchmarks 2022
F1 2020 (DX12) - 2560x1440 - Medium (99.9p) 49,4 ms
Testconfiguratie
  • Game benchmarks 2022
F1 2020 (DX12) - 2560x1440 - Ultra 26,1 fps
Testconfiguratie
  • Game benchmarks 2022
F1 2020 (DX12) - 2560x1440 - Ultra (99p) 49,4 ms
Testconfiguratie
  • Game benchmarks 2022
F1 2020 (DX12) - 2560x1440 - Ultra (99.9p) 52,8 ms
Testconfiguratie
  • Game benchmarks 2022
F1 2020 (DX12) - 3840x2160 - Medium 23,6 fps
Testconfiguratie
  • Game benchmarks 2022
F1 2020 (DX12) - 3840x2160 - Medium (99p) 50 ms
Testconfiguratie
  • Game benchmarks 2022
F1 2020 (DX12) - 3840x2160 - Medium (99.9p) 53,8 ms
Testconfiguratie
  • Game benchmarks 2022
F1 2020 (DX12) - 3840x2160 - Ultra 11,8 fps
Testconfiguratie
  • Game benchmarks 2022
F1 2020 (DX12) - 3840x2160 - Ultra (99p) 121 ms
Testconfiguratie
  • Game benchmarks 2022
F1 2020 (DX12) - 3840x2160 - Ultra (99.9p) 131,3 ms
Testconfiguratie
  • Game benchmarks 2022

Geluidstest

Noise floor 14 dB(A)
Testconfiguratie
  • Geluidsdichte ruimte 2021
  • Larson Davis SoundAdvisor Model 831C
Afstand geluidsmeting 50 cm
Testconfiguratie
  • Geluidsdichte ruimte 2021
  • Larson Davis SoundAdvisor Model 831C
WebXPRT 3 - LAeq 18,1 dB
Testconfiguratie
  • Geluidsdichte ruimte 2021
  • Larson Davis SoundAdvisor Model 831C
PCMark 10 Express - LAeq 25,8 dB
Testconfiguratie
  • Geluidsdichte ruimte 2021
  • Larson Davis SoundAdvisor Model 831C
Blender - LAeq 32,4 dB
Testconfiguratie
  • Geluidsdichte ruimte 2021
  • Larson Davis SoundAdvisor Model 831C
F1 2020 - LAeq 37,5 dB
Testconfiguratie
  • Geluidsdichte ruimte 2021
  • Larson Davis SoundAdvisor Model 831C

PCMark 10 Storage

PCMark 10 - Gebruiken Adobe Photoshop Heavy 592
Testconfiguratie
  • Windows benchmarks
PCMark 10 - Storage - Totaalscore - Toegangstijd 92
Testconfiguratie
  • Windows benchmarks
PCMark 10 - Storage - Totaalscore - Bandbreedte 292,74
PCMark 10 - Storage - Totaalscore 1.826
Testconfiguratie
  • Windows benchmarks
PCMark 10 - 2.37GB_(399_JPEGs)_leestest 347
PCMark 10 - 2.37GB_(399_JPEGs)_kopieertest 464
Testconfiguratie
  • Windows benchmarks
PCMark 10 - 2.37GB_(399_JPEGs)_schrijftest 295
Testconfiguratie
  • Windows benchmarks
PCMark 10 - 2GB_(4_ISOs)_leestest 1.644
Testconfiguratie
  • Windows benchmarks
PCMark 10 - 2GB_(4_ISOs)_kopieertest 1.254
Testconfiguratie
  • Windows benchmarks
PCMark 10 - 2GB_(4_ISOs)_schrijftest 1.475
Testconfiguratie
  • Windows benchmarks
PCMark 10 - Gebruiken Microsoft PowerPoint 126
Testconfiguratie
  • Windows benchmarks
PCMark 10 - Gebruiken Microsoft Excel 120
Testconfiguratie
  • Windows benchmarks
PCMark 10 - Gebruiken Adobe Photoshop Light 218
Testconfiguratie
  • Windows benchmarks
PCMark 10 - Starten Windows 10 268
Testconfiguratie
  • Windows benchmarks
PCMark 10 - Gebruiken Adobe InDesign 148
Testconfiguratie
  • Windows benchmarks
PCMark 10 - Gebruiken Adobe Illustrator 151
PCMark 10 - Gebruiken Adobe After Effects 326
Testconfiguratie
  • Windows benchmarks
PCMark 10 - Starten Overwatch 277
Testconfiguratie
  • Windows benchmarks
PCMark 10 - Starten Call of Duty: Black Ops 4 576
Testconfiguratie
  • Windows benchmarks
PCMark 10 - Starten Battlefield V 589
Testconfiguratie
  • Windows benchmarks
PCMark 10 - Starten Adobe Photoshop 157
Testconfiguratie
  • Windows benchmarks
PCMark 10 - Starten Adobe Lightroom 130
Testconfiguratie
  • Windows benchmarks
PCMark 10 - Starten Adobe Premiere_Pro 180
Testconfiguratie
  • Windows benchmarks
PCMark 10 - Starten Adobe Illustrator 120
Testconfiguratie
  • Windows benchmarks
PCMark 10 - Starten Adobe After Effects 158
Testconfiguratie
  • Windows benchmarks
PCMark 10 - Starten Adobe Acrobat 140
Testconfiguratie
  • Windows benchmarks
PCMark 10 - Quick Storage - Totaalscore 2.017
Testconfiguratie
  • Windows benchmarks
PCMark 10 - Quick Storage - Totaalscore - Bandbreedte 248,3
Testconfiguratie
  • Windows benchmarks
PCMark 10 - Quick Storage - Totaalscore - Toegangstijd 64
Testconfiguratie
  • Windows benchmarks

Platform onafhankelijke tests

Opstarttijd 26 sec.
Testconfiguratie
  • Platform onafhankelijke tests
JetStream 2 219,245
Testconfiguratie
  • Platform onafhankelijke tests
webXPRT 3 311
Testconfiguratie
  • Platform onafhankelijke tests
webXPRT 3 - Photo Enhancement 232 ms
Testconfiguratie
  • Platform onafhankelijke tests
webXPRT 3 - Organize Album using AI 1.630 ms
Testconfiguratie
  • Platform onafhankelijke tests
webXPRT 3 - Stock Option Pricing 99 ms
Testconfiguratie
  • Platform onafhankelijke tests
webXPRT 3 - Encrypt Notes and OCR Scan 1.472 ms
Testconfiguratie
  • Platform onafhankelijke tests
webXPRT 3 - Sales Graphs 288 ms
Testconfiguratie
  • Platform onafhankelijke tests
webXPRT 3 - Online Homework 889 ms
Testconfiguratie
  • Platform onafhankelijke tests
Geekbench 5 - Multi 5.504
Testconfiguratie
  • Platform onafhankelijke tests
Geekbench 5 - Multi Crypto 6.967
Testconfiguratie
  • Platform onafhankelijke tests
Geekbench 5 - Multi Integer 5.244
Testconfiguratie
  • Platform onafhankelijke tests
Geekbench 5 - Multi Floating Point 5.825
Testconfiguratie
  • Platform onafhankelijke tests
Geekbench 5 - Single 1.639
Testconfiguratie
  • Platform onafhankelijke tests
Geekbench 5 - Single Crypto 4.125
Testconfiguratie
  • Platform onafhankelijke tests
Geekbench 5 - Single Integer 1.427
Testconfiguratie
  • Platform onafhankelijke tests
Geekbench 5 - Single Floating Point 1.685
Testconfiguratie
  • Platform onafhankelijke tests
Geekbench 5 - OpenCL 32.569
Testconfiguratie
  • Platform onafhankelijke tests
WiFi speedtest 2.4GHz receive 212 Mbit/s
Testconfiguratie
  • Platform onafhankelijke tests
WiFi speedtest 2.4GHz send 208 Mbit/s
Testconfiguratie
  • Platform onafhankelijke tests
WiFi speedtest 5.0GHz receive 642 Mbit/s
Testconfiguratie
  • Platform onafhankelijke tests
WiFi speedtest 5.0GHz send 651 Mbit/s
Testconfiguratie
  • Platform onafhankelijke tests

Windows benchmarks

3DMark - Fire Strike 4.922
Testconfiguratie
  • Windows benchmarks
3DMark - Fire Strike Graphics 5.291
Testconfiguratie
  • Windows benchmarks
3DMark - Fire Strike Physics 13.023
Testconfiguratie
  • Windows benchmarks
3DMark - Fire Strike Combined 2.005
Testconfiguratie
  • Windows benchmarks
3DMark - Time Spy 2.306
Testconfiguratie
  • Windows benchmarks
3DMark - Time Spy Graphics 2.130
Testconfiguratie
  • Windows benchmarks
3DMark - Time Spy CPU 4.357
Testconfiguratie
  • Windows benchmarks
3DMark - Night Raid 20.096
Testconfiguratie
  • Windows benchmarks
3DMark - Night Raid Graphics 28.260
Testconfiguratie
  • Windows benchmarks
3DMark - Night Raid CPU 7.621
Testconfiguratie
  • Windows benchmarks
Cinebench R15 - Single 227
Testconfiguratie
  • Windows benchmarks
Cinebench R15 - Multi 912
Testconfiguratie
  • Windows benchmarks
Cinebench R20 - Single 597
Testconfiguratie
  • Windows benchmarks
Cinebench R20 - Multi 2.229
Testconfiguratie
  • Windows benchmarks
Cinebench R23 - Single 1.570
Testconfiguratie
  • Windows benchmarks
Cinebench R23 - Multi 5.802
Testconfiguratie
  • Windows benchmarks
Blender duurtest run #1 43,81
Testconfiguratie
  • Windows benchmarks
Blender duurtest run #2 47,3
Testconfiguratie
  • Windows benchmarks
Blender duurtest run #3 47,61
Testconfiguratie
  • Windows benchmarks
Blender duurtest run #4 48,27
Testconfiguratie
  • Windows benchmarks
Blender duurtest run #5 48,24
Testconfiguratie
  • Windows benchmarks
Blender duurtest run #6 48,19
Testconfiguratie
  • Windows benchmarks
Blender duurtest run #7 48,29
Testconfiguratie
  • Windows benchmarks
Blender duurtest run #8 48,03
Testconfiguratie
  • Windows benchmarks
Blender duurtest run #9 48,1
Testconfiguratie
  • Windows benchmarks
Blender duurtest run #10 48,11
Testconfiguratie
  • Windows benchmarks
Blender duurtest run #11 48,31
Testconfiguratie
  • Windows benchmarks
Blender duurtest run #12 48,07
Testconfiguratie
  • Windows benchmarks
Blender duurtest run #13 48,18
Testconfiguratie
  • Windows benchmarks
Blender duurtest run #14 48,12
Testconfiguratie
  • Windows benchmarks
Blender duurtest run #15 48,2
Testconfiguratie
  • Windows benchmarks
Blender duurtest run #16 48,21
Testconfiguratie
  • Windows benchmarks
Blender duurtest run #17 48,14
Testconfiguratie
  • Windows benchmarks
Blender duurtest run #18 48,2
Testconfiguratie
  • Windows benchmarks
Blender duurtest run #19 48,21
Testconfiguratie
  • Windows benchmarks
Blender duurtest run #20 48,16
Testconfiguratie
  • Windows benchmarks
Blender duurtest run #21 48,08
Testconfiguratie
  • Windows benchmarks
Blender duurtest run #22 48,21
Testconfiguratie
  • Windows benchmarks
Blender duurtest run #23 48,42
Testconfiguratie
  • Windows benchmarks
Blender duurtest run #24 48,13
Testconfiguratie
  • Windows benchmarks
Blender duurtest run #25 48,23
Testconfiguratie
  • Windows benchmarks
PCMark 10 Extended 4.644
Testconfiguratie
  • Windows benchmarks
PCMark 10 Essentials 7.606
Testconfiguratie
  • Windows benchmarks
PCMark 10 App Start-up 6.921
Testconfiguratie
  • Windows benchmarks
PCMark 10 Video Conferencing 7.042
Testconfiguratie
  • Windows benchmarks
PCMark 10 Web Browsing 9.029
Testconfiguratie
  • Windows benchmarks
PCMark 10 Productivity 8.900
Testconfiguratie
  • Windows benchmarks
PCMark 10 Spreadsheets 9.914
Testconfiguratie
  • Windows benchmarks
PCMark 10 Writing 7.991
Testconfiguratie
  • Windows benchmarks
PCMark 10 Digital Content Creation 4.853
Testconfiguratie
  • Windows benchmarks
PCMark 10 Photo Editing 5.169
Testconfiguratie
  • Windows benchmarks
PCMark 10 Rendering and Visualization 4.665
Testconfiguratie
  • Windows benchmarks
PCMark 10 Video Editing 4.740
Testconfiguratie
  • Windows benchmarks
PCMark 10 Gaming 3.828
Testconfiguratie
  • Windows benchmarks
PCMark 10 Graphics 4.936
Testconfiguratie
  • Windows benchmarks
PCMark 10 Physics 9.732
Testconfiguratie
  • Windows benchmarks
PCMark 10 Combined 1.981
Testconfiguratie
  • Windows benchmarks

Energieverbruik / Accu

Energieverbruik uit 0,3 W
Testconfiguratie
  • Windows benchmarks
Energieverbruik adapter (zonder laptop) 0 W
Testconfiguratie
  • Windows benchmarks
Energieverbruik idle 7,9 W
Testconfiguratie
  • Windows benchmarks
Browser accutest - 180 cd/m2 462 min.
Testconfiguratie
  • Windows benchmarks
PCMark 10 Accu Digital 3.276
Testconfiguratie
  • Windows benchmarks
PCMark 10 Accu Essentials 5.941
Testconfiguratie
  • Windows benchmarks
PCMark 10 Accu Productivity 7.410
Testconfiguratie
  • Windows benchmarks
PCMark 10 Accu Duration in Minuten 143
Testconfiguratie
  • Windows benchmarks
PCMark 10 Accu Aantal Runs 5
Testconfiguratie
  • Windows benchmarks

Testresultaten beeldscherm

Gemeten kleurruimte sRGB
Testconfiguratie
  • Beeldscherm test SpectraCal CALman 5.13
Kleurtemperatuur 7.618 K
Testconfiguratie
  • Beeldscherm test SpectraCal CALman 5.13
Helderheid wit 319 cd/m²
Testconfiguratie
  • Beeldscherm test SpectraCal CALman 5.13
Helderheid zwart 0,35 cd/m²
Testconfiguratie
  • Beeldscherm test SpectraCal CALman 5.13
Contrast 910,3 : 1
Testconfiguratie
  • Beeldscherm test SpectraCal CALman 5.13
Checkerboard wit 320,302 cd/m²
Testconfiguratie
  • Beeldscherm test SpectraCal CALman 5.13
Checkerboard zwart 0,348 cd/m²
Testconfiguratie
  • Beeldscherm test SpectraCal CALman 5.13
Checkerboard contrast 920 : 1
Testconfiguratie
  • Beeldscherm test SpectraCal CALman 5.13
Gamma 1,92
Testconfiguratie
  • Beeldscherm test SpectraCal CALman 5.13
Gamma (afwijking van 2,2) 0,28
Testconfiguratie
  • Beeldscherm test SpectraCal CALman 5.13
Kleurafwijking rood (Delta E 1994) 2,18
Testconfiguratie
  • Beeldscherm test SpectraCal CALman 5 i.c.m. X
  • Rite i1 Display Pro colorimeter
Kleurafwijking groen (Delta E 1994) 1,13
Testconfiguratie
  • Beeldscherm test SpectraCal CALman 5 i.c.m. X
  • Rite i1 Display Pro colorimeter
Kleurafwijking blauw (Delta E 1994) 2,53
Testconfiguratie
  • Beeldscherm test SpectraCal CALman 5 i.c.m. X
  • Rite i1 Display Pro colorimeter
Kleurafwijking cyaan (Delta E 1994) 5,75
Testconfiguratie
  • Beeldscherm test SpectraCal CALman 5 i.c.m. X
  • Rite i1 Display Pro colorimeter
Kleurafwijking magenta (Delta E 1994) 3,37
Testconfiguratie
  • Beeldscherm test SpectraCal CALman 5 i.c.m. X
  • Rite i1 Display Pro colorimeter
Kleurafwijking geel (Delta E 1994) 3,85
Testconfiguratie
  • Beeldscherm test SpectraCal CALman 5 i.c.m. X
  • Rite i1 Display Pro colorimeter
Gemiddelde kleurafwijking (Delta E 1994) 3,1
Testconfiguratie
  • Beeldscherm test SpectraCal CALman 5 i.c.m. X
  • Rite i1 Display Pro colorimeter
Gemiddelde grijsafwijking (Delta E 1994) 7,7
Testconfiguratie
  • Beeldscherm test SpectraCal CALman 5 i.c.m. X
  • Rite i1 Display Pro colorimeter
Kleurafwijking 75% wit (Delta E 2000) 8,5 mΔuv
Testconfiguratie
  • Beeldscherm test SpectraCal CALman 5 i.c.m. X
  • Rite i1 Display Pro colorimeter
Kleurafwijking 75% rood (Delta E 2000) 1,99 mΔuv
Testconfiguratie
  • Beeldscherm test SpectraCal CALman 5 i.c.m. X
  • Rite i1 Display Pro colorimeter
Kleurafwijking 75% groen (Delta E 2000) 0,93 mΔuv
Testconfiguratie
  • Beeldscherm test SpectraCal CALman 5 i.c.m. X
  • Rite i1 Display Pro colorimeter
Kleurafwijking 75% blauw (Delta E 2000) 2,39 mΔuv
Testconfiguratie
  • Beeldscherm test SpectraCal CALman 5 i.c.m. X
  • Rite i1 Display Pro colorimeter
Kleurafwijking 75% cyaan (Delta E 2000) 5,7 mΔuv
Testconfiguratie
  • Beeldscherm test SpectraCal CALman 5 i.c.m. X
  • Rite i1 Display Pro colorimeter
Kleurafwijking 75% magenta (Delta E 2000) 3,09 mΔuv
Testconfiguratie
  • Beeldscherm test SpectraCal CALman 5 i.c.m. X
  • Rite i1 Display Pro colorimeter
Kleurafwijking 75% geel (Delta E 2000) 4,24 mΔuv
Testconfiguratie
  • Beeldscherm test SpectraCal CALman 5 i.c.m. X
  • Rite i1 Display Pro colorimeter
Gemiddelde kleurafwijking (Delta E 2000) 4,3 mΔuv
Testconfiguratie
  • Beeldscherm test SpectraCal CALman 5.13
Kleurafwijking 100% wit (Delta E 2000) 7,31 mΔuv
Testconfiguratie
  • Beeldscherm test SpectraCal CALman 5 i.c.m. X
  • Rite i1 Display Pro colorimeter
Gemiddelde kleurafwijking excl. wit (Delta E 2000) 3,1
Testconfiguratie
  • Beeldscherm test SpectraCal CALman 5 i.c.m. X
  • Rite i1 Display Pro colorimeter
Gemiddelde grijsafwijking (Delta E 2000) 6,8 mΔuv
Testconfiguratie
  • Beeldscherm test SpectraCal CALman 5.13
sRGB dekking 96 %
Testconfiguratie
  • Beeldscherm test SpectraCal CALman 5.13
DCI-P3 dekking 71,3 %
Testconfiguratie
  • Beeldscherm test SpectraCal CALman 5.13
Rec 2020 dekking 51,3 %
Testconfiguratie
  • Beeldscherm test SpectraCal CALman 5.13

Alternatieven

HP Pavilion Gaming 15-ec2747nd (4P6K4EA)

  • AMD Ryzen 5 5600H
  • 16 GB
  • 15.6 inch
  • 1920x1080
  • Nvidia GeForce RTX 3050
  • 512 GB
  • Qwerty
  • 2.09 kg
  • Windows
 

Asus VivoBook Pro 14X N7400PC-KM010W

  • Intel Core i7 11370H
  • 16 GB
  • 14 inch
  • 2880x1800
  • Nvidia GeForce RTX 3050
  • 1024 GB
  • Qwerty
  • 1.50 kg
  • Windows
 

Asus RoG Zephyrus Duo 16 GX650RX-LO080W

  • AMD Ryzen 9 6980HX
  • 32 GB
  • 16 inch
  • 2560x1600
  • Touchscreen
  • Nvidia GeForce RTX 3080 Max-P Design
  • 2048 GB
  • Qwerty
  • 2.60 kg
  • Windows
 

Asus RoG Zephyrus G14 GA402RK-L8032X

  • AMD Ryzen 9 6900HS
  • 32 GB
  • 14 inch
  • 2560x1600
  • AMD Radeon RX 6800S
  • 1024 GB
  • Qwerty
  • 1.7 kg
 

MSI Stealth GS77 12UHS-032NL

  • Intel Core i9 12900H
  • 64 GB
  • 17.3 inch
  • 3840x2160
  • Nvidia GeForce RTX 3080 Ti
  • 2048 GB
  • Qwerty
  • 2.91 kg
  • Windows Pro
 

Alienware x17 P48E002

  • Intel Core i7 12700H
  • 32 GB
  • 17.3 inch
  • 1920x1080
  • Nvidia GeForce RTX 3080 Max-Q Design
  • 1024 GB
  • Qwerty
  • 3.05 kg
  • Windows
 

Asus Asus RoG Strix Scar G733C

  • Intel Core i9 12950HX
  • 32 GB
  • 17.3 inch
  • Nvidia GeForce RTX 3080 Ti
  • 4096 GB
  • Qwerty
  • Windows
 

Asus TUF Gaming A15 FA507NV-LP066W

  • AMD Ryzen 7 7735HS
  • 16 GB
  • 15.6 inch
  • 1920x1080
  • Nvidia GeForce RTX 4060 Laptop GPU
  • 512 GB
  • Qwerty
  • 2.1 kg
  • Windows
 

Asus VivoBook K3500PH-L1115T

  • Intel Core i7 11370H
  • 16 GB
  • 15.6 inch
  • 1920x1080
  • Nvidia GeForce GTX 1650 Ti Max-Q Design
  • 512 GB
  • Qwerty
  • 1.65 kg
  • Windows
 

Asus VivoBook M7400QE-KM032T

  • AMD Ryzen 9 5900HX
  • 32 GB
  • 14 inch
  • 2880x1800
  • Nvidia GeForce RTX 3050 Ti
  • 1024 GB
  • Qwerty
  • 1.48 kg
  • Windows
 

Lenovo Legion 5 Pro (82RF0009US)

  • Intel Core i7 12700H
  • 16 GB
  • 16 inch
  • 2560x1600
  • Nvidia GeForce RTX 3060
  • 2048 GB
  • Qwerty
  • 2.55 kg
  • Windows
 

HP Omen 16-b1890nd (6G8B0EA)

  • Intel Core i7 12700H
  • 16 GB
  • 16.1 inch
  • 2560x1440
  • Nvidia GeForce RTX 3070
  • 1024 GB
  • Qwerty
  • 2.285 kg
  • Windows
 
0