Getest

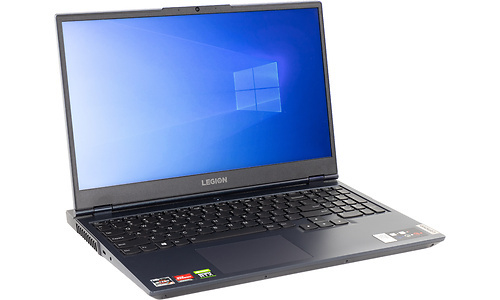
Lenovo Legion 5 15ACH6 (82JW003FMH)

Prijsverloop

Dit product is niet (meer) verkrijgbaar bij de bij Hardware Info aangesloten shops.

Specificaties

Belangrijkste specificaties

Processor type AMD Ryzen 5 5600H
Geheugen capaciteit 8 GB
Scherm diagonaal 15,6 inch
Resolutie 1920x1080
Touchscreen
GPU type Nvidia GeForce RTX 3050
Totale opslagcapaciteit 512 GB
Toetsenbordindeling Qwerty
Gewicht totaal 2,33 kg
Besturingssysteem (serie) Windows

Processor / Chipset / Geheugen

Processor serie AMD Ryzen 5
Processor type AMD Ryzen 5 5600H
Processor klokfrequentie 3,3 GHz
Processor klokfrequentie (max. turbo) 4,2 GHz
Aantal processorcores 6
Geheugen capaciteit 8 GB
Type geheugen DDR4
Geheugen klokfrequentie 3.200 MHz
Geheugen form factor Sodimm
SODIMM sloten 2
Vrije SODIMM sloten 1
Werkgeheugen uitbreidbaar tot 16 GB

Scherm

Scherm diagonaal 15,6 inch
Resolutie 1920x1080
Verhouding 16:9
Pixeldichtheid 141 ppi
Scherm type (mat/glans) Mat
Paneeltype IPS
LED-achtergrondverlichting
Touchscreen
Maximale verversingsfrequentie 120 Hz

Graphics

GPU type Nvidia GeForce RTX 3050
Geïntegreerde / losse GPU Losse chip
Videogeheugen 4 GB

Opslag

Totale opslagcapaciteit 512 GB
SSD opslagcapaciteit 512 GB
Beschikbaar opslaggeheugen 417 GB
Aantal harddisks / SSD's 1
Harddisk/SSD 1 capaciteit 512 GB
Harddisk/SSD 1 soort SSD/Flash
Harddisk/SSD 1 form factor M.2
Harddisk/SSD 1 merk/product SK hynix_HF512GDE9X084N
DVD branden
Blu-ray lezen
Blu-ray branden

Connectiviteit / Netwerk

Netwerkaansluiting (bedraad)
Netwerkadapter (bedraad) Realtek PCIe GBE Family Controller
Netwerksnelheid (bedraad) 1000 Mbit/s
WiFi standaard 802.11ax (Wi-Fi 6)
WiFi adapter Realtek RTL8852AE WiFi 6 802.11ax PCIe Adapter
Bluetooth
Bluetooth-versie Bluetooth 5.2
4G (LTE)
5G

Aansluitingen

Smartcard
USB 3.2 - 5 Gb/s (Type-A) 4
USB 3.2 - 10 Gb/s (Type-C) 2
Cardreader - SD
Cardreader - MicroSD
DVI-uitgang
VGA-uitgang
HDMI-uitgang
Aantal HDMI-uitgangen 1
Micro HDMI-uitgang
HDMI-versie 2.1
DisplayPort-uitgang
Mini DisplayPort-uitgang
Analoge audio aansluitingen 1
Aansluiting dockingstation
Kensingtonslot

Toetsenbord en touchpad

Toetsenbordindeling Qwerty
Numeriek toetsenbord
Toetsenbordverlichting helderheidsniveaus 2
Toetsenbordverlichting kleur Wit
Touchpad MS Precision compatible
Touchpad afzonderlijke muistoetsen

Camera

Webcam
Webcam resolutie 0,9 MPixel
Tweede camera
Flitser
Camera Windows Hello compatible
Webcamschuifje

Sensors

Accelerometer
Vingerafdruklezer
NFC

Overige hardware

Trusted Platform Module (TPM)
Geïntegreerde microfoon

Maten en gewichten

Accu capaciteit (Wh) 62,5 Wh
Verwisselbare accu
Gewicht totaal 2,33 kg
Afmeting - Breedte 36,26 cm
Afmeting - Diepte 26,06 cm
Afmeting - Hoogte/Dikte 1,95 cm
Passief gekoeld

Software

Besturingssysteem Microsoft Windows 10 Home
Besturingssysteem (serie) Windows
Windows versie 20H2
Windows OS Build 19.042,135
Aantal bits OS 64 bit

Fabrikantsopgave eigenschappen

Garantie 2 jaar

Productcodes

SKU 82JW003FMH
EAN 0195890358178
Toegevoegd aan Hardware Info woensdag 1 september 2021

Testresultaten

Dit product is door Hardware Info getest op woensdag 9 maart 2022.

Metro Exodus

Metro Exodus - 1920x1080 - Medium 63,9 fps
Testconfiguratie
  • Game benchmarks 2022
Metro Exodus - 1920x1080 - Medium (99p) 35,95 ms
Testconfiguratie
  • Game benchmarks 2022
Metro Exodus - 1920x1080 - Medium (99.9p) 43,74 ms
Testconfiguratie
  • Game benchmarks 2022
Metro Exodus - 1920x1080 - Ultra 39,2 fps
Testconfiguratie
  • Game benchmarks 2022
Metro Exodus - 1920x1080 - Ultra (99p) 48,46 ms
Testconfiguratie
  • Game benchmarks 2022
Metro Exodus - 1920x1080 - Ultra (99.9p) 56,78 ms
Testconfiguratie
  • Game benchmarks 2022
Metro Exodus - 2560x1440 - Medium 46,5 fps
Testconfiguratie
  • Game benchmarks 2022
Metro Exodus - 2560x1440 - Medium (99p) 42,5 ms
Testconfiguratie
  • Game benchmarks 2022
Metro Exodus - 2560x1440 - Medium (99.9p) 47,9 ms
Testconfiguratie
  • Game benchmarks 2022
Metro Exodus - 2560x1440 - Ultra 30,8 fps
Testconfiguratie
  • Game benchmarks 2022
Metro Exodus - 2560x1440 - Ultra (99p) 57,1 ms
Testconfiguratie
  • Game benchmarks 2022
Metro Exodus - 2560x1440 - Ultra (99.9p) 64,7 ms
Testconfiguratie
  • Game benchmarks 2022
Metro Exodus - 3840x2160 - Medium 27,9 fps
Testconfiguratie
  • Game benchmarks 2022
Metro Exodus - 3840x2160 - Medium (99p) 59,47 ms
Testconfiguratie
  • Game benchmarks 2022
Metro Exodus - 3840x2160 - Medium (99.9p) 63,93 ms
Testconfiguratie
  • Game benchmarks 2022
Metro Exodus - 3840x2160 - Ultra 15,2 fps
Testconfiguratie
  • Game benchmarks 2022
Metro Exodus - 3840x2160 - Ultra (99p) 108,15 ms
Testconfiguratie
  • Game benchmarks 2022
Metro Exodus - 3840x2160 - Ultra (99.9p) 120,05 ms
Testconfiguratie
  • Game benchmarks 2022
Metro Exodus - 1920x1080 - Ultra (DXR - High) 25,2 fps
Testconfiguratie
  • Game benchmarks 2022
Metro Exodus - 1920x1080 - Ultra (DXR - High) (99p) 67,86 ms
Testconfiguratie
  • Game benchmarks 2022
Metro Exodus - 1920x1080 - Ultra (DXR - High) (99.9p) 76,46 ms
Testconfiguratie
  • Game benchmarks 2022
Metro Exodus - 2560x1440 - Ultra (DXR - High) 19 fps
Testconfiguratie
  • Game benchmarks 2022
Metro Exodus - 2560x1440 - Ultra (DXR - High) (99p) 88,33 ms
Testconfiguratie
  • Game benchmarks 2022
Metro Exodus - 2560x1440 - Ultra (DXR - High) (99.9p) 100 ms
Testconfiguratie
  • Game benchmarks 2022

Far Cry: New Dawn

Far Cry: New Dawn - 1920x1080 - Medium 74,7 fps
Testconfiguratie
  • Game benchmarks 2022
Far Cry: New Dawn - 1920x1080 - Medium (99p) 20,13 ms
Testconfiguratie
  • Game benchmarks 2022
Far Cry: New Dawn - 1920x1080 - Medium (99.9p) 23,9 ms
Testconfiguratie
  • Game benchmarks 2022
Far Cry: New Dawn - 1920x1080 - Ultra 64,5 fps
Testconfiguratie
  • Game benchmarks 2022
Far Cry: New Dawn - 1920x1080 - Ultra (99p) 22,66 ms
Testconfiguratie
  • Game benchmarks 2022
Far Cry: New Dawn - 1920x1080 - Ultra (99.9p) 27,67 ms
Testconfiguratie
  • Game benchmarks 2022
Far Cry: New Dawn - 2560x1440 - Medium 64,2 fps
Testconfiguratie
  • Game benchmarks 2022
Far Cry: New Dawn - 2560x1440 - Medium (99p) 27,06 ms
Testconfiguratie
  • Game benchmarks 2022
Far Cry: New Dawn - 2560x1440 - Medium (99.9p) 32,16 ms
Testconfiguratie
  • Game benchmarks 2022
Far Cry: New Dawn - 2560x1440 - Ultra 55,1 fps
Testconfiguratie
  • Game benchmarks 2022
Far Cry: New Dawn - 2560x1440 - Ultra (99p) 26,06 ms
Testconfiguratie
  • Game benchmarks 2022
Far Cry: New Dawn - 2560x1440 - Ultra (99.9p) 36,23 ms
Testconfiguratie
  • Game benchmarks 2022
Far Cry: New Dawn - 3840x2160 - Medium 35,8 fps
Testconfiguratie
  • Game benchmarks 2022
Far Cry: New Dawn - 3840x2160 - Medium (99p) 36,32 ms
Testconfiguratie
  • Game benchmarks 2022
Far Cry: New Dawn - 3840x2160 - Medium (99.9p) 42,79 ms
Testconfiguratie
  • Game benchmarks 2022
Far Cry: New Dawn - 3840x2160 - Ultra 26,1 fps
Testconfiguratie
  • Game benchmarks 2022
Far Cry: New Dawn - 3840x2160 - Ultra (99p) 47,57 ms
Testconfiguratie
  • Game benchmarks 2022
Far Cry: New Dawn - 3840x2160 - Ultra (99.9p) 66,94 ms
Testconfiguratie
  • Game benchmarks 2022

F1 2020

F1 2020 (DX12) - 1920x1080 - Medium 139,4 fps
Testconfiguratie
  • Game benchmarks 2022
F1 2020 (DX12) - 1920x1080 - Medium (99p) 11,5 ms
Testconfiguratie
  • Game benchmarks 2022
F1 2020 (DX12) - 1920x1080 - Medium (99.9p) 14,4 ms
Testconfiguratie
  • Game benchmarks 2022
F1 2020 (DX12) - 1920x1080 - Ultra 82,2 fps
Testconfiguratie
  • Game benchmarks 2022
F1 2020 (DX12) - 1920x1080 - Ultra (99p) 16 ms
Testconfiguratie
  • Game benchmarks 2022
F1 2020 (DX12) - 1920x1080 - Ultra (99.9p) 18,3 ms
Testconfiguratie
  • Game benchmarks 2022
F1 2020 (DX12) - 2560x1440 - Medium 107,1 fps
Testconfiguratie
  • Game benchmarks 2022
F1 2020 (DX12) - 2560x1440 - Medium (99p) 12,4 ms
Testconfiguratie
  • Game benchmarks 2022
F1 2020 (DX12) - 2560x1440 - Medium (99.9p) 16,5 ms
Testconfiguratie
  • Game benchmarks 2022
F1 2020 (DX12) - 2560x1440 - Ultra 58,6 fps
Testconfiguratie
  • Game benchmarks 2022
F1 2020 (DX12) - 2560x1440 - Ultra (99p) 21,4 ms
Testconfiguratie
  • Game benchmarks 2022
F1 2020 (DX12) - 2560x1440 - Ultra (99.9p) 23,8 ms
Testconfiguratie
  • Game benchmarks 2022
F1 2020 (DX12) - 3840x2160 - Medium 59,1 fps
Testconfiguratie
  • Game benchmarks 2022
F1 2020 (DX12) - 3840x2160 - Medium (99p) 21,1 ms
Testconfiguratie
  • Game benchmarks 2022
F1 2020 (DX12) - 3840x2160 - Medium (99.9p) 24,6 ms
Testconfiguratie
  • Game benchmarks 2022
F1 2020 (DX12) - 3840x2160 - Ultra 31,8 fps
Testconfiguratie
  • Game benchmarks 2022
F1 2020 (DX12) - 3840x2160 - Ultra (99p) 38,2 ms
Testconfiguratie
  • Game benchmarks 2022
F1 2020 (DX12) - 3840x2160 - Ultra (99.9p) 41,3 ms
Testconfiguratie
  • Game benchmarks 2022

Geluidstest

Noise floor 14 dB(A)
Testconfiguratie
  • Geluidsdichte ruimte 2021
  • Larson Davis SoundAdvisor Model 831C
Afstand geluidsmeting 50 cm
Testconfiguratie
  • Geluidsdichte ruimte 2021
  • Larson Davis SoundAdvisor Model 831C
WebXPRT 3 - LAeq 21,8 dB
Testconfiguratie
  • Geluidsdichte ruimte 2021
  • Larson Davis SoundAdvisor Model 831C
PCMark 10 Express - LAeq 29,3 dB
Testconfiguratie
  • Geluidsdichte ruimte 2021
  • Larson Davis SoundAdvisor Model 831C
Blender - LAeq 45,8 dB
Testconfiguratie
  • Geluidsdichte ruimte 2021
  • Larson Davis SoundAdvisor Model 831C
F1 2020 - LAeq 42,7 dB
Testconfiguratie
  • Geluidsdichte ruimte 2021
  • Larson Davis SoundAdvisor Model 831C

PCMark 10 Storage

PCMark 10 - Gebruiken Adobe Photoshop Heavy 579
Testconfiguratie
  • Windows benchmarks
PCMark 10 - Storage - Totaalscore - Toegangstijd 110
Testconfiguratie
  • Windows benchmarks
PCMark 10 - Storage - Totaalscore - Bandbreedte 250,82
PCMark 10 - Storage - Totaalscore 1.546
Testconfiguratie
  • Windows benchmarks
PCMark 10 - 2.37GB_(399_JPEGs)_leestest 195
PCMark 10 - 2.37GB_(399_JPEGs)_kopieertest 296
Testconfiguratie
  • Windows benchmarks
PCMark 10 - 2.37GB_(399_JPEGs)_schrijftest 181
Testconfiguratie
  • Windows benchmarks
PCMark 10 - 2GB_(4_ISOs)_leestest 1.844
Testconfiguratie
  • Windows benchmarks
PCMark 10 - 2GB_(4_ISOs)_kopieertest 907
Testconfiguratie
  • Windows benchmarks
PCMark 10 - 2GB_(4_ISOs)_schrijftest 1.448
Testconfiguratie
  • Windows benchmarks
PCMark 10 - Gebruiken Microsoft PowerPoint 137
Testconfiguratie
  • Windows benchmarks
PCMark 10 - Gebruiken Microsoft Excel 77
Testconfiguratie
  • Windows benchmarks
PCMark 10 - Gebruiken Adobe Photoshop Light 180
Testconfiguratie
  • Windows benchmarks
PCMark 10 - Starten Windows 10 170
Testconfiguratie
  • Windows benchmarks
PCMark 10 - Gebruiken Adobe InDesign 169
Testconfiguratie
  • Windows benchmarks
PCMark 10 - Gebruiken Adobe Illustrator 116
PCMark 10 - Gebruiken Adobe After Effects 269
Testconfiguratie
  • Windows benchmarks
PCMark 10 - Starten Overwatch 301
Testconfiguratie
  • Windows benchmarks
PCMark 10 - Starten Call of Duty: Black Ops 4 606
Testconfiguratie
  • Windows benchmarks
PCMark 10 - Starten Battlefield V 739
Testconfiguratie
  • Windows benchmarks
PCMark 10 - Starten Adobe Photoshop 135
Testconfiguratie
  • Windows benchmarks
PCMark 10 - Starten Adobe Lightroom 91
Testconfiguratie
  • Windows benchmarks
PCMark 10 - Starten Adobe Premiere_Pro 158
Testconfiguratie
  • Windows benchmarks
PCMark 10 - Starten Adobe Illustrator 97
Testconfiguratie
  • Windows benchmarks
PCMark 10 - Starten Adobe After Effects 136
Testconfiguratie
  • Windows benchmarks
PCMark 10 - Starten Adobe Acrobat 167
Testconfiguratie
  • Windows benchmarks
PCMark 10 - Quick Storage - Totaalscore 1.474
Testconfiguratie
  • Windows benchmarks
PCMark 10 - Quick Storage - Totaalscore - Bandbreedte 182,45
Testconfiguratie
  • Windows benchmarks
PCMark 10 - Quick Storage - Totaalscore - Toegangstijd 88
Testconfiguratie
  • Windows benchmarks

Platform onafhankelijke tests

Opstarttijd 10,63 sec.
Testconfiguratie
  • Platform onafhankelijke tests
JetStream 2 193,582
Testconfiguratie
  • Platform onafhankelijke tests
webXPRT 3 282
Testconfiguratie
  • Platform onafhankelijke tests
webXPRT 3 - Photo Enhancement 270 ms
Testconfiguratie
  • Platform onafhankelijke tests
webXPRT 3 - Organize Album using AI 1.827 ms
Testconfiguratie
  • Platform onafhankelijke tests
webXPRT 3 - Stock Option Pricing 111 ms
Testconfiguratie
  • Platform onafhankelijke tests
webXPRT 3 - Encrypt Notes and OCR Scan 1.644 ms
Testconfiguratie
  • Platform onafhankelijke tests
webXPRT 3 - Sales Graphs 294 ms
Testconfiguratie
  • Platform onafhankelijke tests
webXPRT 3 - Online Homework 967 ms
Testconfiguratie
  • Platform onafhankelijke tests
Geekbench 5 - Multi 4.661
Testconfiguratie
  • Platform onafhankelijke tests
Geekbench 5 - Multi Crypto 1.763
Testconfiguratie
  • Platform onafhankelijke tests
Geekbench 5 - Multi Integer 4.520
Testconfiguratie
  • Platform onafhankelijke tests
Geekbench 5 - Multi Floating Point 5.450
Testconfiguratie
  • Platform onafhankelijke tests
Geekbench 5 - Single 1.306
Testconfiguratie
  • Platform onafhankelijke tests
Geekbench 5 - Single Crypto 2.565
Testconfiguratie
  • Platform onafhankelijke tests
Geekbench 5 - Single Integer 1.126
Testconfiguratie
  • Platform onafhankelijke tests
Geekbench 5 - Single Floating Point 1.487
Testconfiguratie
  • Platform onafhankelijke tests
Geekbench 5 - OpenCL 60.031
Testconfiguratie
  • Platform onafhankelijke tests
WiFi speedtest 2.4GHz receive 219 Mbit/s
Testconfiguratie
  • Platform onafhankelijke tests
WiFi speedtest 2.4GHz send 199 Mbit/s
Testconfiguratie
  • Platform onafhankelijke tests
WiFi speedtest 5.0GHz receive 628 Mbit/s
Testconfiguratie
  • Platform onafhankelijke tests
WiFi speedtest 5.0GHz send 648 Mbit/s
Testconfiguratie
  • Platform onafhankelijke tests

Windows benchmarks

3DMark - Ice Storm 217.372
Testconfiguratie
  • Windows benchmarks
3DMark - Cloud Gate 36.932
Testconfiguratie
  • Windows benchmarks
3DMark - Cloud Gate Graphics 91.681
Testconfiguratie
  • Windows benchmarks
3DMark - Cloud Gate Physics 11.952
Testconfiguratie
  • Windows benchmarks
3DMark - Fire Strike 12.236
Testconfiguratie
  • Windows benchmarks
3DMark - Fire Strike Graphics 13.764
Testconfiguratie
  • Windows benchmarks
3DMark - Fire Strike Physics 20.266
Testconfiguratie
  • Windows benchmarks
3DMark - Fire Strike Combined 5.043
Testconfiguratie
  • Windows benchmarks
3DMark - Fire Strike Extreme 6.294
Testconfiguratie
  • Windows benchmarks
3DMark - Time Spy 5.434
Testconfiguratie
  • Windows benchmarks
3DMark - Time Spy Graphics 5.392
Testconfiguratie
  • Windows benchmarks
3DMark - Time Spy CPU 5.689
Testconfiguratie
  • Windows benchmarks
3DMark - Night Raid 37.866
Testconfiguratie
  • Windows benchmarks
3DMark - Night Raid Graphics 66.506
Testconfiguratie
  • Windows benchmarks
3DMark - Night Raid CPU 11.007
Testconfiguratie
  • Windows benchmarks
Cinebench R15 - Single 220
Testconfiguratie
  • Windows benchmarks
Cinebench R15 - Multi 1.588
Testconfiguratie
  • Windows benchmarks
Cinebench R20 - Single 529
Testconfiguratie
  • Windows benchmarks
Cinebench R20 - Multi 3.728
Testconfiguratie
  • Windows benchmarks
Cinebench R23 - Single 1.354
Testconfiguratie
  • Windows benchmarks
Cinebench R23 - Multi 9.701
Testconfiguratie
  • Windows benchmarks
PCMark 8 - Storage 2.0 - Storage Score 5.083
Testconfiguratie
  • Windows benchmarks
PCMark 8 - Storage 2.0 - Storage Bandwidth 575,03 MB/s
Testconfiguratie
  • Windows benchmarks
Geekbench4 - Multi 21.974
Testconfiguratie
  • Windows benchmarks
Geekbench4 - Multi crypto 4.735
Testconfiguratie
  • Windows benchmarks
Geekbench4 - Multi integer 26.465
Testconfiguratie
  • Windows benchmarks
Geekbench4 - Multi float 30.515
Testconfiguratie
  • Windows benchmarks
Geekbench4 - Multi memory 3.368
Testconfiguratie
  • Windows benchmarks
Geekbench4 - Single 5.450
Testconfiguratie
  • Windows benchmarks
Geekbench4 - Single crypto 6.342
Testconfiguratie
  • Windows benchmarks
Geekbench4 - Single integer 5.805
Testconfiguratie
  • Windows benchmarks
Geekbench4 - Single float 6.102
Testconfiguratie
  • Windows benchmarks
Geekbench4 - Single memory 3.448
Testconfiguratie
  • Windows benchmarks
Blender duurtest run #1 28,61
Testconfiguratie
  • Windows benchmarks
Blender duurtest run #2 28,34
Testconfiguratie
  • Windows benchmarks
Blender duurtest run #3 28,86
Testconfiguratie
  • Windows benchmarks
Blender duurtest run #4 28,51
Testconfiguratie
  • Windows benchmarks
Blender duurtest run #5 28,58
Testconfiguratie
  • Windows benchmarks
Blender duurtest run #6 28,55
Testconfiguratie
  • Windows benchmarks
Blender duurtest run #7 28,46
Testconfiguratie
  • Windows benchmarks
Blender duurtest run #8 28,51
Testconfiguratie
  • Windows benchmarks
Blender duurtest run #9 28,75
Testconfiguratie
  • Windows benchmarks
Blender duurtest run #10 28,47
Testconfiguratie
  • Windows benchmarks
Blender duurtest run #11 28,46
Testconfiguratie
  • Windows benchmarks
Blender duurtest run #12 28,66
Testconfiguratie
  • Windows benchmarks
Blender duurtest run #13 28,71
Testconfiguratie
  • Windows benchmarks
Blender duurtest run #14 28,53
Testconfiguratie
  • Windows benchmarks
Blender duurtest run #15 28,57
Testconfiguratie
  • Windows benchmarks
Blender duurtest run #16 28,49
Testconfiguratie
  • Windows benchmarks
Blender duurtest run #17 28,68
Testconfiguratie
  • Windows benchmarks
Blender duurtest run #18 28,49
Testconfiguratie
  • Windows benchmarks
Blender duurtest run #19 28,68
Testconfiguratie
  • Windows benchmarks
Blender duurtest run #20 28,67
Testconfiguratie
  • Windows benchmarks
Blender duurtest run #21 28,54
Testconfiguratie
  • Windows benchmarks
Blender duurtest run #22 28,58
Testconfiguratie
  • Windows benchmarks
Blender duurtest run #23 28,58
Testconfiguratie
  • Windows benchmarks
Blender duurtest run #24 28,61
Testconfiguratie
  • Windows benchmarks
Blender duurtest run #25 28,49
Testconfiguratie
  • Windows benchmarks
Blender duurtest run #26 28,61
Testconfiguratie
  • Windows benchmarks
Blender duurtest run #27 28,71
Testconfiguratie
  • Windows benchmarks
Blender duurtest run #28 28,56
Testconfiguratie
  • Windows benchmarks
Blender duurtest run #29 28,49
Testconfiguratie
  • Windows benchmarks
Blender duurtest run #30 28,52
Testconfiguratie
  • Windows benchmarks
Blender duurtest run #31 28,49
Testconfiguratie
  • Windows benchmarks
Blender duurtest run #32 28,43
Testconfiguratie
  • Windows benchmarks
Blender duurtest run #33 28,52
Testconfiguratie
  • Windows benchmarks
Blender duurtest run #34 28,7
Testconfiguratie
  • Windows benchmarks
Blender duurtest run #35 28,57
Testconfiguratie
  • Windows benchmarks
Blender duurtest run #36 28,43
Testconfiguratie
  • Windows benchmarks
Blender duurtest run #37 28,39
Testconfiguratie
  • Windows benchmarks
Blender duurtest run #38 28,45
Testconfiguratie
  • Windows benchmarks
Blender duurtest run #39 28,48
Testconfiguratie
  • Windows benchmarks
Blender duurtest run #40 28,43
Testconfiguratie
  • Windows benchmarks
Blender duurtest run #41 28,43
Testconfiguratie
  • Windows benchmarks
PCMark 10 Extended 6.877
Testconfiguratie
  • Windows benchmarks
PCMark 10 Essentials 10.145
Testconfiguratie
  • Windows benchmarks
PCMark 10 App Start-up 14.798
Testconfiguratie
  • Windows benchmarks
PCMark 10 Video Conferencing 7.738
Testconfiguratie
  • Windows benchmarks
PCMark 10 Web Browsing 9.120
Testconfiguratie
  • Windows benchmarks
PCMark 10 Productivity 8.533
Testconfiguratie
  • Windows benchmarks
PCMark 10 Spreadsheets 9.666
Testconfiguratie
  • Windows benchmarks
PCMark 10 Writing 7.533
Testconfiguratie
  • Windows benchmarks
PCMark 10 Digital Content Creation 6.893
Testconfiguratie
  • Windows benchmarks
PCMark 10 Photo Editing 7.669
Testconfiguratie
  • Windows benchmarks
PCMark 10 Rendering and Visualization 8.877
Testconfiguratie
  • Windows benchmarks
PCMark 10 Video Editing 4.812
Testconfiguratie
  • Windows benchmarks
PCMark 10 Gaming 10.128
Testconfiguratie
  • Windows benchmarks
PCMark 10 Graphics 13.652
Testconfiguratie
  • Windows benchmarks
PCMark 10 Physics 19.795
Testconfiguratie
  • Windows benchmarks
PCMark 10 Combined 5.043
Testconfiguratie
  • Windows benchmarks

Energieverbruik / Accu

Energieverbruik uit 0,5 W
Testconfiguratie
  • Windows benchmarks
Energieverbruik adapter (zonder laptop) 0 W
Testconfiguratie
  • Windows benchmarks
Energieverbruik idle 10,2 W
Testconfiguratie
  • Windows benchmarks
Browser accutest - 180 cd/m2 268 min.
Testconfiguratie
  • Windows benchmarks
PCMark Creative accutest - 180 cd/m2 194 min.
Testconfiguratie
  • Windows benchmarks
PCMark Creative (Accu) 3.307
Testconfiguratie
  • Windows benchmarks
PCMark 10 Accu Digital 3.779
Testconfiguratie
  • Windows benchmarks
PCMark 10 Accu Essentials 6.163
Testconfiguratie
  • Windows benchmarks
PCMark 10 Accu Productivity 4.766
Testconfiguratie
  • Windows benchmarks
PCMark 10 Accu Duration in Minuten 204
Testconfiguratie
  • Windows benchmarks
PCMark 10 Accu Aantal Runs 8
Testconfiguratie
  • Windows benchmarks

Testresultaten beeldscherm

Gemeten kleurruimte sRGB
Testconfiguratie
  • Beeldscherm test SpectraCal CALman 5.13
Kleurtemperatuur 6.797 K
Testconfiguratie
  • Beeldscherm test SpectraCal CALman 5.13
Helderheid wit 283 cd/m²
Testconfiguratie
  • Beeldscherm test SpectraCal CALman 5.13
Helderheid zwart 0,30 cd/m²
Testconfiguratie
  • Beeldscherm test SpectraCal CALman 5.13
Contrast 944,4 : 1
Testconfiguratie
  • Beeldscherm test SpectraCal CALman 5.13
Checkerboard wit 282,262 cd/m²
Testconfiguratie
  • Beeldscherm test SpectraCal CALman 5.13
Checkerboard zwart 0,324 cd/m²
Testconfiguratie
  • Beeldscherm test SpectraCal CALman 5.13
Checkerboard contrast 871 : 1
Testconfiguratie
  • Beeldscherm test SpectraCal CALman 5.13
Gamma 2,16
Testconfiguratie
  • Beeldscherm test SpectraCal CALman 5.13
Gamma (afwijking van 2,2) 0,04
Testconfiguratie
  • Beeldscherm test SpectraCal CALman 5.13
Kleurafwijking rood (Delta E 1994) 4,15
Testconfiguratie
  • Beeldscherm test SpectraCal CALman 5 i.c.m. X
  • Rite i1 Display Pro colorimeter
Kleurafwijking groen (Delta E 1994) 11,04
Testconfiguratie
  • Beeldscherm test SpectraCal CALman 5 i.c.m. X
  • Rite i1 Display Pro colorimeter
Kleurafwijking blauw (Delta E 1994) 16,61
Testconfiguratie
  • Beeldscherm test SpectraCal CALman 5 i.c.m. X
  • Rite i1 Display Pro colorimeter
Kleurafwijking cyaan (Delta E 1994) 7,78
Testconfiguratie
  • Beeldscherm test SpectraCal CALman 5 i.c.m. X
  • Rite i1 Display Pro colorimeter
Kleurafwijking magenta (Delta E 1994) 9,48
Testconfiguratie
  • Beeldscherm test SpectraCal CALman 5 i.c.m. X
  • Rite i1 Display Pro colorimeter
Kleurafwijking geel (Delta E 1994) 5,89
Testconfiguratie
  • Beeldscherm test SpectraCal CALman 5 i.c.m. X
  • Rite i1 Display Pro colorimeter
Gemiddelde kleurafwijking (Delta E 1994) 9,2
Testconfiguratie
  • Beeldscherm test SpectraCal CALman 5 i.c.m. X
  • Rite i1 Display Pro colorimeter
Gemiddelde grijsafwijking (Delta E 1994) 4,1
Testconfiguratie
  • Beeldscherm test SpectraCal CALman 5 i.c.m. X
  • Rite i1 Display Pro colorimeter
Kleurafwijking 75% wit (Delta E 2000) 5,82 mΔuv
Testconfiguratie
  • Beeldscherm test SpectraCal CALman 5 i.c.m. X
  • Rite i1 Display Pro colorimeter
Kleurafwijking 75% rood (Delta E 2000) 4,56 mΔuv
Testconfiguratie
  • Beeldscherm test SpectraCal CALman 5 i.c.m. X
  • Rite i1 Display Pro colorimeter
Kleurafwijking 75% groen (Delta E 2000) 10,08 mΔuv
Testconfiguratie
  • Beeldscherm test SpectraCal CALman 5 i.c.m. X
  • Rite i1 Display Pro colorimeter
Kleurafwijking 75% blauw (Delta E 2000) 15,84 mΔuv
Testconfiguratie
  • Beeldscherm test SpectraCal CALman 5 i.c.m. X
  • Rite i1 Display Pro colorimeter
Kleurafwijking 75% cyaan (Delta E 2000) 8,77 mΔuv
Testconfiguratie
  • Beeldscherm test SpectraCal CALman 5 i.c.m. X
  • Rite i1 Display Pro colorimeter
Kleurafwijking 75% magenta (Delta E 2000) 9,9 mΔuv
Testconfiguratie
  • Beeldscherm test SpectraCal CALman 5 i.c.m. X
  • Rite i1 Display Pro colorimeter
Kleurafwijking 75% geel (Delta E 2000) 6,22 mΔuv
Testconfiguratie
  • Beeldscherm test SpectraCal CALman 5 i.c.m. X
  • Rite i1 Display Pro colorimeter
Gemiddelde kleurafwijking (Delta E 2000) 8,8 mΔuv
Testconfiguratie
  • Beeldscherm test SpectraCal CALman 5.13
Kleurafwijking 100% wit (Delta E 2000) 9,43 mΔuv
Testconfiguratie
  • Beeldscherm test SpectraCal CALman 5 i.c.m. X
  • Rite i1 Display Pro colorimeter
Gemiddelde kleurafwijking excl. wit (Delta E 2000) 9,2
Testconfiguratie
  • Beeldscherm test SpectraCal CALman 5 i.c.m. X
  • Rite i1 Display Pro colorimeter
Gemiddelde grijsafwijking (Delta E 2000) 4,9 mΔuv
Testconfiguratie
  • Beeldscherm test SpectraCal CALman 5.13
Reactietijd 0%-100% 8,26 ms
Testconfiguratie
  • Beeldscherm test SpectraCal CALman 5.13
Reactietijd 100%-0% 8,87 ms
Testconfiguratie
  • Beeldscherm test SpectraCal CALman 5.13
Reactietijd 20%-80% 13,37 ms
Testconfiguratie
  • Beeldscherm test SpectraCal CALman 5.13
Reactietijd 80%-20% 10,95 ms
Testconfiguratie
  • Beeldscherm test SpectraCal CALman 5.13
sRGB dekking 61,8 %
Testconfiguratie
  • Beeldscherm test SpectraCal CALman 5.13
DCI-P3 dekking 46,2 %
Testconfiguratie
  • Beeldscherm test SpectraCal CALman 5.13
Rec 2020 dekking 33,1 %
Testconfiguratie
  • Beeldscherm test SpectraCal CALman 5.13

Alternatieven

Asus TUF Gaming A15 FA507NV-LP066W

  • AMD Ryzen 7 7735HS
  • 16 GB
  • 15.6 inch
  • 1920x1080
  • Nvidia GeForce RTX 4060 Laptop GPU
  • 512 GB
  • Qwerty
  • 2.1 kg
  • Windows
 

Acer Aspire 7 A715-75G-7170

  • Intel Core i7 9750H
  • 12 GB
  • 15.6 inch
  • 1920x1080
  • Nvidia GeForce GTX 1650 Ti
  • 512 GB
  • Qwerty
  • 2.15 kg
  • Windows
 

Asus TUF Gaming Dash F15 FX516PR-HN002T

  • Intel Core i7 11370H
  • 16 GB
  • 15.6 inch
  • 1920x1080
  • Nvidia GeForce RTX 3070
  • 512 GB
  • Qwerty
  • 2 kg
  • Windows
 

Acer Nitro 5 AN515-55-56VC

  • Intel Core i5 10300H
  • 8 GB
  • 15.6 inch
  • 1920x1080
  • Nvidia GeForce GTX 1650 Ti
  • 512 GB
  • Qwerty
  • 2.18 kg
  • Windows
 

MSI Creator Z16 A11UET-067NL

  • Intel Core i9 11900H
  • 32 GB
  • 16 inch
  • 2560x1600
  • Touchscreen
  • Nvidia GeForce RTX 3060
  • 1000 GB
  • Qwerty
  • 2.2 kg
  • Windows Pro
 

HP Victus 16-e0548nd (488M1EA)

  • AMD Ryzen 7 5800H
  • 16 GB
  • 16.1 inch
  • 1920x1080
  • Nvidia GeForce RTX 3060
  • 1024 GB
  • Qwerty
  • 2.46 kg
  • Windows
 

HP Pavilion Gaming 15-ec2747nd (4P6K4EA)

  • AMD Ryzen 5 5600H
  • 16 GB
  • 15.6 inch
  • 1920x1080
  • Nvidia GeForce RTX 3050
  • 512 GB
  • Qwerty
  • 2.09 kg
  • Windows
 

Asus RoG Strix G15 G513IE-HN004W

  • AMD Ryzen 7 4800H
  • 16 GB
  • 15.6 inch
  • 1920x1080
  • Nvidia GeForce RTX 3050 Ti
  • 512 GB
  • Qwerty
  • 2.1 kg
  • Windows
 

HP Victus 16-e0685nd

  • AMD Ryzen 5 5600H
  • 16 GB
  • 16.1 inch
  • 1920x1080
  • Nvidia GeForce RTX 3050
  • 512 GB
  • Qwerty
  • 2.39 kg
  • Windows
 

Asus VivoBook Pro 14X N7400PC-KM010W

  • Intel Core i7 11370H
  • 16 GB
  • 14 inch
  • 2880x1800
  • Nvidia GeForce RTX 3050
  • 1024 GB
  • Qwerty
  • 1.50 kg
  • Windows
 

Asus RoG Zephyrus Duo 16 GX650RX-LO080W

  • AMD Ryzen 9 6980HX
  • 32 GB
  • 16 inch
  • 2560x1600
  • Touchscreen
  • Nvidia GeForce RTX 3080 Max-P Design
  • 2048 GB
  • Qwerty
  • 2.60 kg
  • Windows
 

Asus RoG Zephyrus G14 GA402RK-L8032X

  • AMD Ryzen 9 6900HS
  • 32 GB
  • 14 inch
  • 2560x1600
  • AMD Radeon RX 6800S
  • 1024 GB
  • Qwerty
  • 1.7 kg
 
0