Getest

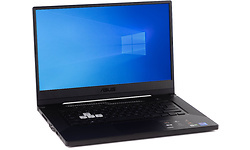
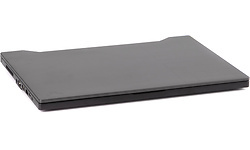
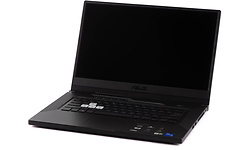
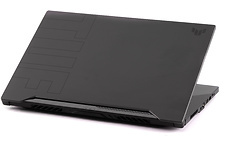
Asus TUF Gaming Dash F15 FX516PR-HN002T

Prijsverloop

Dit product is niet (meer) verkrijgbaar bij de bij Hardware Info aangesloten shops.

Specificaties

Belangrijkste specificaties

Processor type Intel Core i7 11370H
Geheugen capaciteit 16 GB
Scherm diagonaal 15,6 inch
Resolutie 1920x1080
Touchscreen
GPU type Nvidia GeForce RTX 3070
Totale opslagcapaciteit 512 GB
Toetsenbordindeling Qwerty
Gewicht totaal 2,00 kg
Besturingssysteem (serie) Windows

Processor / Chipset / Geheugen

Processor serie Intel Core i7
Processor type Intel Core i7 11370H
Processor klokfrequentie 3 GHz
Processor klokfrequentie (max. turbo) 4,8 GHz
Configureerbare TDP-down 28 W
Configureerbare TDP-up 35 W
Configureerbare TDP-downfrequentie 3 GHz
Configureerbare TDP-upfrequentie 3 GHz
Aantal processorcores 4
Geheugen capaciteit 16 GB
Type geheugen DDR4
Geheugen klokfrequentie 3.200 MHz
SODIMM sloten 1
Vrije SODIMM sloten 0
Werkgeheugen uitbreidbaar tot 16 GB

Scherm

Scherm diagonaal 15,6 inch
Resolutie 1920x1080
Verhouding 16:9
Pixeldichtheid 141 ppi
Scherm type (mat/glans) Mat
Paneeltype IPS
LED-achtergrondverlichting
Touchscreen
Maximale verversingsfrequentie 60 Hz

Graphics

GPU type Nvidia GeForce RTX 3070
Geïntegreerde / losse GPU Losse chip
Videogeheugen 8 GB

Opslag

Totale opslagcapaciteit 512 GB
SSD opslagcapaciteit 512 GB
Beschikbaar opslaggeheugen 402,9 GB
Aantal harddisks / SSD's 1
Harddisk/SSD 1 capaciteit 512 GB
Harddisk/SSD 1 soort SSD/Flash
Harddisk/SSD 1 form factor M.2
Harddisk/SSD 1 merk/product Samsung MZVLQ512HBLU-00B00
DVD branden
Blu-ray lezen
Blu-ray branden

Connectiviteit / Netwerk

Netwerkaansluiting (bedraad)
Netwerksnelheid (bedraad) 1000 Mbit/s
WiFi standaard 802.11ax (Wi-Fi 6)
WiFi adapter Intel(R) Wi-Fi 6 AX201 160Mhz
Bluetooth
Bluetooth-versie Bluetooth 5.1
4G (LTE)
5G

Aansluitingen

Smartcard
USB 3.2 - 5 Gb/s (Type-A) 3
USB 3.2 - 5 Gb/s (Type-C) 1
Cardreader - SD
Cardreader - MicroSD
DVI-uitgang
VGA-uitgang
HDMI-uitgang
Aantal HDMI-uitgangen 1
Micro HDMI-uitgang
HDMI-versie 2.0
DisplayPort-uitgang
Mini DisplayPort-uitgang
Analoge audio aansluitingen 1
Aansluiting dockingstation
Kensingtonslot

Toetsenbord en touchpad

Toetsenbordindeling Qwerty
Numeriek toetsenbord
Toetsenbordverlichting helderheidsniveaus 3
Toetsenbordverlichting kleur RGB
Touchpad MS Precision compatible
Touchpad afzonderlijke muistoetsen

Camera

Webcam
Tweede camera
Flitser
Camera Windows Hello compatible
Webcamschuifje

Sensors

Accelerometer
Vingerafdruklezer
NFC

Overige hardware

Geïntegreerde microfoon

Maten en gewichten

Accu capaciteit (Wh) 76 Wh
Verwisselbare accu
Gewicht totaal 2,00 kg
Afmeting - Breedte 36 cm
Afmeting - Diepte 25,2 cm
Afmeting - Hoogte/Dikte 1,99 cm

Software

Besturingssysteem Microsoft Windows 10 Home
Besturingssysteem (serie) Windows
Aantal bits OS 64 bit

Fabrikantsopgave eigenschappen

Garantie 2 jaar

Productcodes

SKU 90NR0651-M02450
EAN 4711081012061
Toegevoegd aan Hardware Info vrijdag 26 maart 2021

Testresultaten

Dit product is door Hardware Info getest op woensdag 9 maart 2022.

Metro Exodus

Metro Exodus - 1920x1080 - Medium 96,3 fps
Testconfiguratie
  • Game benchmarks 2022
Metro Exodus - 1920x1080 - Medium (99p) 21,5 ms
Testconfiguratie
  • Game benchmarks 2022
Metro Exodus - 1920x1080 - Medium (99.9p) 27,2 ms
Testconfiguratie
  • Game benchmarks 2022
Metro Exodus - 1920x1080 - Ultra 60 fps
Testconfiguratie
  • Game benchmarks 2022
Metro Exodus - 1920x1080 - Ultra (99p) 31,3 ms
Testconfiguratie
  • Game benchmarks 2022
Metro Exodus - 1920x1080 - Ultra (99.9p) 38,7 ms
Testconfiguratie
  • Game benchmarks 2022
Metro Exodus - 2560x1440 - Medium 74 fps
Testconfiguratie
  • Game benchmarks 2022
Metro Exodus - 2560x1440 - Medium (99p) 25,3 ms
Testconfiguratie
  • Game benchmarks 2022
Metro Exodus - 2560x1440 - Medium (99.9p) 29,9 ms
Testconfiguratie
  • Game benchmarks 2022
Metro Exodus - 2560x1440 - Ultra 48 fps
Testconfiguratie
  • Game benchmarks 2022
Metro Exodus - 2560x1440 - Ultra (99p) 35,1 ms
Testconfiguratie
  • Game benchmarks 2022
Metro Exodus - 2560x1440 - Ultra (99.9p) 43,9 ms
Testconfiguratie
  • Game benchmarks 2022
Metro Exodus - 3840x2160 - Medium 40,9 fps
Testconfiguratie
  • Game benchmarks 2022
Metro Exodus - 3840x2160 - Medium (99p) 38,89 ms
Testconfiguratie
  • Game benchmarks 2022
Metro Exodus - 3840x2160 - Medium (99.9p) 45,34 ms
Testconfiguratie
  • Game benchmarks 2022
Metro Exodus - 3840x2160 - Ultra 28,2 fps
Testconfiguratie
  • Game benchmarks 2022
Metro Exodus - 3840x2160 - Ultra (99p) 53,32 ms
Testconfiguratie
  • Game benchmarks 2022
Metro Exodus - 3840x2160 - Ultra (99.9p) 61,02 ms
Testconfiguratie
  • Game benchmarks 2022
Metro Exodus - 1920x1080 - Ultra (DXR - High) 52,7 fps
Testconfiguratie
  • Game benchmarks 2022
Metro Exodus - 1920x1080 - Ultra (DXR - High) (99p) 34,72 ms
Testconfiguratie
  • Game benchmarks 2022
Metro Exodus - 1920x1080 - Ultra (DXR - High) (99.9p) 45,34 ms
Testconfiguratie
  • Game benchmarks 2022
Metro Exodus - 2560x1440 - Ultra (DXR - High) 35,8 fps
Testconfiguratie
  • Game benchmarks 2022
Metro Exodus - 2560x1440 - Ultra (DXR - High) (99p) 44,43 ms
Testconfiguratie
  • Game benchmarks 2022
Metro Exodus - 2560x1440 - Ultra (DXR - High) (99.9p) 54,87 ms
Testconfiguratie
  • Game benchmarks 2022

Far Cry: New Dawn

Far Cry: New Dawn - 1920x1080 - Medium 100,3 fps
Testconfiguratie
  • Game benchmarks 2022
Far Cry: New Dawn - 1920x1080 - Medium (99p) 14,35 ms
Testconfiguratie
  • Game benchmarks 2022
Far Cry: New Dawn - 1920x1080 - Medium (99.9p) 17,7 ms
Testconfiguratie
  • Game benchmarks 2022
Far Cry: New Dawn - 1920x1080 - Ultra 83,8 fps
Testconfiguratie
  • Game benchmarks 2022
Far Cry: New Dawn - 1920x1080 - Ultra (99p) 17,96 ms
Testconfiguratie
  • Game benchmarks 2022
Far Cry: New Dawn - 1920x1080 - Ultra (99.9p) 21,41 ms
Testconfiguratie
  • Game benchmarks 2022
Far Cry: New Dawn - 2560x1440 - Medium 88,1 fps
Testconfiguratie
  • Game benchmarks 2022
Far Cry: New Dawn - 2560x1440 - Medium (99p) 15,66 ms
Testconfiguratie
  • Game benchmarks 2022
Far Cry: New Dawn - 2560x1440 - Medium (99.9p) 18,44 ms
Testconfiguratie
  • Game benchmarks 2022
Far Cry: New Dawn - 2560x1440 - Ultra 74,7 fps
Testconfiguratie
  • Game benchmarks 2022
Far Cry: New Dawn - 2560x1440 - Ultra (99p) 19,17 ms
Testconfiguratie
  • Game benchmarks 2022
Far Cry: New Dawn - 2560x1440 - Ultra (99.9p) 42,35 ms
Testconfiguratie
  • Game benchmarks 2022
Far Cry: New Dawn - 3840x2160 - Medium 54,4 fps
Testconfiguratie
  • Game benchmarks 2022
Far Cry: New Dawn - 3840x2160 - Medium (99p) 23,03 ms
Testconfiguratie
  • Game benchmarks 2022
Far Cry: New Dawn - 3840x2160 - Medium (99.9p) 28,62 ms
Testconfiguratie
  • Game benchmarks 2022
Far Cry: New Dawn - 3840x2160 - Ultra 47,2 fps
Testconfiguratie
  • Game benchmarks 2022
Far Cry: New Dawn - 3840x2160 - Ultra (99p) 27,31 ms
Testconfiguratie
  • Game benchmarks 2022
Far Cry: New Dawn - 3840x2160 - Ultra (99.9p) 29,53 ms
Testconfiguratie
  • Game benchmarks 2022

F1 2020

F1 2020 (DX12) - 1920x1080 - Medium 182,3 fps
Testconfiguratie
  • Game benchmarks 2022
F1 2020 (DX12) - 1920x1080 - Medium (99p) 9 ms
Testconfiguratie
  • Game benchmarks 2022
F1 2020 (DX12) - 1920x1080 - Medium (99.9p) 10,9 ms
Testconfiguratie
  • Game benchmarks 2022
F1 2020 (DX12) - 1920x1080 - Ultra 133,8 fps
Testconfiguratie
  • Game benchmarks 2022
F1 2020 (DX12) - 1920x1080 - Ultra (99p) 12,1 ms
Testconfiguratie
  • Game benchmarks 2022
F1 2020 (DX12) - 1920x1080 - Ultra (99.9p) 17,5 ms
Testconfiguratie
  • Game benchmarks 2022
F1 2020 (DX12) - 2560x1440 - Medium 163,3 fps
Testconfiguratie
  • Game benchmarks 2022
F1 2020 (DX12) - 2560x1440 - Medium (99p) 8,6 ms
Testconfiguratie
  • Game benchmarks 2022
F1 2020 (DX12) - 2560x1440 - Medium (99.9p) 13 ms
Testconfiguratie
  • Game benchmarks 2022
F1 2020 (DX12) - 2560x1440 - Ultra 110,6 fps
Testconfiguratie
  • Game benchmarks 2022
F1 2020 (DX12) - 2560x1440 - Ultra (99p) 13 ms
Testconfiguratie
  • Game benchmarks 2022
F1 2020 (DX12) - 2560x1440 - Ultra (99.9p) 18,1 ms
Testconfiguratie
  • Game benchmarks 2022
F1 2020 (DX12) - 3840x2160 - Medium 92,8 fps
Testconfiguratie
  • Game benchmarks 2022
F1 2020 (DX12) - 3840x2160 - Medium (99p) 12,9 ms
Testconfiguratie
  • Game benchmarks 2022
F1 2020 (DX12) - 3840x2160 - Medium (99.9p) 15 ms
Testconfiguratie
  • Game benchmarks 2022
F1 2020 (DX12) - 3840x2160 - Ultra 62,7 fps
Testconfiguratie
  • Game benchmarks 2022
F1 2020 (DX12) - 3840x2160 - Ultra (99p) 20,3 ms
Testconfiguratie
  • Game benchmarks 2022
F1 2020 (DX12) - 3840x2160 - Ultra (99.9p) 23,3 ms
Testconfiguratie
  • Game benchmarks 2022

PCMark 10 Storage

PCMark 10 - Gebruiken Adobe Photoshop Heavy 491
Testconfiguratie
  • Windows benchmarks
PCMark 10 - Storage - Totaalscore - Toegangstijd 117
Testconfiguratie
  • Windows benchmarks
PCMark 10 - Storage - Totaalscore - Bandbreedte 225,63
PCMark 10 - Storage - Totaalscore 1.422
Testconfiguratie
  • Windows benchmarks
PCMark 10 - 2.37GB_(399_JPEGs)_leestest 211
PCMark 10 - 2.37GB_(399_JPEGs)_kopieertest 316
Testconfiguratie
  • Windows benchmarks
PCMark 10 - 2.37GB_(399_JPEGs)_schrijftest 152
Testconfiguratie
  • Windows benchmarks
PCMark 10 - 2GB_(4_ISOs)_leestest 1.617
Testconfiguratie
  • Windows benchmarks
PCMark 10 - 2GB_(4_ISOs)_kopieertest 909
Testconfiguratie
  • Windows benchmarks
PCMark 10 - 2GB_(4_ISOs)_schrijftest 1.363
Testconfiguratie
  • Windows benchmarks
PCMark 10 - Gebruiken Microsoft PowerPoint 108
Testconfiguratie
  • Windows benchmarks
PCMark 10 - Gebruiken Microsoft Excel 71
Testconfiguratie
  • Windows benchmarks
PCMark 10 - Gebruiken Adobe Photoshop Light 159
Testconfiguratie
  • Windows benchmarks
PCMark 10 - Starten Windows 10 262
Testconfiguratie
  • Windows benchmarks
PCMark 10 - Gebruiken Adobe InDesign 145
Testconfiguratie
  • Windows benchmarks
PCMark 10 - Gebruiken Adobe Illustrator 139
PCMark 10 - Gebruiken Adobe After Effects 248
Testconfiguratie
  • Windows benchmarks
PCMark 10 - Starten Overwatch 191
Testconfiguratie
  • Windows benchmarks
PCMark 10 - Starten Call of Duty: Black Ops 4 451
Testconfiguratie
  • Windows benchmarks
PCMark 10 - Starten Battlefield V 437
Testconfiguratie
  • Windows benchmarks
PCMark 10 - Starten Adobe Photoshop 117
Testconfiguratie
  • Windows benchmarks
PCMark 10 - Starten Adobe Lightroom 77
Testconfiguratie
  • Windows benchmarks
PCMark 10 - Starten Adobe Premiere_Pro 132
Testconfiguratie
  • Windows benchmarks
PCMark 10 - Starten Adobe Illustrator 105
Testconfiguratie
  • Windows benchmarks
PCMark 10 - Starten Adobe After Effects 114
Testconfiguratie
  • Windows benchmarks
PCMark 10 - Starten Adobe Acrobat 146
Testconfiguratie
  • Windows benchmarks
PCMark 10 - Quick Storage - Totaalscore 1.379
Testconfiguratie
  • Windows benchmarks
PCMark 10 - Quick Storage - Totaalscore - Bandbreedte 168,58
Testconfiguratie
  • Windows benchmarks
PCMark 10 - Quick Storage - Totaalscore - Toegangstijd 93
Testconfiguratie
  • Windows benchmarks

Platform onafhankelijke tests

Geekbench 5 - Multi 5.324
Testconfiguratie
  • Platform onafhankelijke tests
Geekbench 5 - Multi Crypto 5.932
Testconfiguratie
  • Platform onafhankelijke tests
Geekbench 5 - Multi Integer 5.043
Testconfiguratie
  • Platform onafhankelijke tests
Geekbench 5 - Multi Floating Point 5.830
Testconfiguratie
  • Platform onafhankelijke tests
Geekbench 5 - Single 1.608
Testconfiguratie
  • Platform onafhankelijke tests
Geekbench 5 - Single Crypto 4.091
Testconfiguratie
  • Platform onafhankelijke tests
Geekbench 5 - Single Integer 1.398
Testconfiguratie
  • Platform onafhankelijke tests
Geekbench 5 - Single Floating Point 1.650
Testconfiguratie
  • Platform onafhankelijke tests
Geekbench 5 - OpenCL 110.485
Testconfiguratie
  • Platform onafhankelijke tests
WiFi speedtest 2.4GHz receive 114 Mbit/s
Testconfiguratie
  • Platform onafhankelijke tests
WiFi speedtest 2.4GHz send 99 Mbit/s
Testconfiguratie
  • Platform onafhankelijke tests
WiFi speedtest 5.0GHz receive 642 Mbit/s
Testconfiguratie
  • Platform onafhankelijke tests
WiFi speedtest 5.0GHz send 276 Mbit/s
Testconfiguratie
  • Platform onafhankelijke tests

Windows benchmarks

3DMark - Ice Storm 100.377
Testconfiguratie
  • Windows benchmarks
3DMark - Cloud Gate 33.217
Testconfiguratie
  • Windows benchmarks
3DMark - Cloud Gate Graphics 103.514
Testconfiguratie
  • Windows benchmarks
3DMark - Cloud Gate Physics 9.837
Testconfiguratie
  • Windows benchmarks
3DMark - Fire Strike 17.329
Testconfiguratie
  • Windows benchmarks
3DMark - Fire Strike Graphics 21.214
Testconfiguratie
  • Windows benchmarks
3DMark - Fire Strike Physics 14.864
Testconfiguratie
  • Windows benchmarks
3DMark - Fire Strike Combined 8.158
Testconfiguratie
  • Windows benchmarks
3DMark - Fire Strike Extreme 9.741
Testconfiguratie
  • Windows benchmarks
3DMark - Time Spy 7.497
Testconfiguratie
  • Windows benchmarks
3DMark - Time Spy Graphics 8.029
Testconfiguratie
  • Windows benchmarks
3DMark - Time Spy CPU 5.453
Testconfiguratie
  • Windows benchmarks
3DMark - Night Raid 31.194
Testconfiguratie
  • Windows benchmarks
3DMark - Night Raid Graphics 47.997
Testconfiguratie
  • Windows benchmarks
3DMark - Night Raid CPU 10.455
Testconfiguratie
  • Windows benchmarks
Cinebench R15 - Single 233
Testconfiguratie
  • Windows benchmarks
Cinebench R15 - Multi 1.082
Testconfiguratie
  • Windows benchmarks
Cinebench R20 - Single 595
Testconfiguratie
  • Windows benchmarks
Cinebench R20 - Multi 2.707
Testconfiguratie
  • Windows benchmarks
Cinebench R23 - Single 1.556
Testconfiguratie
  • Windows benchmarks
Cinebench R23 - Multi 7.160
Testconfiguratie
  • Windows benchmarks
PCMark 8 - Storage 2.0 - Storage Score 5.032
Testconfiguratie
  • Windows benchmarks
PCMark 8 - Storage 2.0 - Storage Bandwidth 367,26 MB/s
Testconfiguratie
  • Windows benchmarks
Geekbench4 - Multi 21.651
Testconfiguratie
  • Windows benchmarks
Geekbench4 - Multi crypto 13.498
Testconfiguratie
  • Windows benchmarks
Geekbench4 - Multi integer 25.943
Testconfiguratie
  • Windows benchmarks
Geekbench4 - Multi float 27.068
Testconfiguratie
  • Windows benchmarks
Geekbench4 - Multi memory 5.906
Testconfiguratie
  • Windows benchmarks
Geekbench4 - Single 6.791
Testconfiguratie
  • Windows benchmarks
Geekbench4 - Single crypto 8.890
Testconfiguratie
  • Windows benchmarks
Geekbench4 - Single integer 6.882
Testconfiguratie
  • Windows benchmarks
Geekbench4 - Single float 7.047
Testconfiguratie
  • Windows benchmarks
Geekbench4 - Single memory 5.678
Testconfiguratie
  • Windows benchmarks
Blender duurtest run #1 38,01
Testconfiguratie
  • Windows benchmarks
Blender duurtest run #2 37,92
Testconfiguratie
  • Windows benchmarks
Blender duurtest run #3 37,91
Testconfiguratie
  • Windows benchmarks
Blender duurtest run #4 38,1
Testconfiguratie
  • Windows benchmarks
Blender duurtest run #5 38,14
Testconfiguratie
  • Windows benchmarks
Blender duurtest run #6 38,31
Testconfiguratie
  • Windows benchmarks
Blender duurtest run #7 38,3
Testconfiguratie
  • Windows benchmarks
Blender duurtest run #8 38,39
Testconfiguratie
  • Windows benchmarks
Blender duurtest run #9 38,45
Testconfiguratie
  • Windows benchmarks
Blender duurtest run #10 38,43
Testconfiguratie
  • Windows benchmarks
Blender duurtest run #11 38,45
Testconfiguratie
  • Windows benchmarks
Blender duurtest run #12 38,36
Testconfiguratie
  • Windows benchmarks
Blender duurtest run #13 38,44
Testconfiguratie
  • Windows benchmarks
Blender duurtest run #14 38,25
Testconfiguratie
  • Windows benchmarks
Blender duurtest run #15 38,3
Testconfiguratie
  • Windows benchmarks
Blender duurtest run #16 372,41
Testconfiguratie
  • Windows benchmarks
Blender duurtest run #17 37,85
Testconfiguratie
  • Windows benchmarks
Blender duurtest run #18 38,18
Testconfiguratie
  • Windows benchmarks
Blender duurtest run #19 38,78
Testconfiguratie
  • Windows benchmarks
Blender duurtest run #20 39,14
Testconfiguratie
  • Windows benchmarks
Blender duurtest run #21 38,13
Testconfiguratie
  • Windows benchmarks
Blender duurtest run #22 38,07
Testconfiguratie
  • Windows benchmarks
PCMark 10 Extended 7.696
Testconfiguratie
  • Windows benchmarks
PCMark 10 Essentials 9.670
Testconfiguratie
  • Windows benchmarks
PCMark 10 App Start-up 14.558
Testconfiguratie
  • Windows benchmarks
PCMark 10 Video Conferencing 6.938
Testconfiguratie
  • Windows benchmarks
PCMark 10 Web Browsing 8.953
Testconfiguratie
  • Windows benchmarks
PCMark 10 Productivity 9.814
Testconfiguratie
  • Windows benchmarks
PCMark 10 Spreadsheets 11.244
Testconfiguratie
  • Windows benchmarks
PCMark 10 Writing 8.567
Testconfiguratie
  • Windows benchmarks
PCMark 10 Digital Content Creation 7.138
Testconfiguratie
  • Windows benchmarks
PCMark 10 Photo Editing 8.614
Testconfiguratie
  • Windows benchmarks
PCMark 10 Rendering and Visualization 8.819
Testconfiguratie
  • Windows benchmarks
PCMark 10 Video Editing 4.788
Testconfiguratie
  • Windows benchmarks
PCMark 10 Gaming 13.995
Testconfiguratie
  • Windows benchmarks
PCMark 10 Graphics 20.608
Testconfiguratie
  • Windows benchmarks
PCMark 10 Physics 14.296
Testconfiguratie
  • Windows benchmarks
PCMark 10 Combined 7.871
Testconfiguratie
  • Windows benchmarks

Energieverbruik / Accu

PCMark Creative accutest - 180 cd/m2 185 min.
Testconfiguratie
  • Windows benchmarks
PCMark Creative (Accu) 5.528
Testconfiguratie
  • Windows benchmarks
PCMark 10 Accu Digital 4.794
Testconfiguratie
  • Windows benchmarks
PCMark 10 Accu Essentials 7.978
Testconfiguratie
  • Windows benchmarks
PCMark 10 Accu Productivity 8.604
Testconfiguratie
  • Windows benchmarks
PCMark 10 Accu Duration in Minuten 89
Testconfiguratie
  • Windows benchmarks
PCMark 10 Accu Aantal Runs 4
Testconfiguratie
  • Windows benchmarks

Testresultaten beeldscherm

Gemeten kleurruimte sRGB
Testconfiguratie
  • Beeldscherm test SpectraCal CALman 5.13
Kleurtemperatuur 6.714 K
Testconfiguratie
  • Beeldscherm test SpectraCal CALman 5.13
Helderheid wit 276 cd/m²
Testconfiguratie
  • Beeldscherm test SpectraCal CALman 5.13
Helderheid zwart 0,32 cd/m²
Testconfiguratie
  • Beeldscherm test SpectraCal CALman 5.13
Contrast 863,3 : 1
Testconfiguratie
  • Beeldscherm test SpectraCal CALman 5.13
Checkerboard wit 278,35 cd/m²
Testconfiguratie
  • Beeldscherm test SpectraCal CALman 5.13
Checkerboard zwart 0,298 cd/m²
Testconfiguratie
  • Beeldscherm test SpectraCal CALman 5.13
Checkerboard contrast 934 : 1
Testconfiguratie
  • Beeldscherm test SpectraCal CALman 5.13
Gamma 2,03
Testconfiguratie
  • Beeldscherm test SpectraCal CALman 5.13
Gamma (afwijking van 2,2) 0,17
Testconfiguratie
  • Beeldscherm test SpectraCal CALman 5.13
Kleurafwijking rood (Delta E 1994) 3,99
Testconfiguratie
  • Beeldscherm test SpectraCal CALman 5 i.c.m. X
  • Rite i1 Display Pro colorimeter
Kleurafwijking groen (Delta E 1994) 8,56
Testconfiguratie
  • Beeldscherm test SpectraCal CALman 5 i.c.m. X
  • Rite i1 Display Pro colorimeter
Kleurafwijking blauw (Delta E 1994) 15,77
Testconfiguratie
  • Beeldscherm test SpectraCal CALman 5 i.c.m. X
  • Rite i1 Display Pro colorimeter
Kleurafwijking cyaan (Delta E 1994) 6,15
Testconfiguratie
  • Beeldscherm test SpectraCal CALman 5 i.c.m. X
  • Rite i1 Display Pro colorimeter
Kleurafwijking magenta (Delta E 1994) 8,68
Testconfiguratie
  • Beeldscherm test SpectraCal CALman 5 i.c.m. X
  • Rite i1 Display Pro colorimeter
Kleurafwijking geel (Delta E 1994) 5,46
Testconfiguratie
  • Beeldscherm test SpectraCal CALman 5 i.c.m. X
  • Rite i1 Display Pro colorimeter
Gemiddelde kleurafwijking (Delta E 1994) 8,1
Testconfiguratie
  • Beeldscherm test SpectraCal CALman 5 i.c.m. X
  • Rite i1 Display Pro colorimeter
Gemiddelde grijsafwijking (Delta E 1994) 3,7
Testconfiguratie
  • Beeldscherm test SpectraCal CALman 5 i.c.m. X
  • Rite i1 Display Pro colorimeter
Kleurafwijking 75% wit (Delta E 2000) 3,32 mΔuv
Testconfiguratie
  • Beeldscherm test SpectraCal CALman 5 i.c.m. X
  • Rite i1 Display Pro colorimeter
Kleurafwijking 75% rood (Delta E 2000) 4,55 mΔuv
Testconfiguratie
  • Beeldscherm test SpectraCal CALman 5 i.c.m. X
  • Rite i1 Display Pro colorimeter
Kleurafwijking 75% groen (Delta E 2000) 8,11 mΔuv
Testconfiguratie
  • Beeldscherm test SpectraCal CALman 5 i.c.m. X
  • Rite i1 Display Pro colorimeter
Kleurafwijking 75% blauw (Delta E 2000) 16,28 mΔuv
Testconfiguratie
  • Beeldscherm test SpectraCal CALman 5 i.c.m. X
  • Rite i1 Display Pro colorimeter
Kleurafwijking 75% cyaan (Delta E 2000) 6,74 mΔuv
Testconfiguratie
  • Beeldscherm test SpectraCal CALman 5 i.c.m. X
  • Rite i1 Display Pro colorimeter
Kleurafwijking 75% magenta (Delta E 2000) 9,15 mΔuv
Testconfiguratie
  • Beeldscherm test SpectraCal CALman 5 i.c.m. X
  • Rite i1 Display Pro colorimeter
Kleurafwijking 75% geel (Delta E 2000) 5,72 mΔuv
Testconfiguratie
  • Beeldscherm test SpectraCal CALman 5 i.c.m. X
  • Rite i1 Display Pro colorimeter
Gemiddelde kleurafwijking (Delta E 2000) 7,4 mΔuv
Testconfiguratie
  • Beeldscherm test SpectraCal CALman 5.13
Kleurafwijking 100% wit (Delta E 2000) 5,11 mΔuv
Testconfiguratie
  • Beeldscherm test SpectraCal CALman 5 i.c.m. X
  • Rite i1 Display Pro colorimeter
Gemiddelde kleurafwijking excl. wit (Delta E 2000) 8,4
Testconfiguratie
  • Beeldscherm test SpectraCal CALman 5 i.c.m. X
  • Rite i1 Display Pro colorimeter
Gemiddelde grijsafwijking (Delta E 2000) 3,7 mΔuv
Testconfiguratie
  • Beeldscherm test SpectraCal CALman 5.13
sRGB dekking 64,4 %
Testconfiguratie
  • Beeldscherm test SpectraCal CALman 5.13
DCI-P3 dekking 47,8 %
Testconfiguratie
  • Beeldscherm test SpectraCal CALman 5.13
Rec 2020 dekking 34,4 %
Testconfiguratie
  • Beeldscherm test SpectraCal CALman 5.13

Alternatieven

HP Omen 16-b1890nd (6G8B0EA)

  • Intel Core i7 12700H
  • 16 GB
  • 16.1 inch
  • 2560x1440
  • Nvidia GeForce RTX 3070
  • 1024 GB
  • Qwerty
  • 2.285 kg
  • Windows
 

HP Victus 16-e0685nd

  • AMD Ryzen 5 5600H
  • 16 GB
  • 16.1 inch
  • 1920x1080
  • Nvidia GeForce RTX 3050
  • 512 GB
  • Qwerty
  • 2.39 kg
  • Windows
 

Lenovo Legion 5 Pro (82RF0009US)

  • Intel Core i7 12700H
  • 16 GB
  • 16 inch
  • 2560x1600
  • Nvidia GeForce RTX 3060
  • 2048 GB
  • Qwerty
  • 2.55 kg
  • Windows
 

Asus Asus RoG Strix Scar G733C

  • Intel Core i9 12950HX
  • 32 GB
  • 17.3 inch
  • Nvidia GeForce RTX 3080 Ti
  • 4096 GB
  • Qwerty
  • Windows
 

Alienware x17 P48E002

  • Intel Core i7 12700H
  • 32 GB
  • 17.3 inch
  • 1920x1080
  • Nvidia GeForce RTX 3080 Max-Q Design
  • 1024 GB
  • Qwerty
  • 3.05 kg
  • Windows
 

MSI Stealth GS77 12UHS-032NL

  • Intel Core i9 12900H
  • 64 GB
  • 17.3 inch
  • 3840x2160
  • Nvidia GeForce RTX 3080 Ti
  • 2048 GB
  • Qwerty
  • 2.91 kg
  • Windows Pro
 

Asus RoG Zephyrus G14 GA402RK-L8032X

  • AMD Ryzen 9 6900HS
  • 32 GB
  • 14 inch
  • 2560x1600
  • AMD Radeon RX 6800S
  • 1024 GB
  • Qwerty
  • 1.7 kg
 

Asus RoG Zephyrus Duo 16 GX650RX-LO080W

  • AMD Ryzen 9 6980HX
  • 32 GB
  • 16 inch
  • 2560x1600
  • Touchscreen
  • Nvidia GeForce RTX 3080 Max-P Design
  • 2048 GB
  • Qwerty
  • 2.60 kg
  • Windows
 

Asus VivoBook Pro 14X N7400PC-KM010W

  • Intel Core i7 11370H
  • 16 GB
  • 14 inch
  • 2880x1800
  • Nvidia GeForce RTX 3050
  • 1024 GB
  • Qwerty
  • 1.50 kg
  • Windows
 

Asus TUF Gaming A15 FA507NV-LP066W

  • AMD Ryzen 7 7735HS
  • 16 GB
  • 15.6 inch
  • 1920x1080
  • Nvidia GeForce RTX 4060 Laptop GPU
  • 512 GB
  • Qwerty
  • 2.1 kg
  • Windows
 

Asus RoG Strix G15 G513IE-HN004W

  • AMD Ryzen 7 4800H
  • 16 GB
  • 15.6 inch
  • 1920x1080
  • Nvidia GeForce RTX 3050 Ti
  • 512 GB
  • Qwerty
  • 2.1 kg
  • Windows
 

HP Pavilion Gaming 15-ec2747nd (4P6K4EA)

  • AMD Ryzen 5 5600H
  • 16 GB
  • 15.6 inch
  • 1920x1080
  • Nvidia GeForce RTX 3050
  • 512 GB
  • Qwerty
  • 2.09 kg
  • Windows
 
0