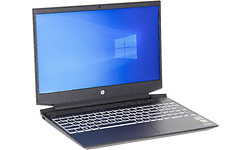
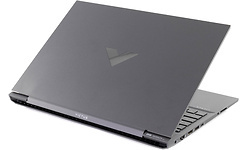
HP Victus 16-e0685nd


Dit product is niet (meer) verkrijgbaar bij de bij Hardware Info aangesloten shops.
| Processor type | AMD Ryzen 5 5600H |
| Geheugen capaciteit | 16 GB |
| Scherm diagonaal | 16,1 inch |
| Resolutie | 1920x1080 |
| Touchscreen | |
| GPU type | Nvidia GeForce RTX 3050 |
| Totale opslagcapaciteit | 512 GB |
| Toetsenbordindeling | Qwerty |
| Gewicht totaal | 2,39 kg |
| Besturingssysteem (serie) | Windows |
| Processor serie | AMD Ryzen 5 |
| Processor type | AMD Ryzen 5 5600H |
| Processor klokfrequentie | 3,3 GHz |
| Processor klokfrequentie (max. turbo) | 4,2 GHz |
| Aantal processorcores | 6 |
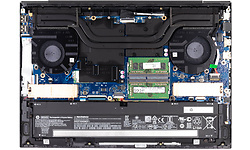
| Geheugen capaciteit | 16 GB |
| Type geheugen | DDR4 |
| Geheugen klokfrequentie | 3.200 MHz |
| Geheugen form factor | Sodimm |
| SODIMM sloten | 2 |
| Vrije SODIMM sloten | 0 |
| Werkgeheugen uitbreidbaar tot | 16 GB |
| Scherm diagonaal | 16,1 inch |
| Resolutie | 1920x1080 |
| Verhouding | 16:9 |
| Pixeldichtheid | 137 ppi |
| Scherm type (mat/glans) | Mat |
| Paneeltype | IPS |
| LED-achtergrondverlichting | |
| Touchscreen | |
| Maximale verversingsfrequentie | 144 Hz |
| GPU type | Nvidia GeForce RTX 3050 |
| Geïntegreerde / losse GPU | Losse chip |
| Videogeheugen | 4 GB |
| Totale opslagcapaciteit | 512 GB |
| SSD opslagcapaciteit | 512 GB |
| Beschikbaar opslaggeheugen | 413,8 GB |
| Aantal harddisks / SSD's | 1 |
| Harddisk/SSD 1 capaciteit | 512 GB |
| Harddisk/SSD 1 soort | SSD/Flash |
| Harddisk/SSD 1 form factor | M.2 |
| Harddisk/SSD 1 merk/product | WDC PC SN730 SDBPNTY-512G-1006 |
| DVD branden | |
| Blu-ray lezen | |
| Blu-ray branden |
| Netwerkaansluiting (bedraad) | |
| Netwerkadapter (bedraad) | Realtek Gaming GBE Family Controller |
| Netwerksnelheid (bedraad) | 1000 Mbit/s |
| WiFi standaard | 802.11ax (Wi-Fi 6) |
| WiFi adapter | Realtek RTL8852AE WiFi 6 802.11ax PCIe Adapter |
| Bluetooth | |
| Bluetooth-versie | Bluetooth 5.2 |
| 4G (LTE) | |
| 5G |
| Smartcard | |
| USB 3.2 - 5 Gb/s (Type-A) | 2 |
| USB 3.2 - 10 Gb/s (Type-A) | 1 |
| USB 3.2 - 10 Gb/s (Type-C) | 1 |
| Cardreader - SD | |
| Cardreader - MicroSD | |
| DVI-uitgang | |
| VGA-uitgang | |
| HDMI-uitgang | |
| Aantal HDMI-uitgangen | 1 |
| Micro HDMI-uitgang | |
| HDMI-versie | 2.1 |
| DisplayPort-uitgang | |
| Mini DisplayPort-uitgang | |
| Analoge audio aansluitingen | 1 |
| Aansluiting dockingstation | |
| Kensingtonslot |
| Toetsenbordindeling | Qwerty |
| Numeriek toetsenbord | |
| Toetsenbordverlichting helderheidsniveaus | 1 |
| Toetsenbordverlichting kleur | Wit |
| Touchpad MS Precision compatible | |
| Touchpad afzonderlijke muistoetsen |
| Webcam | |
| Webcam resolutie | 0,9 MPixel |
| Tweede camera | |
| Flitser | |
| Camera Windows Hello compatible | |
| Webcamschuifje |
| Accelerometer | |
| Vingerafdruklezer | |
| NFC |
| Trusted Platform Module (TPM) | |
| Geïntegreerde microfoon |
| Accu capaciteit (Wh) | 70 Wh |
| Verwisselbare accu | |
| Gewicht totaal | 2,39 kg |
| Afmeting - Breedte | 37 cm |
| Afmeting - Diepte | 26 cm |
| Afmeting - Hoogte/Dikte | 2,35 cm |
| Passief gekoeld |
| Besturingssysteem | Microsoft Windows 10 Home |
| Besturingssysteem (serie) | Windows |
| Windows versie | 20H2 |
| Windows OS Build | 19.042,135 |
| Aantal bits OS | 64 bit |
| Garantie | 2 jaar |
| SKU | 4B729EA#ABH | |
| EAN | 0196068532666 | |
| Toegevoegd aan Hardware Info | vrijdag 5 november 2021 |
| PCMark 10 - Gebruiken Adobe Photoshop Heavy | 588 |
Testconfiguratie
|
|
| PCMark 10 - Storage - Totaalscore - Toegangstijd | 102 |
Testconfiguratie
|
|
| PCMark 10 - Storage - Totaalscore - Bandbreedte | 265,45 |
|
|
| PCMark 10 - Storage - Totaalscore | 1.651 |
Testconfiguratie
|
|
| PCMark 10 - 2.37GB_(399_JPEGs)_leestest | 294 |
|
|
| PCMark 10 - 2.37GB_(399_JPEGs)_kopieertest | 457 |
Testconfiguratie
|
|
| PCMark 10 - 2.37GB_(399_JPEGs)_schrijftest | 270 |
Testconfiguratie
|
|
| PCMark 10 - 2GB_(4_ISOs)_leestest | 1.804 |
Testconfiguratie
|
|
| PCMark 10 - 2GB_(4_ISOs)_kopieertest | 1.503 |
Testconfiguratie
|
|
| PCMark 10 - 2GB_(4_ISOs)_schrijftest | 1.732 |
Testconfiguratie
|
|
| PCMark 10 - Gebruiken Microsoft PowerPoint | 99 |
Testconfiguratie
|
|
| PCMark 10 - Gebruiken Microsoft Excel | 93 |
Testconfiguratie
|
|
| PCMark 10 - Gebruiken Adobe Photoshop Light | 180 |
Testconfiguratie
|
|
| PCMark 10 - Starten Windows 10 | 238 |
Testconfiguratie
|
|
| PCMark 10 - Gebruiken Adobe InDesign | 150 |
Testconfiguratie
|
|
| PCMark 10 - Gebruiken Adobe Illustrator | 144 |
|
|
| PCMark 10 - Gebruiken Adobe After Effects | 289 |
Testconfiguratie
|
|
| PCMark 10 - Starten Overwatch | 237 |
Testconfiguratie
|
|
| PCMark 10 - Starten Call of Duty: Black Ops 4 | 404 |
Testconfiguratie
|
|
| PCMark 10 - Starten Battlefield V | 494 |
Testconfiguratie
|
|
| PCMark 10 - Starten Adobe Photoshop | 134 |
Testconfiguratie
|
|
| PCMark 10 - Starten Adobe Lightroom | 98 |
Testconfiguratie
|
|
| PCMark 10 - Starten Adobe Premiere_Pro | 157 |
Testconfiguratie
|
|
| PCMark 10 - Starten Adobe Illustrator | 109 |
Testconfiguratie
|
|
| PCMark 10 - Starten Adobe After Effects | 137 |
Testconfiguratie
|
|
| PCMark 10 - Starten Adobe Acrobat | 147 |
Testconfiguratie
|
|
| PCMark 10 - Quick Storage - Totaalscore | 1.718 |
Testconfiguratie
|
|
| PCMark 10 - Quick Storage - Totaalscore - Bandbreedte | 211,03 |
Testconfiguratie
|
|
| PCMark 10 - Quick Storage - Totaalscore - Toegangstijd | 75 |
Testconfiguratie
|