Razer Blade 14 (RZ09-0482XEH3-R3U1)


| Processor type | AMD Ryzen 9 7940HS |
| Geheugen capaciteit | 16 GB |
| Scherm diagonaal | 14 inch |
| Resolutie | 2560x1600 |
| Touchscreen | |
| GPU type | Nvidia GeForce RTX 4070 Laptop GPU |
| Totale opslagcapaciteit | 1.024 GB |
| Toetsenbordindeling | Qwerty |
| Gewicht totaal | 1,86 kg |
| Besturingssysteem (serie) | Windows |
| Processor serie | AMD Ryzen 9 |
| Processor type | AMD Ryzen 9 7940HS |
| Processor klokfrequentie | 4 GHz |
| Processor klokfrequentie (max. turbo) | 5,2 GHz |
| Configureerbare TDP-down | 35 W |
| Configureerbare TDP-up | 54 W |
| Aantal processorcores | 8 |
| Geheugen capaciteit | 16 GB |
| Type geheugen | DDR5 |
| Geheugen klokfrequentie | 5.600 MHz |
| Geheugen form factor | Sodimm |
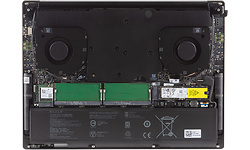
| SODIMM sloten | 2 |
| Vrije SODIMM sloten | 0 |
| Werkgeheugen uitbreidbaar tot | 64 GB |
| Scherm diagonaal | 14 inch |
| Resolutie | 2560x1600 |
| Verhouding | 16:10 |
| Pixeldichtheid | 216 ppi |
| Scherm type (mat/glans) | Mat |
| Paneeltype | IPS |
| Touchscreen | |
| Maximale verversingsfrequentie | 240 Hz |
| GPU type | Nvidia GeForce RTX 4070 Laptop GPU |
| Geïntegreerde / losse GPU | Losse chip |
| Videogeheugen | 8 GB |
| Totale opslagcapaciteit | 1.024 GB |
| SSD opslagcapaciteit | 1.024 GB |
| Beschikbaar opslaggeheugen | 877,1 GB |
| Aantal harddisks / SSD's | 1 |
| Harddisk/SSD 1 capaciteit | 877,1 GB |
| Harddisk/SSD 1 soort | SSD/Flash |
| Harddisk/SSD 1 form factor | M.2 |
| Harddisk/SSD 1 merk/product | Samsung MZVL21T0HCLR-00B00 |
| DVD branden | |
| Blu-ray lezen | |
| Blu-ray branden |
| Netwerkaansluiting (bedraad) | |
| WiFi standaard | 802.11ax (Wi-Fi 6E) |
| WiFi adapter | Qualcomm WCN685x Wi-Fi 6E Dual Band Stimultaneous |
| Bluetooth | |
| Bluetooth-versie | Bluetooth 5.3 |
| 4G (LTE) | |
| 5G |
| Smartcard | |
| USB 3.2 - 10 Gb/s (Type-A) | 2 |
| USB 4.0 - 40 Gb/s (Type-C) | 2,0 |
| Cardreader - SD | |
| Cardreader - MicroSD | |
| DVI-uitgang | |
| VGA-uitgang | |
| HDMI-uitgang | |
| Aantal HDMI-uitgangen | 1 |
| Micro HDMI-uitgang | |
| HDMI-versie | 2.1 |
| DisplayPort-uitgang | |
| Mini DisplayPort-uitgang | |
| Analoge audio aansluitingen | 1 |
| Aansluiting dockingstation | |
| Kensingtonslot |
| Toetsenbordindeling | Qwerty |
| Numeriek toetsenbord | |
| Toetsenbordverlichting helderheidsniveaus | 100 |
| Toetsenbordverlichting kleur | RGB |
| Touchpad afzonderlijke muistoetsen |
| Webcam | |
| Webcam resolutie | 2,1 MPixel |
| Tweede camera | |
| Flitser | |
| Camera Windows Hello compatible | |
| Webcamschuifje |
| Accelerometer | |
| Vingerafdruklezer | |
| NFC |
| Trusted Platform Module (TPM) | |
| Geïntegreerde microfoon |
| Accu capaciteit (Wh) | 68,1 Wh |
| Verwisselbare accu | |
| Gewicht totaal | 1,86 kg |
| Afmeting - Breedte | 31,3 cm |
| Afmeting - Diepte | 22,8 cm |
| Afmeting - Hoogte/Dikte | 1,92 cm |
| Passief gekoeld |
| Besturingssysteem | Microsoft Windows 11 Home |
| Besturingssysteem (serie) | Windows |
| Windows versie | 22H2 |
| Windows OS Build | 22.621,185 |
| Aantal bits OS | 64 bit |
| Garantie | 1 jaar |
| SKU | RZ09-0482XEH3-R3U1 | |
| EAN | 8887910010051 | |
| Toegevoegd aan Hardware Info | dinsdag 20 juni 2023 |
| PCMark 10 - Gebruiken Adobe Photoshop Heavy | 787 |
Testconfiguratie
|
|
| PCMark 10 - Storage - Totaalscore - Toegangstijd | 65 |
Testconfiguratie
|
|
| PCMark 10 - Storage - Totaalscore - Bandbreedte | 394,79 |
|
|
| PCMark 10 - Storage - Totaalscore | 2.523 |
Testconfiguratie
|
|
| PCMark 10 - 2.37GB_(399_JPEGs)_leestest | 485 |
|
|
| PCMark 10 - 2.37GB_(399_JPEGs)_kopieertest | 730 |
Testconfiguratie
|
|
| PCMark 10 - 2.37GB_(399_JPEGs)_schrijftest | 477 |
Testconfiguratie
|
|
| PCMark 10 - 2GB_(4_ISOs)_leestest | 3.819 |
Testconfiguratie
|
|
| PCMark 10 - 2GB_(4_ISOs)_kopieertest | 3.239 |
Testconfiguratie
|
|
| PCMark 10 - 2GB_(4_ISOs)_schrijftest | 2.946 |
Testconfiguratie
|
|
| PCMark 10 - Gebruiken Microsoft PowerPoint | 107 |
Testconfiguratie
|
|
| PCMark 10 - Gebruiken Microsoft Excel | 136 |
Testconfiguratie
|
|
| PCMark 10 - Gebruiken Adobe Photoshop Light | 242 |
Testconfiguratie
|
|
| PCMark 10 - Starten Windows 10 | 361 |
Testconfiguratie
|
|
| PCMark 10 - Gebruiken Adobe InDesign | 170 |
Testconfiguratie
|
|
| PCMark 10 - Gebruiken Adobe Illustrator | 199 |
|
|
| PCMark 10 - Gebruiken Adobe After Effects | 372 |
Testconfiguratie
|
|
| PCMark 10 - Starten Overwatch | 329 |
Testconfiguratie
|
|
| PCMark 10 - Starten Call of Duty: Black Ops 4 | 796 |
Testconfiguratie
|
|
| PCMark 10 - Starten Battlefield V | 769 |
Testconfiguratie
|
|
| PCMark 10 - Starten Adobe Photoshop | 182 |
Testconfiguratie
|
|
| PCMark 10 - Starten Adobe Lightroom | 129 |
Testconfiguratie
|
|
| PCMark 10 - Starten Adobe Premiere_Pro | 231 |
Testconfiguratie
|
|
| PCMark 10 - Starten Adobe Illustrator | 140 |
Testconfiguratie
|
|
| PCMark 10 - Starten Adobe After Effects | 190 |
Testconfiguratie
|
|
| PCMark 10 - Starten Adobe Acrobat | 220 |
Testconfiguratie
|
|
| PCMark 10 - Quick Storage - Totaalscore | 2.667 |
Testconfiguratie
|
|
| PCMark 10 - Quick Storage - Totaalscore - Bandbreedte | 318,83 |
Testconfiguratie
|
|
| PCMark 10 - Quick Storage - Totaalscore - Toegangstijd | 47 |
Testconfiguratie
|