Getest

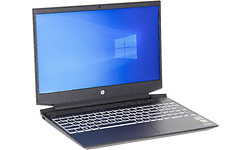
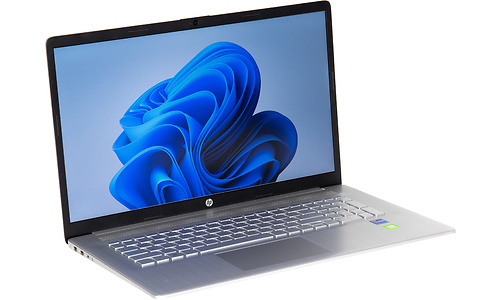
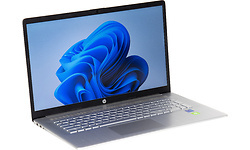
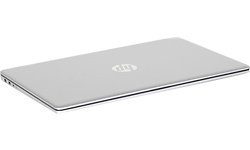
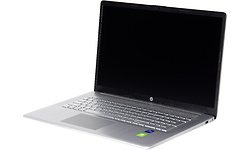
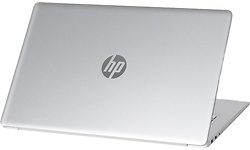
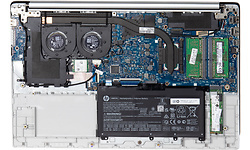
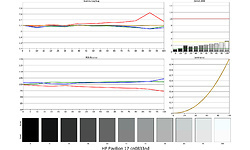
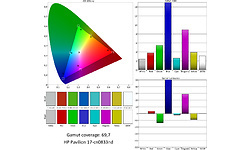
HP Pavilion 17-cn0833nd

Prijsverloop

Dit product is niet (meer) verkrijgbaar bij de bij Hardware Info aangesloten shops.

Specificaties

Belangrijkste specificaties

Processor type Intel Core i7 1165G7
Geheugen capaciteit 8 GB
Scherm diagonaal 17,3 inch
Resolutie 1920x1080
Touchscreen
GPU type Nvidia GeForce MX450
Totale opslagcapaciteit 512 GB
Toetsenbordindeling Qwerty
Gewicht totaal 2,15 kg
Besturingssysteem (serie) Windows

Processor / Chipset / Geheugen

Processor serie Intel Core i7
Processor type Intel Core i7 1165G7
Processor klokfrequentie 2,8 GHz
Processor klokfrequentie (max. turbo) 4,7 GHz
Configureerbare TDP-down 12 W
Configureerbare TDP-up 28 W
Configureerbare TDP-downfrequentie 1 GHz
Configureerbare TDP-upfrequentie 3 GHz
Aantal processorcores 4
Geheugen capaciteit 8 GB
Type geheugen DDR4
Geheugen klokfrequentie 3.200 MHz
Geheugen form factor Sodimm
SODIMM sloten 2
Vrije SODIMM sloten 0

Scherm

Scherm diagonaal 17,3 inch
Resolutie 1920x1080
Verhouding 16:9
Pixeldichtheid 127 ppi
Scherm type (mat/glans) Mat
Paneeltype IPS
LED-achtergrondverlichting
Touchscreen
Maximale verversingsfrequentie 60 Hz

Graphics

GPU type Nvidia GeForce MX450
Geïntegreerde / losse GPU Losse chip
Videogeheugen 2 GB

Opslag

Totale opslagcapaciteit 512 GB
SSD opslagcapaciteit 512 GB
Beschikbaar opslaggeheugen 430,9 GB
Aantal harddisks / SSD's 1
Harddisk/SSD 1 capaciteit 512 GB
Harddisk/SSD 1 soort SSD/Flash
Harddisk/SSD 1 form factor M.2
Harddisk/SSD 1 merk/product Intel SSDPEKNW512G8H
DVD branden
Blu-ray lezen
Blu-ray branden

Connectiviteit / Netwerk

Netwerkaansluiting (bedraad)
WiFi standaard 802.11ac (Wi-Fi 5)
WiFi adapter Realtek 8822CE Wireless LAN 802.11ac PCI-E NIC
Bluetooth
Bluetooth-versie Bluetooth 5.1
4G (LTE)
5G

Aansluitingen

Smartcard
USB 3.2 - 5 Gb/s (Type-A) 3
USB 3.2 - 5 Gb/s (Type-C) 1
Cardreader - SD
Cardreader - MicroSD
DVI-uitgang
VGA-uitgang
HDMI-uitgang
Aantal HDMI-uitgangen 1
Micro HDMI-uitgang
HDMI-versie 1.4b
DisplayPort-uitgang
Mini DisplayPort-uitgang
Analoge audio aansluitingen 1
Aansluiting dockingstation
Kensingtonslot

Toetsenbord en touchpad

Toetsenbordindeling Qwerty
Numeriek toetsenbord
Touchpad afzonderlijke muistoetsen

Camera

Webcam
Webcam resolutie 0,9 MPixel
Tweede camera
Flitser
Camera Windows Hello compatible
Webcamschuifje

Sensors

Accelerometer
Vingerafdruklezer
NFC

Overige hardware

Trusted Platform Module (TPM)
Geïntegreerde microfoon

Maten en gewichten

Accu capaciteit (Wh) 40,7 Wh
Verwisselbare accu
Gewicht totaal 2,15 kg
Afmeting - Breedte 40 cm
Afmeting - Diepte 25,9 cm
Afmeting - Hoogte/Dikte 2,25 cm
Passief gekoeld

Software

Besturingssysteem Microsoft Windows 11 Home
Besturingssysteem (serie) Windows
Windows versie 21H2
Windows OS Build 22.000,675
Aantal bits OS 64 bit

Fabrikantsopgave eigenschappen

Garantie 1 jaar

Productcodes

SKU 471R1EA#ABH
EAN 0196068148980
Toegevoegd aan Hardware Info donderdag 5 mei 2022

Testresultaten

Dit product is door Hardware Info getest op woensdag 25 mei 2022.

Metro Exodus

Metro Exodus - 1920x1080 - Medium 15,6 fps
Testconfiguratie
  • Game benchmarks 2022
Metro Exodus - 1920x1080 - Medium (99p) 149,15 ms
Testconfiguratie
  • Game benchmarks 2022
Metro Exodus - 1920x1080 - Medium (99.9p) 190,44 ms
Testconfiguratie
  • Game benchmarks 2022
Metro Exodus - 1920x1080 - Ultra 4 fps
Testconfiguratie
  • Game benchmarks 2022
Metro Exodus - 1920x1080 - Ultra (99p) 475,15 ms
Testconfiguratie
  • Game benchmarks 2022
Metro Exodus - 1920x1080 - Ultra (99.9p) 0 ms
Testconfiguratie
  • Game benchmarks 2022
Metro Exodus - 2560x1440 - Medium 4,4 fps
Testconfiguratie
  • Game benchmarks 2022
Metro Exodus - 2560x1440 - Medium (99p) 428,43 ms
Testconfiguratie
  • Game benchmarks 2022
Metro Exodus - 2560x1440 - Medium (99.9p) 469,54 ms
Testconfiguratie
  • Game benchmarks 2022

Total War: Troy

Total War: Troy - 1920x1080 - Medium 49,4 fps
Testconfiguratie
  • Game benchmarks 2022
Total War: Troy - 1920x1080 - Medium (99p) 24,1 ms
Testconfiguratie
  • Game benchmarks 2022
Total War: Troy - 1920x1080 - Medium (99.9p) 25,38 ms
Testconfiguratie
  • Game benchmarks 2022
Total War: Troy - 1920x1080 - Ultra 25,8 fps
Testconfiguratie
  • Game benchmarks 2022
Total War: Troy - 1920x1080 - Ultra (99p) 47,88 ms
Testconfiguratie
  • Game benchmarks 2022
Total War: Troy - 1920x1080 - Ultra (99.9p) 50,78 ms
Testconfiguratie
  • Game benchmarks 2022
Total War: Troy - 2560x1440 - Medium 33,6 fps
Testconfiguratie
  • Game benchmarks 2022
Total War: Troy - 2560x1440 - Medium (99p) 34,49 ms
Testconfiguratie
  • Game benchmarks 2022
Total War: Troy - 2560x1440 - Medium (99.9p) 40,06 ms
Testconfiguratie
  • Game benchmarks 2022
Total War: Troy - 2560x1440 - Ultra 17,8 fps
Testconfiguratie
  • Game benchmarks 2022
Total War: Troy - 2560x1440 - Ultra (99p) 67,69 ms
Testconfiguratie
  • Game benchmarks 2022
Total War: Troy - 2560x1440 - Ultra (99.9p) 73,89 ms
Testconfiguratie
  • Game benchmarks 2022

Far Cry: New Dawn

Far Cry: New Dawn - 1920x1080 - Medium 37,2 fps
Testconfiguratie
  • Game benchmarks 2022
Far Cry: New Dawn - 1920x1080 - Medium (99p) 105,32 ms
Testconfiguratie
  • Game benchmarks 2022
Far Cry: New Dawn - 1920x1080 - Medium (99.9p) 130,9 ms
Testconfiguratie
  • Game benchmarks 2022
Far Cry: New Dawn - 1920x1080 - Ultra 28,3 fps
Testconfiguratie
  • Game benchmarks 2022
Far Cry: New Dawn - 1920x1080 - Ultra (99p) 109,75 ms
Testconfiguratie
  • Game benchmarks 2022
Far Cry: New Dawn - 1920x1080 - Ultra (99.9p) 138,67 ms
Testconfiguratie
  • Game benchmarks 2022
Far Cry: New Dawn - 2560x1440 - Medium 25,2 fps
Testconfiguratie
  • Game benchmarks 2022
Far Cry: New Dawn - 2560x1440 - Medium (99p) 60,24 ms
Testconfiguratie
  • Game benchmarks 2022
Far Cry: New Dawn - 2560x1440 - Medium (99.9p) 134,46 ms
Testconfiguratie
  • Game benchmarks 2022
Far Cry: New Dawn - 2560x1440 - Ultra 20,4 fps
Testconfiguratie
  • Game benchmarks 2022
Far Cry: New Dawn - 2560x1440 - Ultra (99p) 109,2 ms
Testconfiguratie
  • Game benchmarks 2022
Far Cry: New Dawn - 2560x1440 - Ultra (99.9p) 148,93 ms
Testconfiguratie
  • Game benchmarks 2022

F1 2020

F1 2020 (DX12) - 1920x1080 - Medium 65,4 fps
Testconfiguratie
  • Game benchmarks 2022
F1 2020 (DX12) - 1920x1080 - Medium (99p) 19,7 ms
Testconfiguratie
  • Game benchmarks 2022
F1 2020 (DX12) - 1920x1080 - Medium (99.9p) 28 ms
Testconfiguratie
  • Game benchmarks 2022
F1 2020 (DX12) - 1920x1080 - Ultra 37,8 fps
Testconfiguratie
  • Game benchmarks 2022
F1 2020 (DX12) - 1920x1080 - Ultra (99p) 32,9 ms
Testconfiguratie
  • Game benchmarks 2022
F1 2020 (DX12) - 1920x1080 - Ultra (99.9p) 78,1 ms
Testconfiguratie
  • Game benchmarks 2022
F1 2020 (DX12) - 2560x1440 - Medium 43,5 fps
Testconfiguratie
  • Game benchmarks 2022
F1 2020 (DX12) - 2560x1440 - Medium (99p) 30,4 ms
Testconfiguratie
  • Game benchmarks 2022
F1 2020 (DX12) - 2560x1440 - Medium (99.9p) 33,3 ms
Testconfiguratie
  • Game benchmarks 2022
F1 2020 (DX12) - 2560x1440 - Ultra 24,4 fps
Testconfiguratie
  • Game benchmarks 2022
F1 2020 (DX12) - 2560x1440 - Ultra (99p) 59,1 ms
Testconfiguratie
  • Game benchmarks 2022
F1 2020 (DX12) - 2560x1440 - Ultra (99.9p) 129,3 ms
Testconfiguratie
  • Game benchmarks 2022
F1 2020 (DX12) - 3840x2160 - Medium 22,8 fps
Testconfiguratie
  • Game benchmarks 2022
F1 2020 (DX12) - 3840x2160 - Medium (99p) 51,9 ms
Testconfiguratie
  • Game benchmarks 2022
F1 2020 (DX12) - 3840x2160 - Medium (99.9p) 145,3 ms
Testconfiguratie
  • Game benchmarks 2022
F1 2020 (DX12) - 3840x2160 - Ultra 10,6 fps
Testconfiguratie
  • Game benchmarks 2022
F1 2020 (DX12) - 3840x2160 - Ultra (99p) 137,5 ms
Testconfiguratie
  • Game benchmarks 2022
F1 2020 (DX12) - 3840x2160 - Ultra (99.9p) 196 ms
Testconfiguratie
  • Game benchmarks 2022

Geluidstest

Noise floor 14 dB(A)
Testconfiguratie
  • Geluidsdichte ruimte 2021
  • Larson Davis SoundAdvisor Model 831C
Afstand geluidsmeting 50 cm
Testconfiguratie
  • Geluidsdichte ruimte 2021
  • Larson Davis SoundAdvisor Model 831C
WebXPRT 3 - LAeq 14 dB
Testconfiguratie
  • Geluidsdichte ruimte 2021
  • Larson Davis SoundAdvisor Model 831C
PCMark 10 Express - LAeq 31,5 dB
Testconfiguratie
  • Geluidsdichte ruimte 2021
  • Larson Davis SoundAdvisor Model 831C
Blender - LAeq 34 dB
Testconfiguratie
  • Geluidsdichte ruimte 2021
  • Larson Davis SoundAdvisor Model 831C
F1 2020 - LAeq 41,3 dB
Testconfiguratie
  • Geluidsdichte ruimte 2021
  • Larson Davis SoundAdvisor Model 831C

PCMark 10 Storage

PCMark 10 - Gebruiken Adobe Photoshop Heavy 358
Testconfiguratie
  • Windows benchmarks
PCMark 10 - Storage - Totaalscore - Toegangstijd 122
Testconfiguratie
  • Windows benchmarks
PCMark 10 - Storage - Totaalscore - Bandbreedte 226,08
PCMark 10 - Storage - Totaalscore 1.393
Testconfiguratie
  • Windows benchmarks
PCMark 10 - 2.37GB_(399_JPEGs)_leestest 304
PCMark 10 - 2.37GB_(399_JPEGs)_kopieertest 233
Testconfiguratie
  • Windows benchmarks
PCMark 10 - 2.37GB_(399_JPEGs)_schrijftest 201
Testconfiguratie
  • Windows benchmarks
PCMark 10 - 2GB_(4_ISOs)_leestest 1.096
Testconfiguratie
  • Windows benchmarks
PCMark 10 - 2GB_(4_ISOs)_kopieertest 787
Testconfiguratie
  • Windows benchmarks
PCMark 10 - 2GB_(4_ISOs)_schrijftest 882
Testconfiguratie
  • Windows benchmarks
PCMark 10 - Gebruiken Microsoft PowerPoint 122
Testconfiguratie
  • Windows benchmarks
PCMark 10 - Gebruiken Microsoft Excel 104
Testconfiguratie
  • Windows benchmarks
PCMark 10 - Gebruiken Adobe Photoshop Light 163
Testconfiguratie
  • Windows benchmarks
PCMark 10 - Starten Windows 10 242
Testconfiguratie
  • Windows benchmarks
PCMark 10 - Gebruiken Adobe InDesign 138
Testconfiguratie
  • Windows benchmarks
PCMark 10 - Gebruiken Adobe Illustrator 133
PCMark 10 - Gebruiken Adobe After Effects 255
Testconfiguratie
  • Windows benchmarks
PCMark 10 - Starten Overwatch 251
Testconfiguratie
  • Windows benchmarks
PCMark 10 - Starten Call of Duty: Black Ops 4 443
Testconfiguratie
  • Windows benchmarks
PCMark 10 - Starten Battlefield V 482
Testconfiguratie
  • Windows benchmarks
PCMark 10 - Starten Adobe Photoshop 131
Testconfiguratie
  • Windows benchmarks
PCMark 10 - Starten Adobe Lightroom 106
Testconfiguratie
  • Windows benchmarks
PCMark 10 - Starten Adobe Premiere_Pro 128
Testconfiguratie
  • Windows benchmarks
PCMark 10 - Starten Adobe Illustrator 111
Testconfiguratie
  • Windows benchmarks
PCMark 10 - Starten Adobe After Effects 113
Testconfiguratie
  • Windows benchmarks
PCMark 10 - Starten Adobe Acrobat 122
Testconfiguratie
  • Windows benchmarks
PCMark 10 - Quick Storage - Totaalscore 1.678
Testconfiguratie
  • Windows benchmarks
PCMark 10 - Quick Storage - Totaalscore - Bandbreedte 209,33
Testconfiguratie
  • Windows benchmarks
PCMark 10 - Quick Storage - Totaalscore - Toegangstijd 78
Testconfiguratie
  • Windows benchmarks

Platform onafhankelijke tests

Opstarttijd 23 sec.
Testconfiguratie
  • Platform onafhankelijke tests
JetStream 2 185,351
Testconfiguratie
  • Platform onafhankelijke tests
webXPRT 3 284
Testconfiguratie
  • Platform onafhankelijke tests
webXPRT 3 - Photo Enhancement 232 ms
Testconfiguratie
  • Platform onafhankelijke tests
webXPRT 3 - Organize Album using AI 1.945 ms
Testconfiguratie
  • Platform onafhankelijke tests
webXPRT 3 - Stock Option Pricing 108 ms
Testconfiguratie
  • Platform onafhankelijke tests
webXPRT 3 - Encrypt Notes and OCR Scan 1.625 ms
Testconfiguratie
  • Platform onafhankelijke tests
webXPRT 3 - Sales Graphs 310 ms
Testconfiguratie
  • Platform onafhankelijke tests
webXPRT 3 - Online Homework 982 ms
Testconfiguratie
  • Platform onafhankelijke tests
Geekbench 5 - Multi 4.667
Testconfiguratie
  • Platform onafhankelijke tests
Geekbench 5 - Multi Crypto 6.061
Testconfiguratie
  • Platform onafhankelijke tests
Geekbench 5 - Multi Integer 4.405
Testconfiguratie
  • Platform onafhankelijke tests
Geekbench 5 - Multi Floating Point 5.002
Testconfiguratie
  • Platform onafhankelijke tests
Geekbench 5 - Single 1.530
Testconfiguratie
  • Platform onafhankelijke tests
Geekbench 5 - Single Crypto 3.291
Testconfiguratie
  • Platform onafhankelijke tests
Geekbench 5 - Single Integer 1.362
Testconfiguratie
  • Platform onafhankelijke tests
Geekbench 5 - Single Floating Point 1.599
Testconfiguratie
  • Platform onafhankelijke tests
Geekbench 5 - OpenCL 29.245
Testconfiguratie
  • Platform onafhankelijke tests
WiFi speedtest 2.4GHz receive 206 Mbit/s
Testconfiguratie
  • Platform onafhankelijke tests
WiFi speedtest 2.4GHz send 195 Mbit/s
Testconfiguratie
  • Platform onafhankelijke tests
WiFi speedtest 5.0GHz receive 638 Mbit/s
Testconfiguratie
  • Platform onafhankelijke tests
WiFi speedtest 5.0GHz send 619 Mbit/s
Testconfiguratie
  • Platform onafhankelijke tests

Windows benchmarks

3DMark - Fire Strike 4.207
Testconfiguratie
  • Windows benchmarks
3DMark - Fire Strike Graphics 4.710
Testconfiguratie
  • Windows benchmarks
3DMark - Fire Strike Physics 8.834
Testconfiguratie
  • Windows benchmarks
3DMark - Fire Strike Combined 1.627
Testconfiguratie
  • Windows benchmarks
3DMark - Time Spy 2.116
Testconfiguratie
  • Windows benchmarks
3DMark - Time Spy Graphics 1.961
Testconfiguratie
  • Windows benchmarks
3DMark - Time Spy CPU 3.852
Testconfiguratie
  • Windows benchmarks
3DMark - Night Raid 17.893
Testconfiguratie
  • Windows benchmarks
3DMark - Night Raid Graphics 24.953
Testconfiguratie
  • Windows benchmarks
3DMark - Night Raid CPU 6.874
Testconfiguratie
  • Windows benchmarks
Cinebench R15 - Single 219
Testconfiguratie
  • Windows benchmarks
Cinebench R15 - Multi 750
Testconfiguratie
  • Windows benchmarks
Cinebench R20 - Single 567
Testconfiguratie
  • Windows benchmarks
Cinebench R20 - Multi 1.170
Testconfiguratie
  • Windows benchmarks
Cinebench R23 - Single 1.485
Testconfiguratie
  • Windows benchmarks
Cinebench R23 - Multi 4.480
Testconfiguratie
  • Windows benchmarks
Blender duurtest run #1 55,92
Testconfiguratie
  • Windows benchmarks
Blender duurtest run #2 62,82
Testconfiguratie
  • Windows benchmarks
Blender duurtest run #3 63,21
Testconfiguratie
  • Windows benchmarks
Blender duurtest run #4 62,96
Testconfiguratie
  • Windows benchmarks
Blender duurtest run #5 62,88
Testconfiguratie
  • Windows benchmarks
Blender duurtest run #6 63,2
Testconfiguratie
  • Windows benchmarks
Blender duurtest run #7 62,88
Testconfiguratie
  • Windows benchmarks
Blender duurtest run #8 62,84
Testconfiguratie
  • Windows benchmarks
Blender duurtest run #9 63,24
Testconfiguratie
  • Windows benchmarks
Blender duurtest run #10 63,12
Testconfiguratie
  • Windows benchmarks
Blender duurtest run #11 62,91
Testconfiguratie
  • Windows benchmarks
Blender duurtest run #12 62,96
Testconfiguratie
  • Windows benchmarks
Blender duurtest run #13 63
Testconfiguratie
  • Windows benchmarks
Blender duurtest run #14 63,33
Testconfiguratie
  • Windows benchmarks
Blender duurtest run #15 63,15
Testconfiguratie
  • Windows benchmarks
Blender duurtest run #16 62,93
Testconfiguratie
  • Windows benchmarks
Blender duurtest run #17 63,22
Testconfiguratie
  • Windows benchmarks
Blender duurtest run #18 63,24
Testconfiguratie
  • Windows benchmarks
Blender duurtest run #19 63,26
Testconfiguratie
  • Windows benchmarks
PCMark 10 Extended 4.690
Testconfiguratie
  • Windows benchmarks
PCMark 10 Essentials 8.687
Testconfiguratie
  • Windows benchmarks
PCMark 10 App Start-up 11.568
Testconfiguratie
  • Windows benchmarks
PCMark 10 Video Conferencing 6.330
Testconfiguratie
  • Windows benchmarks
PCMark 10 Web Browsing 8.955
Testconfiguratie
  • Windows benchmarks
PCMark 10 Productivity 8.777
Testconfiguratie
  • Windows benchmarks
PCMark 10 Spreadsheets 10.067
Testconfiguratie
  • Windows benchmarks
PCMark 10 Writing 7.653
Testconfiguratie
  • Windows benchmarks
PCMark 10 Digital Content Creation 4.814
Testconfiguratie
  • Windows benchmarks
PCMark 10 Photo Editing 5.197
Testconfiguratie
  • Windows benchmarks
PCMark 10 Rendering and Visualization 4.555
Testconfiguratie
  • Windows benchmarks
PCMark 10 Video Editing 4.714
Testconfiguratie
  • Windows benchmarks
PCMark 10 Gaming 3.562
Testconfiguratie
  • Windows benchmarks
PCMark 10 Graphics 4.718
Testconfiguratie
  • Windows benchmarks
PCMark 10 Physics 12.242
Testconfiguratie
  • Windows benchmarks
PCMark 10 Combined 1.591
Testconfiguratie
  • Windows benchmarks

Energieverbruik / Accu

Energieverbruik uit 0,3 W
Testconfiguratie
  • Windows benchmarks
Energieverbruik adapter (zonder laptop) 0 W
Testconfiguratie
  • Windows benchmarks
Energieverbruik idle 12,3 W
Testconfiguratie
  • Windows benchmarks
Browser accutest - 180 cd/m2 362 min.
Testconfiguratie
  • Windows benchmarks
PCMark 10 Accu Digital 3.446
Testconfiguratie
  • Windows benchmarks
PCMark 10 Accu Essentials 6.740
Testconfiguratie
  • Windows benchmarks
PCMark 10 Accu Productivity 7.020
Testconfiguratie
  • Windows benchmarks
PCMark 10 Accu Duration in Minuten 105
Testconfiguratie
  • Windows benchmarks
PCMark 10 Accu Aantal Runs 4
Testconfiguratie
  • Windows benchmarks

Testresultaten beeldscherm

Gemeten kleurruimte sRGB
Testconfiguratie
  • Beeldscherm test SpectraCal CALman 5.13
Kleurtemperatuur 6.844 K
Testconfiguratie
  • Beeldscherm test SpectraCal CALman 5.13
Helderheid wit 251 cd/m²
Testconfiguratie
  • Beeldscherm test SpectraCal CALman 5.13
Helderheid zwart 0,18 cd/m²
Testconfiguratie
  • Beeldscherm test SpectraCal CALman 5.13
Contrast 1.392,6 : 1
Testconfiguratie
  • Beeldscherm test SpectraCal CALman 5.13
Checkerboard wit 249,535 cd/m²
Testconfiguratie
  • Beeldscherm test SpectraCal CALman 5.13
Checkerboard zwart 0,184 cd/m²
Testconfiguratie
  • Beeldscherm test SpectraCal CALman 5.13
Checkerboard contrast 1.356 : 1
Testconfiguratie
  • Beeldscherm test SpectraCal CALman 5.13
Gamma 2,18
Testconfiguratie
  • Beeldscherm test SpectraCal CALman 5.13
Gamma (afwijking van 2,2) 0,02
Testconfiguratie
  • Beeldscherm test SpectraCal CALman 5.13
Kleurafwijking rood (Delta E 1994) 3,44
Testconfiguratie
  • Beeldscherm test SpectraCal CALman 5 i.c.m. X
  • Rite i1 Display Pro colorimeter
Kleurafwijking groen (Delta E 1994) 6,00
Testconfiguratie
  • Beeldscherm test SpectraCal CALman 5 i.c.m. X
  • Rite i1 Display Pro colorimeter
Kleurafwijking blauw (Delta E 1994) 15,09
Testconfiguratie
  • Beeldscherm test SpectraCal CALman 5 i.c.m. X
  • Rite i1 Display Pro colorimeter
Kleurafwijking cyaan (Delta E 1994) 2,54
Testconfiguratie
  • Beeldscherm test SpectraCal CALman 5 i.c.m. X
  • Rite i1 Display Pro colorimeter
Kleurafwijking magenta (Delta E 1994) 8,45
Testconfiguratie
  • Beeldscherm test SpectraCal CALman 5 i.c.m. X
  • Rite i1 Display Pro colorimeter
Kleurafwijking geel (Delta E 1994) 4,08
Testconfiguratie
  • Beeldscherm test SpectraCal CALman 5 i.c.m. X
  • Rite i1 Display Pro colorimeter
Gemiddelde kleurafwijking (Delta E 1994) 6,6
Testconfiguratie
  • Beeldscherm test SpectraCal CALman 5 i.c.m. X
  • Rite i1 Display Pro colorimeter
Gemiddelde grijsafwijking (Delta E 1994) 1,6
Testconfiguratie
  • Beeldscherm test SpectraCal CALman 5 i.c.m. X
  • Rite i1 Display Pro colorimeter
Kleurafwijking 75% wit (Delta E 2000) 2,43 mΔuv
Testconfiguratie
  • Beeldscherm test SpectraCal CALman 5 i.c.m. X
  • Rite i1 Display Pro colorimeter
Kleurafwijking 75% rood (Delta E 2000) 3,76 mΔuv
Testconfiguratie
  • Beeldscherm test SpectraCal CALman 5 i.c.m. X
  • Rite i1 Display Pro colorimeter
Kleurafwijking 75% groen (Delta E 2000) 5,48 mΔuv
Testconfiguratie
  • Beeldscherm test SpectraCal CALman 5 i.c.m. X
  • Rite i1 Display Pro colorimeter
Kleurafwijking 75% blauw (Delta E 2000) 16,07 mΔuv
Testconfiguratie
  • Beeldscherm test SpectraCal CALman 5 i.c.m. X
  • Rite i1 Display Pro colorimeter
Kleurafwijking 75% cyaan (Delta E 2000) 2,62 mΔuv
Testconfiguratie
  • Beeldscherm test SpectraCal CALman 5 i.c.m. X
  • Rite i1 Display Pro colorimeter
Kleurafwijking 75% magenta (Delta E 2000) 8,93 mΔuv
Testconfiguratie
  • Beeldscherm test SpectraCal CALman 5 i.c.m. X
  • Rite i1 Display Pro colorimeter
Kleurafwijking 75% geel (Delta E 2000) 3,93 mΔuv
Testconfiguratie
  • Beeldscherm test SpectraCal CALman 5 i.c.m. X
  • Rite i1 Display Pro colorimeter
Gemiddelde kleurafwijking (Delta E 2000) 5,8 mΔuv
Testconfiguratie
  • Beeldscherm test SpectraCal CALman 5.13
Kleurafwijking 100% wit (Delta E 2000) 3,11 mΔuv
Testconfiguratie
  • Beeldscherm test SpectraCal CALman 5 i.c.m. X
  • Rite i1 Display Pro colorimeter
Gemiddelde kleurafwijking excl. wit (Delta E 2000) 6,8
Testconfiguratie
  • Beeldscherm test SpectraCal CALman 5 i.c.m. X
  • Rite i1 Display Pro colorimeter
Gemiddelde grijsafwijking (Delta E 2000) 2,1 mΔuv
Testconfiguratie
  • Beeldscherm test SpectraCal CALman 5.13
sRGB dekking 69,7 %
Testconfiguratie
  • Beeldscherm test SpectraCal CALman 5.13
DCI-P3 dekking 51,7 %
Testconfiguratie
  • Beeldscherm test SpectraCal CALman 5.13
Rec 2020 dekking 37,2 %
Testconfiguratie
  • Beeldscherm test SpectraCal CALman 5.13

Alternatieven

HP Pavilion Gaming 15-ec2747nd (4P6K4EA)

  • AMD Ryzen 5 5600H
  • 16 GB
  • 15.6 inch
  • 1920x1080
  • Nvidia GeForce RTX 3050
  • 512 GB
  • Qwerty
  • 2.09 kg
  • Windows
 

Asus VivoBook Pro 14X N7400PC-KM010W

  • Intel Core i7 11370H
  • 16 GB
  • 14 inch
  • 2880x1800
  • Nvidia GeForce RTX 3050
  • 1024 GB
  • Qwerty
  • 1.50 kg
  • Windows
 

HP Envy 17-ch1720nd (54K91EA)

  • Intel Core i7 1195G7
  • 16 GB
  • 17.3 inch
  • 1920x1080
  • Nvidia GeForce MX450
  • 512 GB
  • Qwerty
  • 2.49 kg
  • Windows
 

Asus RoG Zephyrus Duo 16 GX650RX-LO080W

  • AMD Ryzen 9 6980HX
  • 32 GB
  • 16 inch
  • 2560x1600
  • Touchscreen
  • Nvidia GeForce RTX 3080 Max-P Design
  • 2048 GB
  • Qwerty
  • 2.60 kg
  • Windows
 

Asus RoG Zephyrus G14 GA402RK-L8032X

  • AMD Ryzen 9 6900HS
  • 32 GB
  • 14 inch
  • 2560x1600
  • AMD Radeon RX 6800S
  • 1024 GB
  • Qwerty
  • 1.7 kg
 

MSI Stealth GS77 12UHS-032NL

  • Intel Core i9 12900H
  • 64 GB
  • 17.3 inch
  • 3840x2160
  • Nvidia GeForce RTX 3080 Ti
  • 2048 GB
  • Qwerty
  • 2.91 kg
  • Windows Pro
 

Alienware x17 P48E002

  • Intel Core i7 12700H
  • 32 GB
  • 17.3 inch
  • 1920x1080
  • Nvidia GeForce RTX 3080 Max-Q Design
  • 1024 GB
  • Qwerty
  • 3.05 kg
  • Windows
 

Asus Asus RoG Strix Scar G733C

  • Intel Core i9 12950HX
  • 32 GB
  • 17.3 inch
  • Nvidia GeForce RTX 3080 Ti
  • 4096 GB
  • Qwerty
  • Windows
 

Corsair Voyager A1600

  • AMD Ryzen 9 6900HS
  • 32 GB
  • 16 inch
  • 2560x1600
  • AMD Radeon RX 6800M
  • 2000 GB
  • Qwerty
  • 3.6 kg
  • Windows
 

HP Victus 16-s0976nd

  • AMD Ryzen 7 7840HS
  • 16 GB
  • 16.1 inch
  • 1920x1080
  • Nvidia GeForce RTX 4070 Laptop GPU
  • 512 GB
  • Qwerty
  • 2.36 kg
  • Windows
 

Asus VivoBook M7400QE-KM032T

  • AMD Ryzen 9 5900HX
  • 32 GB
  • 14 inch
  • 2880x1800
  • Nvidia GeForce RTX 3050 Ti
  • 1024 GB
  • Qwerty
  • 1.48 kg
  • Windows
 

Lenovo Legion 5 Pro (82RF0009US)

  • Intel Core i7 12700H
  • 16 GB
  • 16 inch
  • 2560x1600
  • Nvidia GeForce RTX 3060
  • 2048 GB
  • Qwerty
  • 2.55 kg
  • Windows
 
0