Getest

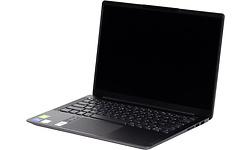
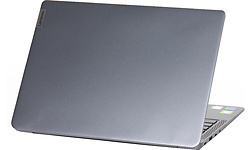
Lenovo IdeaPad 5 Pro 14ITL6 (82L300FSMH)

Prijsverloop

Dit product is niet (meer) verkrijgbaar bij de bij Hardware Info aangesloten shops.

Specificaties

Belangrijkste specificaties

Processor type Intel Core i7 1165G7
Geheugen capaciteit 16 GB
Scherm diagonaal 14 inch
Resolutie 2880x1800
Touchscreen
GPU type Nvidia GeForce MX450
Totale opslagcapaciteit 1.024 GB
Toetsenbordindeling Qwerty
Gewicht totaal 1,41 kg
Besturingssysteem (serie) Windows

Processor / Chipset / Geheugen

Processor serie Intel Core i7
Processor type Intel Core i7 1165G7
Processor klokfrequentie 2,8 GHz
Processor klokfrequentie (max. turbo) 4,7 GHz
Configureerbare TDP-down 12 W
Configureerbare TDP-up 28 W
Configureerbare TDP-downfrequentie 1 GHz
Configureerbare TDP-upfrequentie 3 GHz
Aantal processorcores 4
Geheugen capaciteit 16 GB
Type geheugen DDR4
Geheugen klokfrequentie 3.200 MHz
Geheugen form factor On-board
SODIMM sloten 0
Vrije SODIMM sloten 0
Werkgeheugen uitbreidbaar tot 16 GB

Scherm

Scherm diagonaal 14 inch
Resolutie 2880x1800
Verhouding 16:10
Pixeldichtheid 243 ppi
Scherm type (mat/glans) Mat
Paneeltype IPS
LED-achtergrondverlichting
Touchscreen
Maximale verversingsfrequentie 90 Hz

Graphics

GPU type Nvidia GeForce MX450
Geïntegreerde / losse GPU Losse chip
Videogeheugen 2 GB

Opslag

Totale opslagcapaciteit 1.024 GB
SSD opslagcapaciteit 1.024 GB
Beschikbaar opslaggeheugen 899 GB
Aantal harddisks / SSD's 1
Harddisk/SSD 1 capaciteit 1.024 GB
Harddisk/SSD 1 soort SSD/Flash
Harddisk/SSD 1 form factor M.2
Harddisk/SSD 1 merk/product Samsung MZVLB1T0HBLR-000L2
DVD branden
Blu-ray lezen
Blu-ray branden

Connectiviteit / Netwerk

Netwerkaansluiting (bedraad)
WiFi standaard 802.11ax (Wi-Fi 6)
WiFi adapter Intel(R) Wi-Fi 6 AX201 160Mhz
Bluetooth
Bluetooth-versie Bluetooth 5.1
4G (LTE)
5G

Aansluitingen

Smartcard
USB 3.2 - 5 Gb/s (Type-A) 2
USB 3.2 - 5 Gb/s (Type-C) 2
Cardreader - SD
Cardreader - MicroSD
DVI-uitgang
VGA-uitgang
HDMI-uitgang
Aantal HDMI-uitgangen 1
Micro HDMI-uitgang
HDMI-versie 2.0
DisplayPort-uitgang
Mini DisplayPort-uitgang
Analoge audio aansluitingen 1
Aansluiting dockingstation
Kensingtonslot

Toetsenbord en touchpad

Toetsenbordindeling Qwerty
Numeriek toetsenbord
Toetsenbordverlichting helderheidsniveaus 2
Toetsenbordverlichting kleur Wit
Touchpad afzonderlijke muistoetsen

Camera

Webcam
Webcam resolutie 0,9 MPixel
Tweede camera
Flitser
Camera Windows Hello compatible
Webcamschuifje

Sensors

Accelerometer
Vingerafdruklezer
NFC

Overige hardware

Trusted Platform Module (TPM)
Geïntegreerde microfoon

Maten en gewichten

Accu capaciteit (Wh) 57,6 Wh
Verwisselbare accu
Gewicht totaal 1,41 kg
Afmeting - Breedte 31,2 cm
Afmeting - Diepte 22,1 cm
Afmeting - Hoogte/Dikte 1,59 cm
Passief gekoeld

Software

Besturingssysteem Microsoft Windows 11 Home
Besturingssysteem (serie) Windows
Windows versie 21H2
Windows OS Build 22.000,613
Aantal bits OS 64 bit

Fabrikantsopgave eigenschappen

Garantie 2 jaar

Productcodes

SKU 82L300FSMH
EAN 0196118947532
Toegevoegd aan Hardware Info donderdag 10 maart 2022

Testresultaten

Dit product is door Hardware Info getest op maandag 25 april 2022.

Metro Exodus

Metro Exodus - 1920x1080 - Medium 16,6 fps
Testconfiguratie
  • Game benchmarks 2022
Metro Exodus - 1920x1080 - Medium (99p) 138,4 ms
Testconfiguratie
  • Game benchmarks 2022
Metro Exodus - 1920x1080 - Medium (99.9p) 146,36 ms
Testconfiguratie
  • Game benchmarks 2022
Metro Exodus - 1920x1080 - Ultra 9,2 fps
Testconfiguratie
  • Game benchmarks 2022
Metro Exodus - 1920x1080 - Ultra (99p) 209,22 ms
Testconfiguratie
  • Game benchmarks 2022
Metro Exodus - 1920x1080 - Ultra (99.9p) 299,23 ms
Testconfiguratie
  • Game benchmarks 2022

Total War: Troy

Total War: Troy - 1920x1080 - Medium 60,8 fps
Testconfiguratie
  • Game benchmarks 2022
Total War: Troy - 1920x1080 - Medium (99p) 19,78 ms
Testconfiguratie
  • Game benchmarks 2022
Total War: Troy - 1920x1080 - Medium (99.9p) 21,21 ms
Testconfiguratie
  • Game benchmarks 2022
Total War: Troy - 1920x1080 - Ultra 28,8 fps
Testconfiguratie
  • Game benchmarks 2022
Total War: Troy - 1920x1080 - Ultra (99p) 45,87 ms
Testconfiguratie
  • Game benchmarks 2022
Total War: Troy - 1920x1080 - Ultra (99.9p) 59,1 ms
Testconfiguratie
  • Game benchmarks 2022
Total War: Troy - 2560x1440 - Medium 40,3 fps
Testconfiguratie
  • Game benchmarks 2022
Total War: Troy - 2560x1440 - Medium (99p) 36,9 ms
Testconfiguratie
  • Game benchmarks 2022
Total War: Troy - 2560x1440 - Medium (99.9p) 38,37 ms
Testconfiguratie
  • Game benchmarks 2022
Total War: Troy - 2560x1440 - Ultra 20,3 fps
Testconfiguratie
  • Game benchmarks 2022
Total War: Troy - 2560x1440 - Ultra (99p) 61,92 ms
Testconfiguratie
  • Game benchmarks 2022
Total War: Troy - 2560x1440 - Ultra (99.9p) 68,43 ms
Testconfiguratie
  • Game benchmarks 2022

Far Cry: New Dawn

Far Cry: New Dawn - 1920x1080 - Medium 46,9 fps
Testconfiguratie
  • Game benchmarks 2022
Far Cry: New Dawn - 1920x1080 - Medium (99p) 28,8 ms
Testconfiguratie
  • Game benchmarks 2022
Far Cry: New Dawn - 1920x1080 - Medium (99.9p) 53,79 ms
Testconfiguratie
  • Game benchmarks 2022
Far Cry: New Dawn - 1920x1080 - Ultra 34,7 fps
Testconfiguratie
  • Game benchmarks 2022
Far Cry: New Dawn - 1920x1080 - Ultra (99p) 41,84 ms
Testconfiguratie
  • Game benchmarks 2022
Far Cry: New Dawn - 1920x1080 - Ultra (99.9p) 60,87 ms
Testconfiguratie
  • Game benchmarks 2022
Far Cry: New Dawn - 2560x1440 - Medium 32,4 fps
Testconfiguratie
  • Game benchmarks 2022
Far Cry: New Dawn - 2560x1440 - Medium (99p) 40,98 ms
Testconfiguratie
  • Game benchmarks 2022
Far Cry: New Dawn - 2560x1440 - Medium (99.9p) 55,66 ms
Testconfiguratie
  • Game benchmarks 2022
Far Cry: New Dawn - 2560x1440 - Ultra 23,7 fps
Testconfiguratie
  • Game benchmarks 2022
Far Cry: New Dawn - 2560x1440 - Ultra (99p) 64,77 ms
Testconfiguratie
  • Game benchmarks 2022
Far Cry: New Dawn - 2560x1440 - Ultra (99.9p) 108,33 ms
Testconfiguratie
  • Game benchmarks 2022

F1 2020

F1 2020 (DX12) - 1920x1080 - Medium 74,3 fps
Testconfiguratie
  • Game benchmarks 2022
F1 2020 (DX12) - 1920x1080 - Medium (99p) 16,6 ms
Testconfiguratie
  • Game benchmarks 2022
F1 2020 (DX12) - 1920x1080 - Medium (99.9p) 18,8 ms
Testconfiguratie
  • Game benchmarks 2022
F1 2020 (DX12) - 1920x1080 - Ultra 36,4 fps
Testconfiguratie
  • Game benchmarks 2022
F1 2020 (DX12) - 1920x1080 - Ultra (99p) 34,8 ms
Testconfiguratie
  • Game benchmarks 2022
F1 2020 (DX12) - 1920x1080 - Ultra (99.9p) 37,1 ms
Testconfiguratie
  • Game benchmarks 2022
F1 2020 (DX12) - 2560x1440 - Medium 50,2 fps
Testconfiguratie
  • Game benchmarks 2022
F1 2020 (DX12) - 2560x1440 - Medium (99p) 23,8 ms
Testconfiguratie
  • Game benchmarks 2022
F1 2020 (DX12) - 2560x1440 - Medium (99.9p) 26,8 ms
Testconfiguratie
  • Game benchmarks 2022
F1 2020 (DX12) - 2560x1440 - Ultra 27 fps
Testconfiguratie
  • Game benchmarks 2022
F1 2020 (DX12) - 2560x1440 - Ultra (99p) 47,4 ms
Testconfiguratie
  • Game benchmarks 2022
F1 2020 (DX12) - 2560x1440 - Ultra (99.9p) 50,1 ms
Testconfiguratie
  • Game benchmarks 2022
F1 2020 (DX12) - 3840x2160 - Medium 25,8 fps
Testconfiguratie
  • Game benchmarks 2022
F1 2020 (DX12) - 3840x2160 - Medium (99p) 45,4 ms
Testconfiguratie
  • Game benchmarks 2022
F1 2020 (DX12) - 3840x2160 - Medium (99.9p) 48 ms
Testconfiguratie
  • Game benchmarks 2022
F1 2020 (DX12) - 3840x2160 - Ultra 11,8 fps
Testconfiguratie
  • Game benchmarks 2022
F1 2020 (DX12) - 3840x2160 - Ultra (99p) 117,9 ms
Testconfiguratie
  • Game benchmarks 2022
F1 2020 (DX12) - 3840x2160 - Ultra (99.9p) 121,2 ms
Testconfiguratie
  • Game benchmarks 2022

Geluidstest

Noise floor 14 dB(A)
Testconfiguratie
  • Geluidsdichte ruimte 2021
  • Larson Davis SoundAdvisor Model 831C
Afstand geluidsmeting 50 cm
Testconfiguratie
  • Geluidsdichte ruimte 2021
  • Larson Davis SoundAdvisor Model 831C
WebXPRT 3 - LAeq 17 dB
Testconfiguratie
  • Geluidsdichte ruimte 2021
  • Larson Davis SoundAdvisor Model 831C
PCMark 10 Express - LAeq 25 dB
Testconfiguratie
  • Geluidsdichte ruimte 2021
  • Larson Davis SoundAdvisor Model 831C
Blender - LAeq 39,4 dB
Testconfiguratie
  • Geluidsdichte ruimte 2021
  • Larson Davis SoundAdvisor Model 831C
F1 2020 - LAeq 41,4 dB
Testconfiguratie
  • Geluidsdichte ruimte 2021
  • Larson Davis SoundAdvisor Model 831C

PCMark 10 Storage

PCMark 10 - Gebruiken Adobe Photoshop Heavy 555
Testconfiguratie
  • Windows benchmarks
PCMark 10 - Storage - Totaalscore - Toegangstijd 107
Testconfiguratie
  • Windows benchmarks
PCMark 10 - Storage - Totaalscore - Bandbreedte 253,32
PCMark 10 - Storage - Totaalscore 1.575
Testconfiguratie
  • Windows benchmarks
PCMark 10 - 2.37GB_(399_JPEGs)_leestest 268
PCMark 10 - 2.37GB_(399_JPEGs)_kopieertest 403
Testconfiguratie
  • Windows benchmarks
PCMark 10 - 2.37GB_(399_JPEGs)_schrijftest 249
Testconfiguratie
  • Windows benchmarks
PCMark 10 - 2GB_(4_ISOs)_leestest 1.983
Testconfiguratie
  • Windows benchmarks
PCMark 10 - 2GB_(4_ISOs)_kopieertest 1.599
Testconfiguratie
  • Windows benchmarks
PCMark 10 - 2GB_(4_ISOs)_schrijftest 1.738
Testconfiguratie
  • Windows benchmarks
PCMark 10 - Gebruiken Microsoft PowerPoint 121
Testconfiguratie
  • Windows benchmarks
PCMark 10 - Gebruiken Microsoft Excel 75
Testconfiguratie
  • Windows benchmarks
PCMark 10 - Gebruiken Adobe Photoshop Light 168
Testconfiguratie
  • Windows benchmarks
PCMark 10 - Starten Windows 10 235
Testconfiguratie
  • Windows benchmarks
PCMark 10 - Gebruiken Adobe InDesign 159
Testconfiguratie
  • Windows benchmarks
PCMark 10 - Gebruiken Adobe Illustrator 106
PCMark 10 - Gebruiken Adobe After Effects 221
Testconfiguratie
  • Windows benchmarks
PCMark 10 - Starten Overwatch 223
Testconfiguratie
  • Windows benchmarks
PCMark 10 - Starten Call of Duty: Black Ops 4 502
Testconfiguratie
  • Windows benchmarks
PCMark 10 - Starten Battlefield V 553
Testconfiguratie
  • Windows benchmarks
PCMark 10 - Starten Adobe Photoshop 130
Testconfiguratie
  • Windows benchmarks
PCMark 10 - Starten Adobe Lightroom 84
Testconfiguratie
  • Windows benchmarks
PCMark 10 - Starten Adobe Premiere_Pro 142
Testconfiguratie
  • Windows benchmarks
PCMark 10 - Starten Adobe Illustrator 86
Testconfiguratie
  • Windows benchmarks
PCMark 10 - Starten Adobe After Effects 120
Testconfiguratie
  • Windows benchmarks
PCMark 10 - Starten Adobe Acrobat 166
Testconfiguratie
  • Windows benchmarks
PCMark 10 - Quick Storage - Totaalscore 1.448
Testconfiguratie
  • Windows benchmarks
PCMark 10 - Quick Storage - Totaalscore - Bandbreedte 178,04
Testconfiguratie
  • Windows benchmarks
PCMark 10 - Quick Storage - Totaalscore - Toegangstijd 89
Testconfiguratie
  • Windows benchmarks

Platform onafhankelijke tests

Opstarttijd 22 sec.
Testconfiguratie
  • Platform onafhankelijke tests
JetStream 2 199,263
Testconfiguratie
  • Platform onafhankelijke tests
webXPRT 3 296
Testconfiguratie
  • Platform onafhankelijke tests
webXPRT 3 - Photo Enhancement 224 ms
Testconfiguratie
  • Platform onafhankelijke tests
webXPRT 3 - Organize Album using AI 1.660 ms
Testconfiguratie
  • Platform onafhankelijke tests
webXPRT 3 - Stock Option Pricing 109 ms
Testconfiguratie
  • Platform onafhankelijke tests
webXPRT 3 - Encrypt Notes and OCR Scan 1.611 ms
Testconfiguratie
  • Platform onafhankelijke tests
webXPRT 3 - Sales Graphs 300 ms
Testconfiguratie
  • Platform onafhankelijke tests
webXPRT 3 - Online Homework 974 ms
Testconfiguratie
  • Platform onafhankelijke tests
Geekbench 5 - Multi 4.963
Testconfiguratie
  • Platform onafhankelijke tests
Geekbench 5 - Multi Crypto 5.291
Testconfiguratie
  • Platform onafhankelijke tests
Geekbench 5 - Multi Integer 4.728
Testconfiguratie
  • Platform onafhankelijke tests
Geekbench 5 - Multi Floating Point 5.417
Testconfiguratie
  • Platform onafhankelijke tests
Geekbench 5 - Single 1.571
Testconfiguratie
  • Platform onafhankelijke tests
Geekbench 5 - Single Crypto 3.930
Testconfiguratie
  • Platform onafhankelijke tests
Geekbench 5 - Single Integer 1.374
Testconfiguratie
  • Platform onafhankelijke tests
Geekbench 5 - Single Floating Point 1.604
Testconfiguratie
  • Platform onafhankelijke tests
Geekbench 5 - OpenCL 33.774
Testconfiguratie
  • Platform onafhankelijke tests
WiFi speedtest 2.4GHz receive 219 Mbit/s
Testconfiguratie
  • Platform onafhankelijke tests
WiFi speedtest 2.4GHz send 178 Mbit/s
Testconfiguratie
  • Platform onafhankelijke tests
WiFi speedtest 5.0GHz receive 644 Mbit/s
Testconfiguratie
  • Platform onafhankelijke tests
WiFi speedtest 5.0GHz send 232 Mbit/s
Testconfiguratie
  • Platform onafhankelijke tests

Windows benchmarks

3DMark - Fire Strike 5.322
Testconfiguratie
  • Windows benchmarks
3DMark - Fire Strike Graphics 5.783
Testconfiguratie
  • Windows benchmarks
3DMark - Fire Strike Physics 12.581
Testconfiguratie
  • Windows benchmarks
3DMark - Fire Strike Combined 2.162
Testconfiguratie
  • Windows benchmarks
3DMark - Time Spy 2.524
Testconfiguratie
  • Windows benchmarks
3DMark - Time Spy Graphics 2.329
Testconfiguratie
  • Windows benchmarks
3DMark - Time Spy CPU 4.813
Testconfiguratie
  • Windows benchmarks
3DMark - Night Raid 21.523
Testconfiguratie
  • Windows benchmarks
3DMark - Night Raid Graphics 28.143
Testconfiguratie
  • Windows benchmarks
3DMark - Night Raid CPU 9.226
Testconfiguratie
  • Windows benchmarks
Cinebench R15 - Single 228
Testconfiguratie
  • Windows benchmarks
Cinebench R15 - Multi 1.042
Testconfiguratie
  • Windows benchmarks
Cinebench R20 - Single 574
Testconfiguratie
  • Windows benchmarks
Cinebench R20 - Multi 2.415
Testconfiguratie
  • Windows benchmarks
Cinebench R23 - Single 1.521
Testconfiguratie
  • Windows benchmarks
Cinebench R23 - Multi 6.251
Testconfiguratie
  • Windows benchmarks
Blender duurtest run #1 41,28
Testconfiguratie
  • Windows benchmarks
Blender duurtest run #2 45,83
Testconfiguratie
  • Windows benchmarks
Blender duurtest run #3 45,8
Testconfiguratie
  • Windows benchmarks
Blender duurtest run #4 45,8
Testconfiguratie
  • Windows benchmarks
Blender duurtest run #5 45,26
Testconfiguratie
  • Windows benchmarks
Blender duurtest run #6 45,4
Testconfiguratie
  • Windows benchmarks
Blender duurtest run #7 45,43
Testconfiguratie
  • Windows benchmarks
Blender duurtest run #8 45,67
Testconfiguratie
  • Windows benchmarks
Blender duurtest run #9 45,71
Testconfiguratie
  • Windows benchmarks
Blender duurtest run #10 46,61
Testconfiguratie
  • Windows benchmarks
Blender duurtest run #11 46,1
Testconfiguratie
  • Windows benchmarks
Blender duurtest run #12 46,91
Testconfiguratie
  • Windows benchmarks
Blender duurtest run #13 45,94
Testconfiguratie
  • Windows benchmarks
Blender duurtest run #14 46,21
Testconfiguratie
  • Windows benchmarks
Blender duurtest run #15 46,78
Testconfiguratie
  • Windows benchmarks
Blender duurtest run #16 46,47
Testconfiguratie
  • Windows benchmarks
Blender duurtest run #17 46,21
Testconfiguratie
  • Windows benchmarks
Blender duurtest run #18 46,03
Testconfiguratie
  • Windows benchmarks
Blender duurtest run #19 46,45
Testconfiguratie
  • Windows benchmarks
Blender duurtest run #20 45,98
Testconfiguratie
  • Windows benchmarks
Blender duurtest run #21 46,82
Testconfiguratie
  • Windows benchmarks
Blender duurtest run #22 46,12
Testconfiguratie
  • Windows benchmarks
Blender duurtest run #23 46,58
Testconfiguratie
  • Windows benchmarks
Blender duurtest run #24 45,83
Testconfiguratie
  • Windows benchmarks
Blender duurtest run #25 46,95
Testconfiguratie
  • Windows benchmarks
Blender duurtest run #26 46,41
Testconfiguratie
  • Windows benchmarks
PCMark 10 Extended 5.051
Testconfiguratie
  • Windows benchmarks
PCMark 10 Essentials 8.720
Testconfiguratie
  • Windows benchmarks
PCMark 10 App Start-up 12.035
Testconfiguratie
  • Windows benchmarks
PCMark 10 Video Conferencing 6.936
Testconfiguratie
  • Windows benchmarks
PCMark 10 Web Browsing 7.945
Testconfiguratie
  • Windows benchmarks
PCMark 10 Productivity 8.657
Testconfiguratie
  • Windows benchmarks
PCMark 10 Spreadsheets 9.854
Testconfiguratie
  • Windows benchmarks
PCMark 10 Writing 7.606
Testconfiguratie
  • Windows benchmarks
PCMark 10 Digital Content Creation 5.386
Testconfiguratie
  • Windows benchmarks
PCMark 10 Photo Editing 5.857
Testconfiguratie
  • Windows benchmarks
PCMark 10 Rendering and Visualization 5.373
Testconfiguratie
  • Windows benchmarks
PCMark 10 Video Editing 4.966
Testconfiguratie
  • Windows benchmarks
PCMark 10 Gaming 4.326
Testconfiguratie
  • Windows benchmarks
PCMark 10 Graphics 5.578
Testconfiguratie
  • Windows benchmarks
PCMark 10 Physics 13.305
Testconfiguratie
  • Windows benchmarks
PCMark 10 Combined 2.128
Testconfiguratie
  • Windows benchmarks

Energieverbruik / Accu

Energieverbruik uit 0,2 W
Testconfiguratie
  • Windows benchmarks
Energieverbruik adapter (zonder laptop) 0 W
Testconfiguratie
  • Windows benchmarks
Energieverbruik idle 14,2 W
Testconfiguratie
  • Windows benchmarks
Browser accutest - 180 cd/m2 583 min.
Testconfiguratie
  • Windows benchmarks
PCMark 10 Accu Digital 4.113
Testconfiguratie
  • Windows benchmarks
PCMark 10 Accu Essentials 6.735
Testconfiguratie
  • Windows benchmarks
PCMark 10 Accu Productivity 7.127
Testconfiguratie
  • Windows benchmarks
PCMark 10 Accu Duration in Minuten 126
Testconfiguratie
  • Windows benchmarks
PCMark 10 Accu Aantal Runs 5
Testconfiguratie
  • Windows benchmarks

Testresultaten beeldscherm

Gemeten kleurruimte sRGB
Testconfiguratie
  • Beeldscherm test SpectraCal CALman 5.13
Kleurtemperatuur 6.875 K
Testconfiguratie
  • Beeldscherm test SpectraCal CALman 5.13
Helderheid wit 389 cd/m²
Testconfiguratie
  • Beeldscherm test SpectraCal CALman 5.13
Helderheid zwart 0,26 cd/m²
Testconfiguratie
  • Beeldscherm test SpectraCal CALman 5.13
Contrast 1.496,9 : 1
Testconfiguratie
  • Beeldscherm test SpectraCal CALman 5.13
Checkerboard wit 388,828 cd/m²
Testconfiguratie
  • Beeldscherm test SpectraCal CALman 5.13
Checkerboard zwart 0,256 cd/m²
Testconfiguratie
  • Beeldscherm test SpectraCal CALman 5.13
Checkerboard contrast 1.519 : 1
Testconfiguratie
  • Beeldscherm test SpectraCal CALman 5.13
Gamma 2,19
Testconfiguratie
  • Beeldscherm test SpectraCal CALman 5.13
Gamma (afwijking van 2,2) 0,01
Testconfiguratie
  • Beeldscherm test SpectraCal CALman 5.13
Kleurafwijking rood (Delta E 1994) 2,85
Testconfiguratie
  • Beeldscherm test SpectraCal CALman 5 i.c.m. X
  • Rite i1 Display Pro colorimeter
Kleurafwijking groen (Delta E 1994) 2,58
Testconfiguratie
  • Beeldscherm test SpectraCal CALman 5 i.c.m. X
  • Rite i1 Display Pro colorimeter
Kleurafwijking blauw (Delta E 1994) 1,32
Testconfiguratie
  • Beeldscherm test SpectraCal CALman 5 i.c.m. X
  • Rite i1 Display Pro colorimeter
Kleurafwijking cyaan (Delta E 1994) 3,29
Testconfiguratie
  • Beeldscherm test SpectraCal CALman 5 i.c.m. X
  • Rite i1 Display Pro colorimeter
Kleurafwijking magenta (Delta E 1994) 1,60
Testconfiguratie
  • Beeldscherm test SpectraCal CALman 5 i.c.m. X
  • Rite i1 Display Pro colorimeter
Kleurafwijking geel (Delta E 1994) 0,97
Testconfiguratie
  • Beeldscherm test SpectraCal CALman 5 i.c.m. X
  • Rite i1 Display Pro colorimeter
Gemiddelde kleurafwijking (Delta E 1994) 2,1
Testconfiguratie
  • Beeldscherm test SpectraCal CALman 5 i.c.m. X
  • Rite i1 Display Pro colorimeter
Gemiddelde grijsafwijking (Delta E 1994) 3,9
Testconfiguratie
  • Beeldscherm test SpectraCal CALman 5 i.c.m. X
  • Rite i1 Display Pro colorimeter
Kleurafwijking 75% wit (Delta E 2000) 5,42 mΔuv
Testconfiguratie
  • Beeldscherm test SpectraCal CALman 5 i.c.m. X
  • Rite i1 Display Pro colorimeter
Kleurafwijking 75% rood (Delta E 2000) 2,87 mΔuv
Testconfiguratie
  • Beeldscherm test SpectraCal CALman 5 i.c.m. X
  • Rite i1 Display Pro colorimeter
Kleurafwijking 75% groen (Delta E 2000) 2,14 mΔuv
Testconfiguratie
  • Beeldscherm test SpectraCal CALman 5 i.c.m. X
  • Rite i1 Display Pro colorimeter
Kleurafwijking 75% blauw (Delta E 2000) 1,22 mΔuv
Testconfiguratie
  • Beeldscherm test SpectraCal CALman 5 i.c.m. X
  • Rite i1 Display Pro colorimeter
Kleurafwijking 75% cyaan (Delta E 2000) 3,16 mΔuv
Testconfiguratie
  • Beeldscherm test SpectraCal CALman 5 i.c.m. X
  • Rite i1 Display Pro colorimeter
Kleurafwijking 75% magenta (Delta E 2000) 1,54 mΔuv
Testconfiguratie
  • Beeldscherm test SpectraCal CALman 5 i.c.m. X
  • Rite i1 Display Pro colorimeter
Kleurafwijking 75% geel (Delta E 2000) 1,11 mΔuv
Testconfiguratie
  • Beeldscherm test SpectraCal CALman 5 i.c.m. X
  • Rite i1 Display Pro colorimeter
Gemiddelde kleurafwijking (Delta E 2000) 2,7 mΔuv
Testconfiguratie
  • Beeldscherm test SpectraCal CALman 5.13
Kleurafwijking 100% wit (Delta E 2000) 4,13 mΔuv
Testconfiguratie
  • Beeldscherm test SpectraCal CALman 5 i.c.m. X
  • Rite i1 Display Pro colorimeter
Gemiddelde kleurafwijking excl. wit (Delta E 2000) 2,0
Testconfiguratie
  • Beeldscherm test SpectraCal CALman 5 i.c.m. X
  • Rite i1 Display Pro colorimeter
Gemiddelde grijsafwijking (Delta E 2000) 4,3 mΔuv
Testconfiguratie
  • Beeldscherm test SpectraCal CALman 5.13
sRGB dekking 99,9 %
Testconfiguratie
  • Beeldscherm test SpectraCal CALman 5.13
DCI-P3 dekking 81,6 %
Testconfiguratie
  • Beeldscherm test SpectraCal CALman 5.13
Rec 2020 dekking 58,7 %
Testconfiguratie
  • Beeldscherm test SpectraCal CALman 5.13

Alternatieven

HP Pavilion Gaming 15-ec2747nd (4P6K4EA)

  • AMD Ryzen 5 5600H
  • 16 GB
  • 15.6 inch
  • 1920x1080
  • Nvidia GeForce RTX 3050
  • 512 GB
  • Qwerty
  • 2.09 kg
  • Windows
 

Asus VivoBook Pro 14X N7400PC-KM010W

  • Intel Core i7 11370H
  • 16 GB
  • 14 inch
  • 2880x1800
  • Nvidia GeForce RTX 3050
  • 1024 GB
  • Qwerty
  • 1.50 kg
  • Windows
 

HP 17-cn1956nd (545C9EA)

  • Intel Core i5-1155G7
  • 16 GB
  • 17.3 inch
  • 1920x1080
  • Nvidia GeForce MX350
  • 1024 GB
  • Qwerty
  • 2.14 kg
  • Windows
 

HP Envy 17-ch1720nd (54K91EA)

  • Intel Core i7 1195G7
  • 16 GB
  • 17.3 inch
  • 1920x1080
  • Nvidia GeForce MX450
  • 512 GB
  • Qwerty
  • 2.49 kg
  • Windows
 

Asus RoG Zephyrus Duo 16 GX650RX-LO080W

  • AMD Ryzen 9 6980HX
  • 32 GB
  • 16 inch
  • 2560x1600
  • Touchscreen
  • Nvidia GeForce RTX 3080 Max-P Design
  • 2048 GB
  • Qwerty
  • 2.60 kg
  • Windows
 

Asus RoG Zephyrus G14 GA402RK-L8032X

  • AMD Ryzen 9 6900HS
  • 32 GB
  • 14 inch
  • 2560x1600
  • AMD Radeon RX 6800S
  • 1024 GB
  • Qwerty
  • 1.7 kg
 

MSI Stealth GS77 12UHS-032NL

  • Intel Core i9 12900H
  • 64 GB
  • 17.3 inch
  • 3840x2160
  • Nvidia GeForce RTX 3080 Ti
  • 2048 GB
  • Qwerty
  • 2.91 kg
  • Windows Pro
 

Alienware x17 P48E002

  • Intel Core i7 12700H
  • 32 GB
  • 17.3 inch
  • 1920x1080
  • Nvidia GeForce RTX 3080 Max-Q Design
  • 1024 GB
  • Qwerty
  • 3.05 kg
  • Windows
 

HP Pavilion 17-cn0833nd

  • Intel Core i7 1165G7
  • 8 GB
  • 17.3 inch
  • 1920x1080
  • Nvidia GeForce MX450
  • 512 GB
  • Qwerty
  • 2.15 kg
  • Windows
 

Asus Asus RoG Strix Scar G733C

  • Intel Core i9 12950HX
  • 32 GB
  • 17.3 inch
  • Nvidia GeForce RTX 3080 Ti
  • 4096 GB
  • Qwerty
  • Windows
 

Asus TUF Gaming A15 FA507NV-LP066W

  • AMD Ryzen 7 7735HS
  • 16 GB
  • 15.6 inch
  • 1920x1080
  • Nvidia GeForce RTX 4060 Laptop GPU
  • 512 GB
  • Qwerty
  • 2.1 kg
  • Windows
 

Asus VivoBook K3500PH-L1115T

  • Intel Core i7 11370H
  • 16 GB
  • 15.6 inch
  • 1920x1080
  • Nvidia GeForce GTX 1650 Ti Max-Q Design
  • 512 GB
  • Qwerty
  • 1.65 kg
  • Windows
 
0